2014 47th Hawaii International Conference on System Science
Process-driven Data Quality Management – An Application of the Combined Conceptual Life Cycle Model Paul Glowalla University of Cologne
[email protected]
Patryk Balazy University of Cologne
[email protected]
Dirk Basten University of Cologne
[email protected]
Ali Sunyaev University of Cologne
[email protected]
within processes provides the context for data’s production process and purpose. Knowledge about data’s purpose right from the beginning of the production process contributes to data quality improvements [17]. Knight [14] provides a conceptual model for an evaluation of data quality with regard to information products (IPs). In contrast to other process-driven data quality approaches, Knight’s combined conceptual life cycle (CCLC) model allows focusing on specific IPs, explicitly relating well-established data quality dimensions to IP production processes. However, to the best of our knowledge, the model has not been applied yet to explore and improve data quality of IP production processes. Since we consider the model adequate for this purpose, we apply the model to answer the following research question: How can the CCLC model be used for processdriven data quality exploration and improvement of IPs? We present an in-depth case study from a mediumsized company in the industrial sector, which produces security products. Due to strategic changes, the company had increased need for high data quality of critical IPs. The CCLC model is applied to the company’s certification process, which is critical for product development and production. We explore the impact of already conducted process optimization on data quality and identify further potential for process improvements. The results add to the body of knowledge by presenting a new application scenario for the CCLC model and by suggesting improvements for its application. Furthermore, the paper provides practitioners with a detailed description of the model’s application, including experienced benefits and limitations.
Abstract Process-driven data quality management, which allows sustaining data quality improvements within and beyond the IS domain, is increasingly important. The emphasis on and the integration of data quality into process models allows for a detailed, contextspecific definition as well as understanding of data quality (dimensions) and, thus, supports communication across stakeholders. Extant process modeling approaches lack an explicit reference from data quality dimensions to context-specific information product (IP) production. Therefore, we provide a process-driven application of the combined conceptual life cycle (CCLC) model for process exploration and data quality improvement. The paper presents an interpretive, in-depth case study in a medium-sized company, which launched a process optimization initiative to improve data quality. The results show benefits and limitations of the approach, allowing practitioners to tailor the approach to their needs. Based on our insights, suggestions for further improvements of the CCLC model for a process-driven IP production approach are provided.
1. Introduction Whereas adequate data quality is critical for achieving business goals [23], poor data quality may lead to substantial direct and indirect costs [10]. With the purpose of improving data quality for its intended purpose and with a long-term perspective, data quality improvements need to be process-driven [2, 6, 7]. In contrast to mere modifications of data values, adapting a process to produce high quality data allows to sustain improvements [4, 24]. Additionally, considering data 978-1-4799-2504-9/14 $31.00 © 2014 IEEE DOI 10.1109/HICSS.2014.575
4700
Next, we provide the background on data quality research with regard to the CCLC model (section 2) and then describe the applied case study research approach, including a brief description of the research setting as well as data collection and analysis (section 3). Subsequently, we demonstrate the application of the CCLC model for analyzing the certification process (section 4). The findings are presented by illustrating the process (section 4.1) and providing an overview of data quality dimensions within the case and CCLC model context (section 4.2). Finally, the data quality issues are described following the steps and IP production within the certification process (section 4.3, 4.4, and 4.5). Finally, benefits and implications of our case study findings are discussed and outlook for further research is provided (section 5).
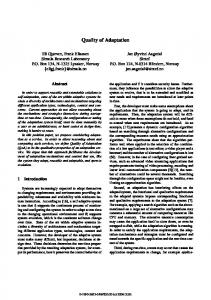
Several data quality process modeling approaches exist (e.g., [19, 26]). One of the most prominent ones is the information production map (IP-MAP), an extension of the information manufacturing system (IMS) [1, 26]. The IP-MAP focuses on IP production, allowing the representation of how an IP is created from raw and component data and how it is delivered from data source to data consumer. Instead of visually representing the IP production, other approaches integrate the data quality perspective into broadly applied process models, allowing more sophisticated assessments of data quality (e.g., [23]). However, visually representing data quality in process models supports the identification of relevant data quality aspects in process contexts and supports communication with stakeholders [9, 15, 21]. Without general agreement on a set of data quality dimensions or their exact meaning [2, 6, 8], a context-specific and intuitive approach is even more important since organizations may maintain hundreds of process models used and customized by non-modeling experts [25]. Mainly based on Wang and Strong’s [29] adapted classification of data quality dimensions and Liu and Chi’s [18] data quality life cycle model, Knight [14] provides a conceptually founded model, relating data quality dimensions to the IP production life cycle (cf. Figure 1). The IP production stages, from data collection to data application, reference data quality categories (e.g., syntactic quality) and according data quality dimensions (e.g., accuracy, completeness). The model supports a detailed investigation of IPs by integrating the broadly applied categorization of data quality dimensions into the IP production process. Hence, we see the model especially useful for exploring business processes to context-specifically incorporate data quality. Besides the model’s application in a survey for assessing web-specific data quality [13], we are not aware of further applications. To evaluate its applicability in a process management context, the CCLC model is applied within a company’s data quality initiative.
2. Background The prominent fitness-for-use approach on data quality [5, 20, 29] implicates that data quality depends on the context in which data is used. Adopting the fitness-for-use approach, we use data quality and information quality as interchangeable terms and apply the underlying classification of data quality dimensions [29]. Processes are logical sequences of tasks where goods and services are created or where the creation is coordinated using resources [3]. Process-driven data quality management aims to identify root causes of poor data quality [4, 24]. In contrast to mere data correction, flawed processes are adjusted for sustaining the improvements. To conduct process control or redesign activities, process modeling is mandatory providing the means to understand and communicate processes [2, 8]. Considering the applied process definition, process-driven data quality management is not restricted to the IS domain. This is corroborated by the high context-dependency of data quality and the entailed need to define data quality and applicable dimensions within the given context [2, 14, 20].
4701
Figure 1. The combined conceptual life cycle model [13] one is considered the organization’s critical process due to the complexity of activities in research & development (R&D) and production. Therefore, our case study focuses on the certification process as our unit of analysis, which was redesigned at the end of 2009. We emphasize that the unit of analysis was not determined prior to the case study. Applying the strength of the case study approach, the certification process emerged as critical by being perceived as the source for data quality problems by several stakeholders. Furthermore, the certification cannot be clearly distinguished from its context and is subject to stakeholders’ interpretation, especially since it was not documented at the beginning (cf. section 3.4). For on-going quality improvement, the company has a process-oriented management system fulfilling DIN EN ISO 9001. With the process redesign, the company implemented an enterprise resource planning (ERP) system and a document management system. All business processes are supported by these information technology (IT) systems, allowing for fast information dissemination across business activities. Additionally, business intelligence software allows data analysis based on collected data. The ERP system is an off-the-shelf application. In contrast to selfdeveloped systems, its configuration is limited if the ERP system is not customized. In the examined optimization project, customization of the ERP system was avoided entailing the challenge to stay within the ERP system’s capabilities.
3. Research approach Case studies are suitable to answer how and why questions [27, 30]. Interpretive case studies are recommended for understanding human action in social and organizational contexts [11]. Hence, we conducted a longitudinal, interpretive, in-depth single case study [11] to gain an understanding how to use the CCLC model in a complex socio-technological company context.
3.1 Case company The medium-sized1 company, with about 200 employees and located in Germany, is settled in the textile and chemical industry, amongst others producing security relevant apparel. The product management was extended by hiring new employees and gaining additional know-how to increase product diversity and enter new market segments. Additionally, in-house production was extended and new products needed to be specified for production. Hence, new and on-going development of products and supporting technologies is crucial for the company’s success. The transformation of a development product into a salable 1
As defined by the European commission: http://ec.europa.eu/enterprise/policies/sme/facts-figuresanalysis/sme-definition/index_en.htm 4702
Process redesign and the company-wide ERP system implementation, including the entailed organizational and technological changes, add to the complexity of the organizational setting. However, we selected the company for applying the CCLC model for two reasons. First, the company’s size allows a detailed examination of the certification process across departments. Due to a rather small number of key stakeholders, a holistic perspective of the process can be provided more easily compared to large organizations. Second, we had full access to the company. Since one of the authors works for the examined company, deep insight could be gained due to extensive data collection.
3.3 Data analysis As typical for interpretive case studies, data collection and analysis overlapped, allowing iterative building of shared understanding [11]. Particularly, the iterative approach allowed understanding single IP production steps (parts) within the entire process (whole) and relating global data quality issues back to the IP production steps. We analyzed the data based on the CCLC model in parallel to the on-going process optimization. The CCLC model was used as a sensitizing device [11] supporting identification of relevant data quality issues and dimensions. However, the understanding in the specific real world context was subject to the interpretation by the participants and researchers [11, 22], while the fully-involved researcher helped to bridge the gap between participants and the conceptually-driven perspective.
3.2 Data collection One of the authors is an employee in our case company’s quality management department since 2004 and therefore a fully-involved researcher interested in improving the company’s data quality [28]. Having the advantage of an involved researcher, who is familiar with the organization and its stakeholders, allowed to identify and study the certification process within its context. The researcher’s cross-functional task allowed access to process-owners and operational employees across the company. Data was collected from observations and documents across the company, including internal quality audits and meetings (e.g., regular meetings, quality meetings, product failure analysis meetings) as well as informal conversations throughout the company. When the certification process emerged as our unit of analysis, we additionally conducted unstructured interviews [22] with six key participants across departments (head and employee of R&D, head and employee of quality department, product manager, head of IT) who were involved into the certification process. Furthermore, quantitative data was available due to access to IT systems and log data. Data was collected throughout process optimization, which took over a year. However, the company’s focus was not on data quality at first but on the processes and their outputs, for instance, rigidity of the process and material consumption. The data triangulation by using different sources and being able to interview stakeholders over time [22] provided a rich picture of the certification process and its context, including entailed data quality issues. Since we were interested in avoiding additional overhead to the on-going process optimization, using the CCLC model was focused on the critical process and entailed IPs. Finally, the involvement of the researcher and the observation as well as access to several data sources allowed for a confirmation of data provided by participants (cf. [11]).
3.4 The certification process Due to the security relevance of the company’s products, each product passes a certification process (our unit of analysis). The goal of the examined process is the certification of a newly developed product into a salable one. The development is conducted in R&D, triggered by either a customer demand or the company itself. Only certified products can be processed for selling. The process spans several departments and employees responsible for the product in different development phases. The creation of a salable and reproducible product requires ten different IPs, such as a product data sheet, a security data sheet, and order specifications. The certification process spans almost the entire company, since the IPs are created and checked in different departments. For the illustration of the approach, the focus is on the IPs parts list, product price, and process parameters. Each product has a parts list providing necessary parts for production and according production steps. Parts list is also the basis for product price, which is calculated based on the processed components and the material consumption. Process parameters provides the configuration parameters for each production step. The parameters include input values for material quantities and handling as well as machine configuration. In the next section, we first present the historical development of the certification process for contextualization [11], before presenting the application of the CCLC model.
4703
employees. At this point, employees that need to be notified are already assigned within the ERP system. The aforementioned IPs are created during product development and test productions. If a product is considered salable and reproducible, parts list and process parameters are validated by test productions. For certification, these data are consolidated and checked. Generally, preliminary IPs are stored locally by responsible stakeholders and only the version considered final is registered in the ERP system. Therefore, we focus on IP production during the product development and certification process (cf. Figure 2). The certification process overview shows the departments and the sequence of their involvement. Activities related to IP production which were examined using the CCLC model (cf. Figure 1) are indicated by a life cycle symbol. R&D is responsible for entering final products and product parts as well as composing them to the final parts list within the ERP system. Data from preceding test productions are stored within the document management system available to all involved employees. Parts list is additionally checked by the production department. Furthermore, the production department creates process parameters. When both IPs are finalized, the controlling department is notified automatically that the product is ready for price calculation. After the product price is calculated,
4. Findings 4.1 Certification process overview
R&D
IPP process parameters
IP parts list check
Controlling
IPP parts list
Production
Before process optimization, the certification process was unstructured and undocumented; therefore, no process models existed. Due to missing transparency, the process depended on single experts’ knowledge. The lack of process documentation impeded definition of roles and responsibilities, additionally inhibiting assessments of the product development progress by other stakeholders. The certification process was considered the last step of product development and was triggered by R&D, when a supposedly finished product was assumed salable. The product development manager requested data that was necessary for certification by email or telephone from departments and employees. Data was delivered from employees’ local databases (e.g., spread sheets). Any employee involved in the development project was able to set a product ‘certified’. Due to low data quality, products were mistakenly considered salable and resulting production failures led to high costs. Therefore, the company decided to improve data quality within the certification process. The current certification is triggered by the responsible R&D employee, resulting in a request for the required IPs, send automatically to involved
Management
IPP product price
Overall IP check
IPP = information product (IP) production
Figure 2. The examined certification process
4704
Certification
management is notified that the product is ready for certification and conducts a final certification check based on previously produced IPs before the product is certified.
in our context closely related to reliability. Stakeholders did not consider other dimensions relevant since problems did not occur or dimensions were perceived as given in a routine context. The description of the CCLC model application in the next section follows the sequence of the certification process (cf. Figure 2).
4.2 Relevant quality dimensions within the process and their role in the CCLC model
4.3 IP life cycle parts list and IP life cycle process parameters
Data quality and according dimensions need to be context-adjusted. Therefore, the data quality dimensions applied in the CCLC model and their definitions merely provided a basis for identifying data quality requirements from data consumers’ view. Consequently, the understanding of the data quality dimensions within the case study’s context may differ. Table 1 lists the data quality dimensions considered important in the case study context and provides concrete examples. The dimensions applied allowed a holistic view on the identified relevant data quality requirements and issues from data consumers’ view. Some dimensions were omitted due to the interconnectivity of data quality dimensions [13]. For instance, believability is
With the start of the certification process, the final IP parts list should be provided by R&D. By accessing the latest version of the preliminary parts list for certification, the presentation of the IP is, according to the CCLC model, the first step in the certification process. Accordingly, data quality dimensions determined during IP generation, like accuracy and completeness, are perceived. By accessing the preliminary parts list, data quality dimensions related to IP presentation become relevant.
Table 1. Applied data quality dimensions (based on [14]) and case examples Category
Dimension
Case example
Intrinsic
Reliability
(Building) reliability of IPs is important since several employees need to rely on the information provided in order to ensure a smooth process flow (e.g., avoiding back-checking due to doubts on the IPs correctness).
Accuracy
IPs need to be free from error in order to avoid production failures. Additionally, accuracy is important for building reliability.
Objectivity
IPs gain objectivity by checks through different stakeholders, strengthening reliability.
Completeness
Missing information in parts lists or production parameters prevents price calculation or production and therefore the creation of a salable product.
Consistency
Diverging IPs that refer to the same product need to be consistent for unambiguous product and production data.
Interactional
Accessibility
IPs should be easily retrievable, for example, not only being accessible and available through single employees.
Contextual
Currency/Timeliness
Timeliness of each IP is important to ensure the process flow and avoid delay of product development, product certification, and price calculation.
Scope/Depth
Retrieved IPs need to be complete and limited to the latest, and therefore relevant, version from test productions.
Representational
4705
The production department is requested to provide process parameters. The optimal process parameters for the production process are determined by the material consumption tracked in the ERP system. For this purpose, the process parameters from the last successful production processes are collected. Since the IP is the basis for the subsequent production process, reliability and accuracy of the IP are considered most important. Similar to parts list, the IP has been centralized in order to improve accessibility. The new input process for process parameters into the ERP system is based on standardized and clearly defined product modules, mitigating errors by supporting consistent entering of the data from the spreadsheets.
Whereas during application, contextual data quality dimensions might be implicitly assessed, the application within the certification process explicitly controls the data quality of the IP. In order to create the final parts list, timeliness of the IP is essential, since the latest data from the last test developments are required. Additionally, regarding scope and depth, retrieved information needs to be complete, however, limited to the latest version. When all relevant data for the final parts list are checked, they are ready for aggregation. The final parts list is calculated and generated, including the summed quantities for each product part. Therefore, the IP enters information generation, where the accuracy and – in the long term – the reliability of the final parts lists will be determined. The most critical step is the correct aggregation of the product parts‘ quantities. Hence, accuracy directly depends on previous control and information extraction of the preliminary parts list. By entering the IP into the system, organization of the IP takes place and completeness and consistency are determined. Regarding completness, all product parts and their quantity need to be entered into the final parts lists. For consistency, data need to be appropriately organized, so that diverging use is possible. However, within the case company, consistency was used within another context as well, that is, for conflicting data entries. For instance, products, which appear in their own parts list are not allowed as well as product parts which are not certified yet. Arguing from our IP perspective, such issues might be controlled for during data organization, but the issues would constitute an error-prone parts list. Therefore, such errors rather occur during initial IP generation, thus decreasing accuracy. The final parts list goes through a plausibility check by the production department, where typically no new data is generated. The plausibility check was introduced to avoid product certification without all included product parts being certified as well, which had occurred in the past. In that case, product reproduction is not feasible, resulting in the product being removed from the assortment. The plausibility check’s main benefit is twofold. First, the IP’s availability is confirmed. Second, the IP’s quality is checked by other stakeholders. Since no data production takes place, most data quality dimensions are not directly influenced as they are defined by preceding data production. However, checking the IP by stakeholders, other than the data producers, increases the chance of error detection and, thus, improves reliance on and objectivity of the IP. Production of process parameters is similar to and takes place concurrently to the production of parts list.
4.4 IP life cycle pricing The controlling department calculates product price based on parts list. Therefore, IP production continues from the final production point of parts list. Since parts list is stored in the ERP system, interactional qualities can already be considered predefined when the controlling department retrieves the IP. However, accessibility of retrieval is assessed by the employee and implicitly related to the ERP system. Since with the implementation of the ERP system all employees from the controlling department were granted central access to parts list, accessibility improved. For the production of product price, accuracy is most important. However, price accuracy heavily relies on the accuracy (correct parts) and completeness (all product parts provided) of parts list. Since the controlling department is not involved in development or production of parts list, potential errors could not be identified. Therefore, the aforementioned plausibility check of parts list by the production departments was introduced. In contrast to the previously unstructured certification process, the controlling department is now requested for producing the product price after the plausibility check of parts list took place. Beside accuracy of product price, timeliness and scope improved, since only the most accurate and latest (i.e., from the last successful product version) parts list is used, avoiding rework and additional communication. Almost each error in product price has been caused by low data quality in parts list.
4.5 Data consolidation and product certification In order to further mitigate risks of IPs’ poor data quality, two managers control the IPs independently at the end of the certification process. Since all ten IPs (cf. section 3.4) are controlled, the final plausibility 4706
check focuses on the completeness of the IPs (cf. Table 2). The managers take the role of data consumers and simulate IPs’ usage, continuing their respective life cycles. IPs are certified if they include all data required for a salable product (e.g., certified parts in parts list and product price). Since the quality check by the managers focuses on completeness, the next use, and implicit detailed assessment of process parameters occurs during
production, where errors may lead to production failure. Furthermore, an IP is used within the same department it was produced in, potentially even by the same employee. Therefore, despite the data quality check outside the department, errors in the IP might cause high costs and even might be concealed due to limitations of checked data quality dimensions.
Table 2. Improvement activities and their impact on data quality dimensions IP Parts list, process parameters
Parts list
Process parameters Product price
All IPs
Improvement activities Centralization of development data storage and management
Introduction of additional plausibility check after production of final parts list Standardized input process Regulation of accessibility Introduction of additional plausibility check after production of final parts list (see above) Plausibility check by managers
Process-related description In contrast to local data management, standardization of the IPs specification is achieved (e.g., inclusion of mandatory data entries, version control), improving completeness of data as well as allowing more efficient information retrieval of latest data with the right scope. Data centralization improved IPs independency of specific employees and therefore transparency, improving accessibility. The improvements lead to elimination of former process delays. Usually, no quality dimensions are changed, but due to the fact that data is checked, the data’s objectivity is improved.
Support of consistent data entries.
Impacted data quality dimensions Organization (completeness) Presentation (accessibility) Application (timeliness, scope)
Collection (objectivity) indirect impact: Collection (reliability)
Provision of role concept and responsibilities.
Collection (accuracy) Organization (consistency) No changes addressed
Data quality of basis-IP improved and process is streamlined by timely involvement of controlling department.
Collection (accuracy) Application (timeliness)
Usually, no quality dimensions are changed but the check for completeness improves IPs’ objectivity.
Collection (objectivity) indirect impact: Organization (completeness)
and comprehensible inferences [11]. Especially, derived data quality dimensions might be subject to multiple interpretations [10]. However, aiming at a context-specific perspective for application of the CCLC model, the focus is on a transparent presentation of our approach. We are confident that we demonstrated the CCLC model’s benefits, allowing practitioners to tailor their approach to their
5. Discussion and outlook We conducted an in-depth case study to evaluate the applicability of the CCLC model for process exploration and improvement focusing on data quality. Due to the interpretive character of our research, generalization is limited to specific implications and rich insights [28] and to plausible 4707
quality checks and related data quality dimensions to close such gaps. We contribute to research by presenting a process-driven approach to data quality, based on the conceptually founded CCLC model. Although we see the CCLC model suitable for process-driven applications, our study shows room for improvements of the CCLC model. An explicit differentiation of gaining and perceiving data quality dimensions would be helpful for the application of the model. In this context, specifically the impact of data quality checks requires further attention. Although data itself might not be changed during a quality check, data quality increases due to increased reliability and objectivity. Furthermore, the visualization of the CCLC model for a process-driven application might be improved. Life cycles can be represented as sequences as well. For instance, Klesse et al. [12] apply instantiations of the data quality life cycle model [18] to represent production sequences of IPs. The production of an IP might base on a preceding IP, and each IP production is an instantiation of the data quality life cycle. Additionally, swim lanes (cf. Figure 2) allow assigning stakeholders to the respective IP production steps, allowing for identification of missing controls. Nevertheless, the reference model (cf. Figure 1) should be kept and used in order to reap the benefits of the presented approach.
needs. A critical process was chosen and according IPs, spanning different departments in a mediumsized company. However, due to the deep insights gained by applying the CCLC model, a focus on more complex processes and further IPs might lead to a considerably higher complexity of the approach. The potentially multiple interpretations of data quality dimensions may be caused by several reasons lying beyond our interpretive approach. First, the missing general agreement on a set of data quality dimensions and their exact meaning [2, 6, 8] may lead to different conceptualizations and definitions of data quality. In this context, Knight [13] adjusted the underlying classification of data quality dimensions in the CCLC model. Second, data quality dimensions are interconnected [13] and – as explained and applied in the case study – their definition and relevancy depend on their context. Finally, even with a shared understanding of data quality and the same underlying root cause, different dimensions might be considered flawed depending on the stakeholder perspective [16]. An example from the case study concerns product price, where low data quality is caused by parts lists, which was not visible to all participants. Hence, even with a shared understanding across the involved stakeholders, the overview provided in Table 2 is an interpretation of data quality in the context. We see the benefit of our explorative approach especially helpful for unstructured and informationintensive processes, particularly if knowledge about processes resides with few experts. In this context, the application of the CCLC is useful beyond the IS domain in order to share knowledge about processes (e.g., process for developing customer proposals). Explicit reference of data quality to context-specific IP production processes allows for a deep understanding of the process and facilitates communication with process stakeholders. Furthermore, due to the process-driven life cycle approach root causes for poor data quality can be identified. Understanding the IP production provided insights into important data quality dimensions and according data quality metrics. Moreover, we became aware of the importance between gaining and perceiving data quality dimensions. Large gaps might exist between the process step in IP production that defines a specific quality dimension and the process step in which data quality is perceived. The larger the gap, the more rework might be necessary to correct preceding data quality flaws. In this context, the process-driven application of the CCLC model supports the implementation of meaningful data
6. References [1] Ballou, D., R. Wang, H. Pazer, and G. Kumar.Tayi, "Modeling Information Manufacturing Systems to determine Information Product Quality", Management Science, 44(4), 1998, pp.462–484. [2] Batini, C., C. Cappiello, C. Francalanci, and A. Maurino, "Methodologies for Data Quality Assessment and Improvement", ACM Computing Surveys, 41(3), 2009, pp.1–52. [3] Buhl, H.U., M. Röglinger, S. Stöckl, and K.S. Braunwarth, "Value Orientation in Process Management", Business & Information Systems Engineering, 3(3), 2011, pp. 163–172. [4] English, L.P., Improving Data Warehouse and Business Information Quality: Methods for reducing costs and increasing profits, Wiley, New York, 1999. [5] Fehrenbacher, D.D. and M. Helfert, "Contextual Factors Influencing Perceived Importance and Trade-offs of Information Quality", Communications of the Association for Information Systems, 30(1), 2012.
4708
[6] Glowalla, P. and A. Sunyaev, "Managing Data Quality with ERP Systems - Insights from the Insurance Sector", in Proceedings of the European Conference on Information Systems (ECIS 2013), S. Brinkkemper, Editor, Utrecht, Netherlands, June 5-8. 2013.
[17] Lee, Y.W. and D.M. Strong, "Knowing-Why about Data Processes and Data Quality", Journal of Management Information Systems, 20(3), 2003–4, pp.13–39. [18] Liu, L. and L. Chi, "Evolutional Data Quality: A Theory-Specific View", in Proceedings of the International Conference on Information Quality (ICIQ 2002), C. Fisher and B.N. Davidson, Editors, Cambridge, MA, USA. 2002. MIT: Cambridge, MA, USA.
[7] Glowalla, P. and A. Sunyaev, "Process-driven data and information quality management in the financial service sector", in Proceedings of the Americas Conference on Information Systems (AMCIS 2012), L. Jessup and J. Valacich, Editors, Seattle, USA, August 9-11. 2012.
[19] Loshin, D., Enterprise knowledge management: The data quality approach, Morgan Kaufmann, San Diego, 2001.
[8] Glowalla, P. and A. Sunyaev, "Process-driven Data Quality Management – Integration of Data Quality into Existing Process Models". Business & Information Systems Engineering, forthcoming.
[20] Madnick, S.E., R.Y. Wang, Y.W. Lee, and H. Zhu, "Overview and Framework for Data and Information Quality Research", Journal of Data and Information Quality (JDIQ), 1(1), 2009, pp.1–22.
[9] Haug, A., J.S. Arlbjørn, and A. Pedersen, "A Classification Model of ERP System Data Quality", Industrial Management and Data Systems, 109(8), 2009, pp.1053–1068.
[21] Mielke, M., "IQ Principles in Software Development", in Proceedings of the International Conference on Information Quality (ICIQ 2005), F. Naumann, M. Gertz, and S.E. Madnick, Editors, Cambridge, MA, USA, November 4-6. 2005. MIT: Cambridge, MA, USA.
[10] Haug, A., F. Zachariassen, and D. van Liempd, "The costs of poor data quality", Journal of Industrial Engineering and Management, 4(2), 2011, pp.168–193.
[22] Myers, M.D., Qualitative research in business & management, SAGE, Los Angeles, 2009.
[11] Klein, H.K. and M.D. Myers, "A set of principles for conducting and evaluating interpretive field studies in information systems", MIS Quarterly, 23(1), 1999, pp.67– 94.
[23] Ofner, M.H., B. Otto, and H. Österle, "Integrating a data quality perspective into business process management", Business Process Management Journal, 18(6), 2012, pp.1036–1067.
[12] Klesse, M., C. Herrmann, D. Maier, T. Mügeli, and P. Brändli, "Customer Investigation Process at Credit Suisse: Meeting the Rising Demand of Regulators", in Proceedings of the International Conference on Information Quality (ICIQ 2004), I.N. Chengalur-Smith, L. Raschid, J. Long, and C. Seko, Editors, Cambridge, November 5-7. 2004. MIT: Cambridge, MA, USA.
[24] Redman, T.C., Data quality for the Information Age, Artech House, Boston, 1996. [25] Rosemann, M., "Potential pitfalls of process modeling: part A", Business Process Management Journal, 12(2), 2006, pp.249–254.
[13] Knight, S.-A., "The combined Conceptual Life Cycle Model of Information Quality in User Perceptions of IQ on the Web", in Proceedings of the International Conference on Information Quality (ICIQ 2011), A. Koronios and Gao Jing, Editors, Adelaide, Australia, November 18 - 20. 2011. MIT Press: Cambridge, MA, USA.
[26] Shankaranarayanan, G., R.Y. Wang, and M. Ziad, "IPMAP: Representing the Manufacture of an Information Product", in Proceedings of the Conference on Information Quality (ICIQ 2000), B.D. Klein and D.F. Rossin, Editors, Cambridge. 2000. MIT: Cambridge, MA, USA. [27] Walsham, G., "Interpretive case studies in IS research: nature and method", European Journal of Information Systems, 4(2), 1995, pp.74–81.
[14] Knight, S.-A., "The combined conceptual life-cycle model of information quality: part 1, an investigative framework", International Journal of Information Quality, 2(3), 2011, pp.205–230.
[28] Walsham, G., "Doing interpretive research", European Journal of Information Systems, 15(3), 2006, pp.320–330.
[15] Lee, Y., S. Chase, J. Fisher, A. Leinung, D. McDowell, M. Paradiso, J. Simons, and C. Yarsawich, "CEIP Maps: Context-embedded Information Product Maps", in Proceedings of the Americas Conference on Information Systems (AMCIS 2007), J.A. Hoxmeier and S. Hayne, Editors, Keystone, Colorado, USA, August 9-12. 2007. Association for Information Systems: Cambridge, MA, USA.
[29] Wang, R.W. and D.M. Strong, "Beyond Accuracy: What Data Quality Means to Data Consumers", Journal of Management Information Systems, 12(4), 1996, pp.5–33. [30] Yin, R.K., Case study research: Design and methods, 4th edn., SAGE, Los Angeles, California, 2009.
[16] Lee, Y.W., Journey to Data Quality, MIT Press, Cambridge, Massachusetts, 2006.
4709