tributed, right: constructed polygons with overlapping attribution point layer. ... géologiques originales et transfert des données pour l'Atlas géologique de la ...
3 rd Swiss Geoscience Meeting, Zürich, 2005
Process, tools and methods used for Swiss geological map vectorization
Schreiber, L., Dessimoz, M., Roth, A., *Sartori, M., Jaboyedoff, M., **Jemelin, L., **Österling, N., **Kuehni, A. Institute of Geomatics and Risk Analysis, Faculty of Geosciences and environment (IGAR), University of Lausanne, Switzerland *Research center on alpine environment (CREALP), Sion, Switzerland **Swiss Federal Office for Water and Geology (FOWG), Bern, Switzerland
For analysis purpose, the actual Swiss geological scientist has access to raster data, such as geological maps, but only few vector maps are available (Jemelin & Beer 1999). Based on this report, creation of Vaud vector maps started within a joining project involving FOWG, IGAR and Canton Vaud. Main goal is to match as well as possible the raster map; therefore, by lack of accuracy, a fully automatic vectorization process was not taken into account. A manual drawing approach was mainly used, although in some case, semi-automatic vector extraction could be used due to the availability of colorspecific layer. It was essential to be able to quantify the accuracy of the data created. For this purpose hardware (tactile screen, pen tablet) as well as softwares tool were used (ET GeoTools extension for ArcGis www.ian-ko.com ). The method employed for creating vector geological map is based on CREALP's research on GIS (Sartori & Ornstein 1997, Metraux & al. 2004, www.esrifrance.fr/sig2005/communications2005/crea lp/crealp.htm) and software (TOOLMAP). It involves the drawing of all geological lines (fault, limits between lithology, borrow pit...) in a single line layer. Each time an intersection is encountered, a new line is created. Then each line receives two values using shortcuts. First value is a numerical code indicating which kind of line is drawn, second value indicates if line will be used for polygons construction. Once all the lines are drawn and checked through a rigorous procedure, script and ArcGis © toolbox were used to extract and build polygons automatically. Thereafter polygons get values from an overlapping point layer. The uses of this method allow iterative correction,
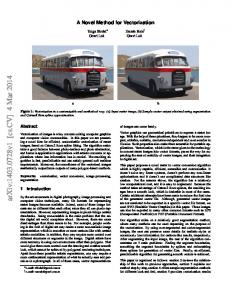
modification of lines, then reconstruction of polygons without loosing polygons attributions. (Figure 1)
Figure 1. The picture shows three-step geological map construction. Left: original raster map, middle: lines drawn and attributed, right: constructed polygons with overlapping attribution point layer.
Main problem was to obtain a constant quality product. Firstly, a reference scale was selected and maintained to allow a high accuracy drawing, secondly a four-steps checking process was set-up. (1) Line snapping control, is a visual and automatic verification. ETGeowizard shows graphically all nodes not snapped, while ArcGis will not create polygons if all lines are not correctly snapped together. (2) Line attribution control is a visual control used to detect and correct errors in lines values. (3) Polygons control is a check to ensure if all polygons were created and get the right attribution. (4) During the final control step, the entire map is scanned searching for inconsistency and errors.
59
Schreiber, L. et al.: Process, tools and methods used for Swiss geological map vectorization
REFERENCES To achieve a standard map, involving drawing lines, polygon creation and complete checking about two weeks for a 3 people team are needed. 6 days are used for drawing vectors, 1 for polygons attribution and at least 3 days for checking and correction. It’s to note that product created is according to the raster geological map, and doesn’t pretend to be an exhaustive geological GIS. Therefore, polygons are all contained in the same layer as in a paper map. But, on the other hand, vector data allows easier updates, easier display and last but not least spatial and geological analyses are made possible by this kind of data. For example, Figure 2 shows spatial analyses on metadata linked to the “Le-Sentier” vectorized map.
Jemelin, L. & Beer, Ch. (1999) : Geologischer Atlas der Schweiz 1 :25.000. GIS-Applikation und Struktur des Datenbank. – Bull. Angew. Geol.4/2. Sartori, M. & Ornstein P. (1997): Application du SIG à la cartographie géologique: exemple de la feuille 1306 Sion au 1:25’000. – Rapport CREALP , 18p. Metraux, C., Sartori, M. & Ornstein, P. (2004): SIG – Sion et carte géologique. Réalisation d’un SIG à partir des minutes géologiques originales et transfert des données pour l’Atlas géologique de la Suisse. Rapport CREALP-04.4 73p.
Figure 2. Tectonic outline, created from vectorized map of “LeSentier”, bold lines showing faults.
60