Mar 22, 2013 - such data has rendered spatial query processing as one of the most active ... scale data processing and many modern applications use.
Processing Multi-Way Spatial Joins on Map-Reduce Himanshu Gupta, Bhupesh Chawda, Sumit Negi, Tanveer A. Faruquie, L V Subramaniam, Mukesh Mohania IBM India Research Laboratory, New Delhi, India
{higupta8, bhchawda, sumitneg, ftanveer, lvsubram, mkmukesh}@in.ibm.com
ABSTRACT
joins on map-reduce platform. Map-reduce [8] is a framework for parallel processing proposed by Google for large scale data processing and many modern applications use map-reduce as their data-processing platform. This has inspired many studies to investigate efficient approaches for handling join queries on map-reduce platform [16, 3]. Few studies have also looked at how to compute 2-way spatial joins on map-reduce platform [21, 23, 22]. However the processing of multi-way spatial joins on map-reduce has not received much attention. To the best of our knowledge, this is the first study to do so. Implementation of a map-reduce program entails writing of map and reduce functions. A map function reads the input and converts the input to an intermediate form consisting of a set of key-value pairs. These key-value pairs are collected by the map-reduce engine and are routed to reducers in a manner that all pairs with identical key are routed to a single reducer. Efficiency of a map-reduce program often hinges upon the number of intermediate key-value pairs being generated. Larger the number of intermediate key-value pairs, higher the communication cost. Hence a map-reduce algorithm should be designed in a manner such that it produces minimal number of intermediate key-value pairs. The approaches proposed in this paper are developed with an objective of minimizing communication cost. Contributions: In this paper we design novel algorithms for handling multi-way spatial join queries on map-reduce platform. Specifically we look at two common spatial predicates - overlap and range on datasets consisting of rectangular objects. The overlap predicate looks for the pairs of rectangles which intersect with each other while the range predicate looks for pairs of rectangles within a certain distance of each other. We develop a Controlled-Replicate framework coupled with project-split-replicate notation using which we handle multi-way spatial join queries. This framework outlines how rectangles are communicated to different reducers. We first present novel approaches to handle multi-way overlap and range join queries and discuss the challenges arising therein. Finally we present how we can handle general spatial multi-way join queries which involve both overlap and range predicates. By carrying out an experimental study over synthetic as well as real-life data we show that the approaches presented in the paper comfortably beat the naive approaches.
In this paper we investigate the problem of processing multiway spatial joins on map-reduce platform. We look at two common spatial predicates - overlap and range. We address these two classes of join queries, discuss the challenges and outline novel approaches for executing these queries on a map-reduce framework. We then discuss how we can process join queries involving both overlap and range predicates. Specifically we present a Controlled-Replicate framework using which we design the approaches presented in this paper. The Controlled-Replicate framework is carefully engineered to minimize the communication among cluster nodes. Through experimental evaluations we discuss the complexity of the problem under investigation, details of ControlledReplicate framework and demonstrate that the proposed approaches comfortably outperform naive approaches.
1.
INTRODUCTION
Spatial data consists of points, lines, rectangles, polygons and more complex objects composed from simple ones. Spatial data naturally arises in multiple domains e.g., satellite images, digital video, multi-media documents, medical information systems, robotics etc. Increasing availability of such data has rendered spatial query processing as one of the most active research areas in the database community. One of the most important spatial queries is spatial join which retrieves from datasets all object pairs that satisfy a certain spatial predicate [14]. For example the query ‘find all cities adjacent to a forest and overlap with a river’ involves a spatial join between city, forest and river datasets. The query ‘Find all objects within 10 m of each other that have identical colors but different brightness’ involves a spatial self-join between object datasets. Many studies in the literature have looked at how to optimize spatial joins in a database engine. These include both optimizing 2-way spatial joins [5, 7, 6, 11, 12, 18, 19, 10] as well as optimizing multi-way joins [17, 15]. In this paper we investigate the problem of optimizing multi-way spatial
Permission to make digital or hard copies of all or part of this work for personal or classroom use is granted without fee provided that copies are not made or distributed for profit or commercial advantage and that copies bear this notice and the full citation on the first page. To copy otherwise, to republish, to post on servers or to redistribute to lists, requires prior specific permission and/or a fee. EDBT/ICDT ’13 March 18 - 22 2013, Genoa, Italy Copyright 2013 ACM 978-1-4503-1597-5/13/03 ...$10.00.
1.1 Object Model - Why only Rectangles? Representing spatial objects with their minimum bounding rectangle (MBR) is a standard approach in spatial join
113
Q = {(P1 , R1,1 , R1,2 ) ∧ (P2 , R2,1 , R2,2 ) ∧ . . .
∧(Pn , Rn,1 , Rn,2 )}
(1)
Here Pi ’s are spatial predicates while Ri,1 and Ri,2 represent the two relations being joined on spatial predicate Pi .The query Q is an overlap or range query if all the predicates Pi ’s are either overlap or range. Overlap and range predicates are also represented using Ov and Ra(d) respectively. We visualize the query as a join graph G(V, E) with each relation as a vertex in the graph and for every triple (Pi , Ri,1 , Ri,2 ) in query Q there is an edge between the vertices for relations Ri,1 and Ri,2 with the edge weight being 0 if predicate Pi is an overlap predicate and d if Pi is a range predicate with distance parameter d. Organization: Section 2 presents the basics of mapreduce programming model. Section 3 discusses the related work. Section 4 develops the project-split-replicate notation which is used in rest of the paper. Section 5 discusses 2way spatial joins in terms of project-split-replicate notation. Section 6 presents two naive approaches 2-way Cascade and All-Replicate for handling multi-way spatial joins and discusses why these approaches are naive. Section 7 presents Controlled-Replicate framework and discusses how we can handle multi-way overlap join queries. Section 8 proposes Controlled-Replicate based approaches for handling multiway spatial range join queries. Section 9 discusses how we handle general spatial join queries which involve both overlap and range predicates. Section 7, 8 and 9 also present the experimental evaluation on the approaches presented in the respective sections. Section 10 concludes the paper with a mention of future work.
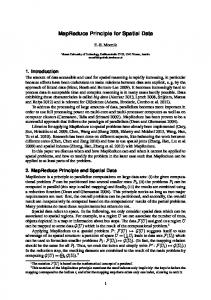
Figure 1: Representation of a MBR literature [15]. A spatial object may be circular or may have multiple vertices, may be concave or convex etc and hence the representation of a spatial object can be large and complex. Finding out whether two spatial objects satisfy a certain predicate or not, can be computationally very expensive. Spatial joins are hence carried out in two steps: filter and refinement. Each spatial object is approximated using its minimum bounding rectangle (MBR). In the filter step, instead of the two spatial objects, their MBRs are checked whether they satisfy a spatial predicate or not. Checking whether two MBRs satisfy a certain predicate is computationally inexpensive as the representation of an MBR is simple. If the MBRs do not satisfy the predicate, then the two objects will not satisfy the predicate; however the reverse is not true. The filter step hence produces a super-set of the actual result. For each pair of MBRs output by the filter step, the refinement step then checks whether the two objects actually satisfy the predicate or not. Computationally expensive geometric procedures hence are employed in the refinement step. As a result the two-step process is computationally more efficient as compared to checking every pair of objects whether they satisfy a spatial predicate or not. The objective of the approaches developed in this paper is to hence efficiently carry out the filter step on MBRs. A refine operation is carried out in the end to check whether the objects actually satisfy the spatial multi-way join or not. A relation is hence visualized as consisting of a set of rectangles and the spatial multi-way join query is evaluated over the MBRs. Figure 1 shows a pentagon object and its MBR. A rectangle r is represented as (x, y, l, b) where x and y represent the coordinates of top-left vertex of the rectangle; while l and b represent the length and breadth of the rectangle. We also refer to the top-left vertex as the start-point of the rectangle. The x-range and y-range are [x0 , xn ] and [y0 , yn ] respectively i.e. all MBRs lie within the 2D space defined by these two ranges.
2. BACKGROUND: MAP-REDUCE A map-reduce program consists of two user-defined functions map and reduce. The signatures of these two functions are as follows: map: (k1 ,v1 )→[k2 ,v2 ] reduce:(k2 ,[v2 ])→[k3 ,v3 ] Every input record is parsed as a key-value pair (k1 ,v1 ). Map function applies a user defined logic on each input keyvalue pair (k1 ,v1 ) and transforms it into a set of intermediate key-value pairs ([k2 ,v2 ]). These map outputs are collected and the keys of type k2 are assigned to reducer nodes. Then the reduce function applies a user-defined logic to all intermediate values [v2 ] associated with the same k2 and produces a list of final output key-value pairs [k3 ,v3 ]. The map-reduce framework parallelizes the map and reduce operations by dividing the responsibilities of these operations among many nodes. Input data is distributed across several physical locations on a distributed file system (DFS). On initialization of a map-reduce job, the input data is partitioned among multiple mapper nodes, which are tasks responsible for applying the map function. Mappers fetch the input data from DFS and write the set of intermediate keyvalue pairs to a set of files. Reducers then access these files and compute the final output. Once a reducer has received its files from all mappers, it merges and sorts the files by keys and reduces each key in turn, outputting the resulting tuples to files on the distributed file system.
1.2 Query Model In this paper, we consider two spatial predicates - overlap and range defined as follows: Overlap(r1 , r2 ): true if rectangles r1 overlaps with rectangle r2 Range(r1 , r2 , d): true if the distance between any two points of rectangles r1 and r2 is less than d Overlap(R1 , R2 ) finds the pairs of rectangles (r1 , r2 ), r1 ∈ R1 , r2 ∈ R2 and r1 overlaps with r2 . Range(R1 , R2 , d) finds the pairs of rectangles (r1 , r2 ), r1 ∈ R1 , r2 ∈ R2 s.t. at least one point of rectangle r1 is within distance d of at least one point in r2 . Two objects can overlap only if their MBRs overlap and two objects can be within distance d only of their MBRs are within distance d. We denote a multi-way spatial query as a conjunction of triples Ti = (Pi , Ri,1 ,Ri,2 ) as follows:
3. RELATED WORK
114
Spatial join processing on RDBMS is a well developed research area. A number of studies have investigated optimization of both 2-way and multi-way spatial joins in an RDBMS [5, 7, 6, 11, 12, 17, 15]. In this paper we study the related problem of optimizing multi-way spatial joins on map-reduce platform. Few studies have recently looked at optimizing 2-way spatial join processing on map-reduce [23, 21, 22]. In addition these studies also look at other spatial queries like kNN finding k objects in a dataset that are nearest to a query point q, ANN - for an object in dataset 1 find its nearest neighbor in dataset 2, containment - find objects which contain a point etc. However none of these studies consider multi-way spatial join processing (or any other query processing). Ours is the first study to analyze the problem in detail. The basic approach these studies employ to handle 2-way spatial queries is to visualize the 2D space as a grid of reducers and let each reducer handle a different part of the space. We also employ a similar approach to handle multi-way spatial joins on map-reduce. Optimization techniques for the evaluation of join queries on map-reduce platform has seen a flurry of activity last few years. Blanas et al. [4] look at various algorithms for optimizing 2-way equi-joins on map-reduce. Afrati et al. [3] look at multiway equi-joins on Map-Reduce platform. Okcan et al. [16] look at processing 2-way inequality joins on mapreduce platform. One common objective in all these studies is to minimize the communication cost among the cluster nodes as well as ensure that the reducers are load-balanced. We also design our solutions for handling multi-way spatial joins with a similar objective by exploiting various properties which arise due to relative spatial location of objects. Few studies recently have looked at optimizing join queries for specialized scenarios. Lu et al. [13] look at optimizing K-NN joins on map-reduce platform. Vernica et al. [20] look at optimizing set-similarity joins on map-reduce. In this paper we look at multi-way join processing on spatial datasets which has not been studied previously.
4.
dist(c, r) = min dist(p1 , p2 ), ∀(p1 , p2 )p1 ∈ c, p2 ∈ r p1 ,p2
(2)
Cell of a Rectangle: Given a rectangle u, its cell cu is defined as the partition-cell in which the start-point of rectangle u lies. In Figure 2(a), the cell of rectangle r1 (i.e., cr1 ) is 6 as the start point of rectangle r1 lies in cell 6. Similarly the cell of rectangle r2 , (i.e., cr2 ) is 3. Cells in the 4th Quadrant wrt. a Rectangle: In this paper we will be heavily using this notion. Consider a rectangle u and its cell cu . If we divide the whole 2D space by taking the start-point of cell cu as origin, than the cells lying in the fourth quadrant are said to be the cells in the 4th quadrant wrt. rectangle u and denoted as C4 (u). Mathematically it is defined as follows: C4 (u) = {ci } s.t. ci .x ≥ cu .x & ci .y ≤ cu .y In Figure 2(a), cells 6-8, 10-12 and 14-16 are in the 4th quadrant wrt. rectangle r1 . Cell of rectangle r1 i.e., cr1 is 6 and the four quadrants (marked by Q1 , Q2 , Q3 and Q4 ) formed by division of 2D space by taking start-point of cell 6 as origin are also shown in Figure 2(a). We next define the following three operations project, split and replicate. Collectively we call these three operations as transform operations. These operations transform a rectangle wrt. a partitioning in three different manners. Intermediate key-value pairs in the approaches we develop in this paper are generated using these transform operations. The output consists of key-value pairs where key is the partition-cell id and the value is the input rectangle. Project: Project operation returns the cell of a rectangle i.e., it determines the partition-cell in which the start-point of the rectangle lies. The projection of a rectangle u on a partitioning C results in the generation of a single key-value pair (cu , u) where cu is the partition-cell within which the start-point of the rectangle u lies. Project(u, C)→ (cu ,u) Split: Split operation determines all the partition-cells which have at-least one point in common with the rectangle. Consequently for each such partition-cell, a key-value pair is generated and hence a set of key-value pairs is returned for each rectangle. Split(u, C)→ {(ci ,u)}, ∀(i) s.t. u ∩ ci 6= φ
PROJECT-SPLIT-REPLICATE
Partitioning: Let the complete x-range and y-range be [x0 ,xn ) and [y0 ,yn ) i.e., all rectangles lie within this space. A rectilinear partitioning divides the space into a set of disjoint rectangles which taken together cover the whole space. We equivalently call these rectangles as partitioncells. Partition-cells in each row have the same breadth and partition-cells in each column have the same length. Figure 2(a) shows an example of partitioning. Here the whole space is partitioned into 16 cells. We represent a partitioning as C=(c1 ,c2 ,. . . , cq ) where the cj ’s represent the individual partition-cells and q is the total number of partition-cells in C. We also denote each partition-cell by their indices (i, j). We will be using these two notations interchangeably in this paper. 16 cells in Figure 2(a) are denoted by their ids i.e. (1, 2, ..., 16) or their indices ( (1,1), (1,2), ... , (4,4) ). Distance between a rectangle and partition-cell: The distance between a partition-cell c and a rectangle r is defined as the minimum distance between any point p1 in partition-cell c and any point p2 within the rectangle. Mathematically it can be written down as follows:
Replicate: The replicate operation returns all partition cells which satisfy a certain condition. Replicate(u, C, f )→ {(ci ,u)}, ∀(i) f (ci , u)=true In this paper we will be mainly considering two functions f1 and f2 as described next. The function f1 replicates the rectangle u to all partition-cells which lie in the fourth quadrant wrt. rectangle u. The function f2 takes an additional parameter d and replicates the rectangle u to all cells which (1) lie in the fourth quadrant wrt. rectangle u and (2) are within distance d of the rectangle u. Mathematically, these two functions are written down as follows. f1 (c, u) = c.x ≥ cu .x & c.y ≤ cu .y f2 (c, u, d) = f1 (c, u) & dist(c, u) ≤ d
115
(a)
grid √containing k partition-cells (i.e., we divide x and y axis in k partitions each). We either project, split or replicate the relations (depending on the exact predicate involved). Intermediate key-value pairs generated as a result of these operations are routed to the reducers. An intermediate keyvalue pair (ci , u) is routed to the reducer ci . All pairs with partition-cell ci as key are hence processed by one reducer only i.e., ci . After all the intermediate key-value pairs have been communicated to the relevant reducers, each reducer has got all the information to generate a part of the output. If two rectangles from two relations agree on the predicate then these two rectangles must be present at, at least one of the reducers. Each reducer computes a part of the spatial join output. Combining the output of all the reducers produces the complete join output. Notation: As one reducer handles the key-value pairs containing only one partition-cell, we also denote the reducers with the same ids i.e., ci . We will be using the terms ‘reducer’ and ‘cell’ loosely and interchangeably. We will not be using the exact phrases ‘reducer corresponding to the cell’ and ‘cell corresponding to the reducer’. It will be clear from the context what is implied.
(b)
(c) Figure 2: Project, Split and Replicate Example Figure 2(c) presents the output of project, split and replicate operations on rectangle r1 in Figure 2(a). The project operation returns cell 6 as cell 6 contains the start-point of rectangle r1 . The split operation returns the cells 6 and 7 as only these two cells intersect with rectangle r1 . Replicate operation with function f1 returns cells in 4th quadrant wrt. rectangle r1 i.e., cells 6-8, 10-12, 14-16. Replicate operation with function f2 returns cells 6,7,10 and 11 as only these cells are within distance d of rectangle r1 . The shaded cells represent the output of replicate operations with function f1 in Figure 2(a). Projecting, Splitting and Replicating a relation: Equivalently we define projecting (Project(R, C)) splitting (Split(R, C)) and replicating (Replicate(R, C)) a relation R wrt. a partitioning C as follows:
5.2 Overlap Predicate We next look at the Overlap predicate. Let R1 and R2 be the two relations being joined. We can process the overlap join by splitting the two relations. Let r1 ∈ R1 and r2 ∈ R2 be two rectangles which satisfy the Overlap predicate. Hence there must be at least one reducer which will receive both r1 and r2 . Such reducers can output that the rectangles r1 and r2 overlap. As there can be more than one reducers which receive both r1 and r2 , we need to remove the duplicates from the output. The final output is hence scanned once again and the duplicates are removed. Alternatively we can adopt a duplicate avoidance mechanism so that we need not remove duplicates from the final output. A duplicate avoidance mechanism ensures that one output tuple is generated only at one of the reducer. We adopt the following duplicate avoidance mechanism [9]. We first compute the area overlapping between the two rectangles r1 and r2 . This area will also be a rectangle and let’s denote this by ro12 . Which-ever cell contains the startpoint of the rectangle ro12 , computes the output tuple (r1 , r2 ). As only one cell can contain the start-point of the rectangle ro12 , there will be no duplicate. Consider the rectangles r3 (∈ R1 ) and r4 (∈ R2 ) in Figure 2(a). x and y axis are divided in 4 partitions and hence there are 16 reducers in play. The overlapped area between rectangles r3 and r4 is shown black. Reducers 14 and 15 will receive both the rectangles r3 and r4 . However the start-point of overlapping area lies in cell 14. The output tuple (r3 ,r4 ) is hence computed by reducer 14. Note that an overlap join can not be computed by projecting one relation and splitting the other. Consider that the relation R1 is projected and relation R2 is split. For a counter-example, consider the rectangles r1 (∈ R1 ) and r2 (∈ R2 ) in Figure 2(a). As rectangle r1 is projected, only reducer 6 receives rectangle r1 . As rectangle r2 is split, reducers 3 and 7 receive the rectangle r2 . Hence, no reducer receives both the rectangles r1 and r2 ; and hence this output tuple will not be computed.
Project(R, C): ∀(j) Project(uj , C) s.t. uj ∈ R Split(R, C): ∀(j) Split(uj , C) s.t. uj ∈ R Replicate(R, C): ∀(j) Replicate(uj , C) s.t. uj ∈ R Project(R, C) represents the output of project operation on each rectangle in R. The size of this operation hence equals the size of relation R. Split(R, C) represents the output of split operation on each rectangle in R and similarly Replicate(R, C) represents the output of replicate operation on each rectangle in R. Notation: To make the notation simpler, we omit the partitioning parameter C while talking about any of project, split or replication operation. In the rest of the paper we may avoid mentioning the replication function f1 and f2 explicitly. From the context it will be clear which function is implied. Table 1 summarizes the symbols used in this paper.
5.
2-WAY SPATIAL JOINS
Binary joins have been studied in the literature before [23, 22]. In this section we first outline the same solutions using the project-split-replicate notation. Secondly understanding how 2-way spatial joins can be computed on map-reduce platform is essential to understand how multi-way joins need to be carried out.
5.1 2-way Join Algorithm Blueprint Let the number of reducers be k and let us denote these reducers by ids 1,2,. . .,k. We first divide the 2D space into a
116
6.1 Naive Approaches
Table 1: Terminology and Notation R1 , R2 , R3 u, v, w, x r1 , r2 , r3 p1 , p2 Q R U P c C cu , cr
• 2-way Cascade: This approach processes a multiway join query as a series of 2-way joins. Each 2way join is handled as discussed in Section 5. For example consider the query Q1 = R1 Overlaps R2 and R2 Overlaps R3 and R3 Overlaps R4 . This approach first joins R1 and R2 for predicate overlap, the result with R3 and the subsequent result with R4 1 . • All-Replicate: All-Replicate handles a join query by replicating all relations with replication function f1 as defined in Section 4. A rectangle u is communicated to all cells which are in the fourth quadrant wrt. cell cu . Each reducer then computes a part of the join output on the rectangles it receives.
Relations Rectangles A point A Spatial Join Query A set of relations, Set of Relations in query Q A set of rectangles with each rectangle belonging to a different relation A spatial predicate partition-cell A partitioning, A set of partition-cells Cell in which rectangle u (r) starts
5.3 Range Predicate
It should be noted that the decision of replicating the rectangles to cells in fourth quadrant is arbitrary. One can equivalently replicate the rectangles to first, second or third quadrant.
Let R1 and R2 be the two relations being joined and let d be the distance parameter of the range predicate. A range predicate computes the pairs of rectangles which are within distance d of each-other. We first define the concept of enlarging a rectangle by d units. Enlarging a rectangle by d units: Let (x1 , y1 ) be the top-left vertex of a rectangle and let (x2 , y2 ) be the bottomright vertex . The top-left vertex of the enlarged rectangle is given by (x1 − d, y1 + d) and the bottom-right vertex is given by (x2 + d, y2 − d). Consider the Figure 2(b). Rectangle r1 is shown and its enlarged rectangle is also shown. Let us denote the rectangle obtained by enlarging rectangle r by d units as r e (d). We can process the Range predicate by splitting the relation R2 and communicating a rectangle r1 in R1 to reducers corresponding to all partition-cells which overlap with the rectangle obtained by enlarging r1 by d units (i.e, r1e (d)). For example rectangle r1 in Figure 2(b) is communicated to reducers 2-4, 6-8 and 10-12 as these cells overlap with the enlarged rectangle of r1 . Rectangle r2 is communicated to reducers 7 and 8 as these two cells overlap with rectangle r2 . There can be more than one reducers which will receive both the rectangles r1 and r2 . We hence need to have a duplicate avoidance mechanism. We once again compute the rectangular area overlapping between r1e (d) and r2 . The cell which contains the start-point of this rectangular area computes the output tuple (r1 , r2 ) if r1 and r2 are within distance d. In Figure 2(b), reducers 7 and 8 receive both rectangle r1 and r2 and reducer 7 computes the output tuple (r1 , r2 ) as the start-point of the overlapping area between r1e and r2 lies in cell 7. Note that we still need to check whether rectangle r1 and r2 are within distance d as the overlap between enlarged rectangle of r1 (i.e., r1e ) and r2 does not guarantee that r1 and r2 are within distance d. For a counter-example, consider ′ ′ rectangles r1 and r2 in Figure 2(b). Rectangle r2 overlaps ′ e with r1 but r1 and r2 are more than distance d apart. If r1 and r2 are within distance d then r2 will overlap with enlarged rectangle r1e (d) but the reverse is not true. Hence it suffices to split r2 and replicate r1 to reducers which overlap with r1e (d).
6.
Consider an output tuple U. Naturally there may be multiple cells which will receive all the rectangles in U and all such cells can compute the output tuple U. For example, consider the query Q1 as mentioned above and the rectangles as shown in Figure 3. Assume that there are 32 reducers and hence the 2D space is divided in a 8x4 grid. Consider the rectangle-set U=(u1 ,v1 ,w1 ,x1 ). Rectangles in U satisfy the overlap conditions in Q1 . As a result of replication with function f1 , reducers 19-24 and 27-32 will receive all rectangles in U. No other reducer receives all four rectangles in U e.g., reducers 11-16 receive rectangles v1 , w1 and x1 but do not receive rectangle u1 . Potentially hence any reducer among 19-24, 27-32 can compute the output tuple U. We need to hence employ a duplicate avoidance strategy so that an output tuple is computed exactly at one reducer. We next outline the duplicate avoidance strategy used.
6.2 Duplicate Avoidance Strategy Consider an output tuple U, let ur , ur ∈ U be the rightmost rectangle in U i.e., the rectangle with the largest xcoordinate of the starting-point and let ul , ul ∈ U be the lowermost rectangle in U i.e., the rectangle with the smallest y-coordinate of the starting point. Duplicates are avoided by letting only the partition-cell which contains the point (ur .x, ul .y) compute the output tuple U. Consider again the query Q1 , Figure 3 and the rectangleset U=(u1 ,v1 ,w1 ,x1 ). x1 is the rightmost rectangle in U and u1 is the lowermost rectangle. Cell 19 contains the point (x1 .x, u1 .y) (as shown in Figure 3) and hence reducer 19 computes the output tuple U. Reducers 20-24, 27-32 will determine that their respective cell do not contain the point (x1 .x, u1 .y) and hence will not output the tuple U.
6.3 Why Splitting all Relations does not work? Note that unlike a 2-way overlap join, a multi-way overlap join query can not be computed by splitting all rectangles. For example, again consider query Q1 , Figure 3 and the rectangle-set U=(u1 ,v1 ,w1 ,x1 ). Splitting each rectangle will imply that rectangle u1 is received by reducer 18, rectangle v1 is received by reducers 10 and 18, rectangle w1 is received
MULTIWAY JOINS - NAIVE METHODS
In this section we present two naive approaches to solve multi-way spatial join queries and discuss why these approaches are naive.
1 Assuming that this is the optimal order in which to evaluate 2-way joins
117
by reducers 2,3,10 and 11; and rectangle x1 is received by reducers 3 and 11. Hence no one reducer receives all the rectangles and the output tuple U can not be computed. Splitting both relations in a 2-way overlap join works as it is certain that two overlapping rectangles will be received at at-least one reducer. In a multi-way overlap join, rectangles forming an output tuple may be far apart and it is not certain that all rectangles in an output tuple will be received by at least one reducer. To circumvent this problem, All-Replicate replicates all rectangles to 4th quadrant reducers which ensures that for each output tuple, there will be at least one reducer which will receive all rectangles for the output tuple. A suitable strategy can be adopted to avoid any duplicates (Section 6.2).
Figure 3: Example illustrating the scheme for deciding which reducer to compute the join
6.4 Why 2-way Cascade and All-Replicate are Naive?
The basic idea of Controlled-Replicate framework is to identify which rectangles need not be replicated. The framework defines a number of conditions which each rectangle must satisfy. Any rectangle which does not satisfy these conditions is not replicated. Controlled-Replicate runs as a round of two map-reduce jobs. First set of map-reduce operations figure out which rectangles need to be replicated. Map operations in the first round split all the relations and hence a reducer ci receives all rectangles which overlap with cell ci . Reduce operations in the first round then determine which rectangles need to be replicated. First round of reduce operations hence check which rectangles satisfy the conditions of ControlledReplicate framework. A rectangle which is chosen for replication is marked with a flag. All other rectangles are output unmarked. Second round of map-reduce operations carry out the replication and compute the multi-way join. Second round of map operations process the output of first round of reducers. The rectangles chosen for replication (i.e., which are marked) are replicated with function f1 (see Section 4). Rest of the (unmarked) rectangles are projected. The second round of reducers compute the join. The duplicates are avoided using the strategy outlined in Section 6.2. As only rectangles marked in the first round are replicated, Controlled-Replicate replicates much lesser number of rectangles as compared to All-Replicate. Controlled-Replicate hence incurs a much smaller communication cost as compared to All-Replicate. As Controlled-Replicate is carried out as a sequence of two map-reduce cycles, it incurs a much smaller reading and writing cost as compared to 2-way Cascade which incurs a huge reading/writing cost due to generation of large intermediate results. We next outline the notion of consistency of a set of rectangles which is used in the conditions of Controlled-Replicate framework. Notation: For simplicity purposes we refer to ControlledReplicate and All-Replicate as C-Rep and All-Rep respectively.
Both these approaches are very inefficient. 2-way Cascade handles a multi-way join as a cascade of 2-way joins. This hence produces a series of big intermediate join results and these big intermediate results are joined with subsequent relations. 2-way Cascade hence executes a number of map and reduce tasks. The first problem with this approach is that it involves a huge reading and writing cost. For each successive 2-way join, a larger and larger size of data will be read (and written to the disk). Secondly a larger amount of data read naturally results in a larger communication cost among the cluster nodes. All-Replicate carries out the multi-way join in one step and hence unlike 2-way Cascade does not involve huge reading and writing cost. However All-Replicate involves a huge communication cost as it replicates each rectangle and as a result, each rectangle u is communicated to all the reducers which are in the 4th quadrant wrt. rectangle u. Replicating each rectangle is a naive way of ensuring that there is atleast one reducer which will receive all the rectangles in an output tuple and can hence compute the output tuple. However this naive way turns out to contain a lot of redundancy. Rectangles are replicated even if they do not form part of any output tuple resulting in unnecessary communication and processing e.g., a rectangle may not overlap with any other rectangle but is still replicated to multiple cells. For example, in Figure 3, rectangle u4 will be communicated to all 32 reducers even though it does not form a part of any output tuple. Secondly for a majority of the output tuples, the overlapping rectangles are likely to be near-by and there is no provision of identifying that such output tuples can be computed locally e.g., rectangles (u3 ,v3 ,w3 ,x3 ) in Figure 3. We hence need an approach which carries out the multiway join simultaneously (unlike a cascade of 2-way joins) but selectively replicates rectangles by taking into account their relative spatial locations. We next present ControlledReplicate, a framework which achieves precisely this.
7.
CONTROLLED-REPLICATE METHOD AND MULTI-WAY OVERLAP JOINS
7.2 Rectangle-Set In this paper we will be heavily using the notion of a “rectangle set” or a “set of rectangles”. We assume the following notations on such a set U used in this paper:
In this section we present Controlled-Replicate framework and illustrate how we use it to compute multi-way overlap joins. We then present an experimental evaluation to show the efficacy of the Controlled-Replicate framework.
1. All rectangles in a set U belong to different relations.
2. We assume an order among the set U so that we can access ith element of the set by the notion U[i].
7.1 Motivation and Blueprint
118
3. We say that the set Rs is the relation-set of rectangleset U if the ith rectangle in U belongs to ith relation in Rs i.e., U[i] ∈ Rs [i] for all i. All the relations in Rs are distinct as no two rectangles in U come from the same relation (Point 1).
7.3 Consistency of a set of rectangles Figure 4:
Given a query Q, we say that a set of rectangles U is consistent with its relation-set Rs if the following holds: For any two indices j and k, if there is a condition (Pi , Rs [j], Rs [k]) in query Q then the rectangles U[j] and U[k] satisfy the predicate Pi . The notion of consistency of a set of rectangles implies that the rectangles from set U satisfy all the conditions in query Q which are formed by the relations in relation-set Rs . Consider the rectangles shown in Figure 3 and the query Q1 : R1 Overlaps R2 and R2 Overlaps R3 and R3 Overlaps R4 . Let the rectangles in relations R1 , R2 , R3 and R4 be represented using u, v, w and x respectively. The rectangle-set U1 =(u1 ,v1 ,w1 ) is consistent with the relation-set Rs =(R1 , R2 , R3 ) as rectangle u1 and v1 overlap and rectangles v1 and w1 overlap. This is required by the presence of join conditions ‘R1 Overlaps R2 ’ and ‘R2 Overlaps R3 ’ in query Q. There is no condition R1 Overlaps R3 in Q1 and hence the overlap of rectangles u1 and w1 is not required for consistency. The rectangle-set U1 =(u2 ,v1 ,w1 ) is not consistent with Rs =(R1 ,R2 ,R3 ) as rectangles u2 and v1 do not overlap but this is required by the presence of condition ‘R1 Overlaps R2 ’ in query Q. The intuition behind the notion of consistency is that each subset of an output tuple must be consistent. For example, consider the output tuple U=(u1 ,v1 ,w1 ,x1 ) and query Q1 . Each subset of the tuple U is consistent. One of the condition of C-Rep is that the rectangles which are replicated must be part of some consistent rectangle-sets.
uSc =
[ U
U, s.t. U ∈ USc
C-Rep replicates all rectangles in uSc which start in partitioncell c i.e., the start-point of rectangle u lies in cell c.
7.5 Proof-of-Correctness We next show that this approach will compute the join output correctly. Consider the rectangles in an output tuple U ′ =(u1 ,u2 ,. . . ,um ), ui ∈ Ri . Consider the set of rectangles ′ ′ Uc , Uc ⊆ U ′ which are split or projected onto the partitioncell c. Let Rc be the set of relations to which the rectangles ′ in Uc belong. As an output tuple is by default consistent ′ with R, the set of rectangles Uc will be consistent with Rc . This satisfies the condition C1. So we next need to show ′ that Uc satisfies the conditions C2 and C3. Consider a join condition represented by a triple (P ,Rj ,Rk ) or (P ,Rk ,Rj ) in Q s.t. Rj ∈ Rc , Rk ∈ / Rc and Rk ∈ R. Let uk and uj be the corresponding rectangles in U ′ , i.e., uk ∈ Rk and uj ∈ Rj . As uj and uk are present in the output tuple, they must overlap. However the rectangle uk does not belong to Uc′ as Rk ∈ / Rc . Rectangle uj and uk hence can overlap only if rectangle uj crosses-over the boundary of cell c. Condition C2 represents this case. However if no such join-condition exists in query Q, it implies that all rectangles in U ′ overlap with partition-cell c. The cell c hence can itself compute the output tuple U ′ and does not need to replicate any rectangle. Condition C3 represents this boundary case. Condition C4 is hence present only for efficiency purposes. If a rectangle-set U satisfies conditions C1-C3, all of its subsets will also satisfy conditions C1-C3.
7.4 Conditions of Controlled-Replicate We now describe the conditions of Controlled-Replicate framework which are used to find rectangles to be replicated. Let the query be Q and its relation-set R. Let Uc be the set of rectangles split on partition-cell c and subsequently received by the reducer c. The reducer c first identifies all rectangle-sets U which satisfy the following conditions. Let Rs be the set of relations to which the rectangles in U belong to.
7.6 Intuition behind Controlled-Replicate Condition C1 conveys that a rectangle-set U must be consistent for inclusion in USc (Section 7.3). It is because each subset of an output tuple is by default consistent. If a rectangle-set U is not consistent, it can not be part of an output tuple. Condition C2 conveys that if the number of rectangles in a consistent rectangle-set U is less than the number of relations involved in query Q (i.e., the cardinality of R), then certain rectangles in U must cross-over the partition-cell boundary. Consider the join condition in Q - (P , R1 , R2 ) s.t. R1 ∈ Rs and R2 ∈ / Rs and let u be the rectangle in U belonging to relation R1 . If rectangle u does not cross the partition-cell c, then u can not overlap with any rectangle v which does not overlap with cell c. U hence must not be included in USc even though it is consistent. By not including U in USc , C-Rep will possibly avoid replicating some rectangles 2 .
1. C1: U is consistent with Rs . 2. C2: Consider two relations R1 and R2 , R1 ∈ Rs , R2 ∈ / Rs and R2 ∈ R s.t. there is a triple (Ov,R1 ,R2 ) or (Ov,R2 ,R1 ) in Q. Let u1 be the rectangle in U which belongs to relation R1 . For all such pairs R1 and R2 , the rectangle u1 crosses the boundary of partition-cell c i.e., rectangle u1 overlaps with a partition-cell other than c. 3. C3: There must be at least one pair (R1 ,R2 ) satisfying the conditions C2. 4. C4: No superset of U satisfies conditions C1, C2 and C3. Let USc be the set of such rectangle-sets. We define uSc as the union of all rectangle sets in USc i.e.,
2 Possibly, because a rectangle u in U may still get replicated as it may be a part of another rectangle-set in USc
119
Condition C3 conveys that the reducer c may receive all rectangles to form an output tuple. Such a rectangle-set is consistent and also satisfies condition C2 as no rectangle needs to cross-over. However this must not be included in USc as reducer c will receive these rectangles in second round and can compute this output tuple. Condition C3 hence eliminates this boundary case. Consider the simple scenario of Figure 4 and query Q1 (Section 7.3). Let the rectangles of relations R1 , R2 , R3 , R4 be represented by u,v,w and x respectively. (u1 , v1 , w1 , x1 ) form an output tuple. Reducer c1 receives rectangles v1 and w1 and needs to decide whether to replicate these rectangles or not. The set (v1 , w1 ) is consistent with its relation-set (R2 , R3 ) as v1 and w1 overlap. If v1 and w1 were not overlapping, reducer C1 would have deduced that v1 and w1 together can not be part of an output tuple (Condition C1). Secondly both rectangles v1 and w1 cross over the cell c1 . They can hence overlap with other rectangles not overlapping with cell c1 (u1 and x1 in this case) and hence can form an output tuple (Condition C2). If any of the v1 or w1 were not crossing over, reducer c1 would have deduced that v1 and w1 together can not form an output tuple with rectangles not overlapping with cell c1 . Reducer c1 hence finds that the rectangle-set (v1 , w1 ) is a candidate-set that can belong to an output tuple and replicates both the rectangles v1 and w1 . Note that the output tuple (u1 , v1 , w1 , x1 ) will be computed by reducer c4 .
Figure 5: Controlled-Replicate Example (R2 ) and it crosses the cell-boundary of C1 as required by conditions R1 overlaps R2 and R2 overlaps R3 . Consider the rectangle-set U4 =(u2 , v3 , w1 , x2 ). This set belongs to the output and can be computed by the reducer c1 itself. U4 hence violates the condition C3 of CRep. Next consider the set U5 =(v2 , w1 ). This is consistent with relation-set (R2 , R3 ) however the rectangle v2 does not cross the cell-boundary as required due to the join condition R1 overlaps R2 . U5 hence violates the condition C2 of CRep.No other rectangle-sets satisfy all conditions of C-Rep. For reducer c3 the rectangle set U6 =(u3 ,v3 ) satisfies all conditions of C-Rep. However the reducer c3 replicates only the rectangle u3 as the rectangle v3 does not start within c3 . The output tuples (u2 , v3 , w1 , x1 ), (u2 , v3 , w1 , x2 ), (u3 , v3 , w1 , x1 ) and (u3 , v3 , w1 , x2 ) are computed by reducers c2 , c1 , c4 and c3 respectively in the second stage. Table 3: Query Q2 , Varying rectangle dimensions
nI=2 million, dS=Uniform, dX, dY, dL, dB=Uniform (xmin ,xmax )=(0,100K), (ymin , ymax )=(0,100K) lmax , Time 2-way Time Time # Recs Rep. # Recs Rep. bmax Cascade C-Rep C-Rep-L C-Rep C-Rep-L (hh:mm) (hh:mm) (hh:mm) (million) (million) 100 00:10 00:07 00:07 0.11, (7.6) 0.11 (6.1) 200 00:13 00:09 00:08 0.25, (10.1) 0.25 (6.5) 300 00:30 00:16 00:13 0.39, (12.0) 0.39 (6.8) 400 02:23 00:28 00:20 0.53, (14.5) 0.53 (7.1) 500 05:14 00:59 00:33 0.67 (16.8) 0.67 (7.3)
7.7 Illustrative Example We next illustrate the working of C-Rep approach using a detailed example. Consider the rectangles shown in Figure 5 with the whole 2D space partitioned into 4 cells and the query Q1 (Section 7.3). Rectangles belonging to relations R1 , R2 , R3 and R4 are represented using u, v, w and x respectively. For the rectangles shown in Figure 5 the output will consist of tuples (u2 , v3 , w1 , x1 ), (u2 , v3 , w1 , x2 ), (u3 , v3 , w1 , x1 ) and (u3 , v3 , w1 , x2 ) . Consider the reducer c1 . After splitting every rectangle, the reducer c1 receives the rectangles u1 , v1 , v2 , v3 , x2 , u2 , w1 and v4 in the first stage. The set USc1 is [(u2 , v3 , w1 ), (v3 , w1 , x2 ), (v4 )] as these three sets satisfy all four conditions of C-Rep. The set uSc1 is hence (u2 , v3 , v4 , w1 , x2 ) and reducer c1 replicates all these rectangles as they all start-out within c1 . The rectangle-set U1 =(u2 , v3 , w1 ) is consistent with relation set Rs1 =(R1 , R2 , R3 ) as rectangles in U1 satisfy the overlap predicates formed by relations in Rs1 . Rectangles u2 and v3 overlap and rectangles v3 and w1 overlap. As there is the join-condition R3 overlaps R4 in query Q, the condition C2 of C-Rep requires that the rectangle w1 crosses the partition-cell boundary and it does. The rectangle-set U1 is hence included in set USc1 . The inclusion of the set U1 in Rs1 signifies that there might be an output tuple of form (u2 , v3 , w1 , x), x ∈ R4 s.t. x does not intersect with cell c1 . In the Figure 5, (u2 , v3 , w1 , x1 ) is such an output tuple. Supposing x1 were not present the reducer would have still needed to replicate the rectangles in U1 as the reducer c1 does not have any way to know this apriori. Similar is the case for rectangle-set U2 =(v3 , w1 , x2 ). U2 is consistent with relation-set Rs2 =(R2 , R3 , R4 ). The presence of join-condition R1 overlaps R2 requires that the rectangle v3 crosses the cell-boundary and it does. The rectangle-set U3 =(v4 ) is consistent with relation-set
7.8 Experimental Evaluation In this section, we show the efficacy of C-Rep approach over naive approaches first on synthetic and then on a reallife data-set. We first describe the cluster set-up, how we generate the synthetic data and the details of real-life California Road data.
7.8.1 Experimental SetUp The experiments are run over a 16 core Hadoop cluster built using Blade Servers with three 3 GHz Xeon processors having 8GB memory and 200 GB SATA drives. These machines run Red Hat Linux 5.2. The software stack comprises of Hadoop 0.20.2 with HDFS. All the experiments are executed with 64 reduce processes. The 2D space is hence divided in 8x8 grid.
7.8.2 Datasets Generation of Synthetic Data: We use synthetic data for experimental evaluation. We write a script to generate a set of rectangles. The parameters to this script are the following: (a) Number of rectangles (nI), (b) Distribution of x and y coordinates of start-point of rectangles (dX and dY ). (c) Distribution of rectangle length and breadth (dL and dB), (d) x and y ranges within which all rectangles lie ([xmin , xmax ], [ymin , ymax ]) (e) Minimum and maximum length and breadth of rectangles ([lmin , lmax ], [bmin , bmax ]).
120
Table 2: Query Q2 , Varying the dataset size
nI # Tuples (million) 1 2 3 4 5
Time 2-way Cascade (hh:mm) 00:05 00:10 00:13 00:24 00:35
dS=Uniform, dX, dY, dL, dB=Uniform, (xmin ,xmax )=(0,100K) (ymin , ymax )=(0,100K), (lmin ,lmax )=(0,100), (bmin ,bmax )=(0,100) Time Time Time # Rectangles Rep. # Rectangles Rep. All-Rep C-Rep C-Rep-L All-Rep C-Rep (hh:mm) (hh:mm) (hh:mm) (millions) (millions) 00:32 00:05 00:05 3, (64.3) 0.05, (3.9) 01:22 00:07 00:07 6, (128.7) 0.1, (7.6) >03:00 00:08 00:09 9, (-) 0.19, (12.5) >03:00 00:11 00:11 12, (-) 0.23, (15.6) >03:00 00:15 00:13 15, (-) 0.31 (19.8)
# Rectangles Rep. C-Rep-L (millions) 0.05 (3.0) 0.1 (6.1) 0.19 (9.2) 0.23 (12.2) 0.31 (17.9)
7.8.4 Varying DataSet Size - Synthetic Data
The computational effort needed to compute the join can be effected by varying these parameters e.g., increasing number of rectangles results in a larger output size. If lmax or bmax increases, more rectangles will overlap and the output size will be larger. We can hence carry out a number of controlled-experiments to investigate the efficacy of approaches presented in this paper. Details of real-life California Road Data: Census 2000 TIGER/Line shape files were used to create the real data set [1]. Road data layer information in the California state was used to generate MBBs in the real data set. The total number of road objects in the California dataset is 2092079. For each road object in the shape file, given bounds were used to create MBBs. We then converted the latitude and longitude to a flat XY co-ordinate system using the Openmap library [2] and the ratio |x-range|/|y-range| was found to be 0.63. The flattened MBBs were used for all the join computations in our experiments. The mapping was done on 2D space with y-range as [0, 100K] and x-range as [0,63K]. Average MBB length and breadth were found to be 18 and 8 respectively. Minimum and maximum MBB length were found to be 1 and 2285 respectively while minimum and maximum MBB breadth were found to be 1 and 1344 respectively. Minimum and maximum MBB areas were found to be 1 and 3071K respectively. 97% of rectangles have both length and breadth less than 100 while 99% of the rectangles have both their length and breadth less than 1000.
We consider the query Q2 = R1 overlaps R2 and R2 overlaps R3 . Table 2 presents a comparison of all three approaches, 2-way Cascade, All-Rep and C-Rep (Ignore CRep-L at the moment). We generate three sets of rectangles synthetically, R1 , R2 and R3 . Parameter values using which the synthetic data is generated are also provided in Table 2. All three relations contain same number of tuples. The number of tuples in all three relations are varied from 1 million to 5 million. Both 2-way Cascade and All-Rep are found to be taking much longer time vis-a-vis C-Rep. The time required for both of these increases rapidly as the size of the relations increase. 2-way Cascade solves a multi-way join query as a series of 2-way joins which involves joining large intermediate results and hence requires a much higher time to complete. All-Replicate replicates all rectangles and hence incurs a much higher communication cost. In comparison, C-Rep replicates a much smaller number of rectangles. Table 2 also presents the number of rectangles replicated for both the approaches. The numbers in parentheses represent the number of rectangles after the replication (Section 7.8.3). For nI=1 million, All-Rep communicates an aggregated 64.3m rectangles while C-Rep communicates only 3.9m rectangles. It is this huge reduction in the number of communicated rectangles which shows up in much improved performance of C-Rep over All-Rep. Both the communication cost as well as the time required for computing the partial join output at each reducer are smaller for C-Rep vis-a-vis All-Rep. We do not present the numbers for All-Rep in the remaining experiments as it is clear that C-Rep will significantly outperform All-Rep .
7.8.3 Metrics Computed In each experiment we report the following metrics: 1. Time Taken: This is the end-to-end time for running an algorithm. It covers cost of reading and parsing data, communication cost among the cluster nodes, join processing cost as well as the cost of writing intermediate outputs on HDFS.
7.8.5 Varying Rectangle Size - Synthetic Data We next keep the number of rectangles in each dataset at 2m while varying lmax and bmax . As rectangles of larger and larger dimensions are allowed, more number of rectangles overlap and larger is the size of output. The results are presented in Table 3. The C-Rep approach easily outperforms the naive 2-way Cascade.
2. The number of Rectangles Replicated: This is the number of rectangles marked by C-Rep for replication. 3. The number of Rectangles After Replication: A rectangle is communicated to multiple reducers after replication. This is the aggregated count of rectangles communicated to reducers after replication. For example, in Figure 5, the rectangle w1 after replication, is communicated to reducers C1 , C2 , C3 and C4 . The rectangle w1 hence is counted once in the metric ‘the number of rectangles replicated’ and four times in the metric ‘the number of rectangles communicated after replication’. This metric is hence much larger than the number of rectangles replicated in C-Rep. In all experiments this metric is mentioned within parenthesis.
7.8.6 Experiments on California Road Data We first define the notion of enlarging a rectangle by factor k. Enlarging a rectangle by factor k: Let (x1 , y1 ) be the top-left vertex of a rectangle and let (x2 , y2 ) be the bottomright vertex . The top-left vertex of the enlarged rectangle by factor k is given by (x1 − (x2 − x1 ) ∗ (k − 1)/2, y1 + (y2 − y1 ) ∗ (k − 1)/2) and the bottom-right vertex is given by (x2 + (x2 − x1 ) ∗ (k − 1)/2, y2 − (y2 − y1 ) ∗ (k − 1)/2)). In other words, the length and breadth of each rectangle is increased by a factor of k keeping the center of the rectangle
121
dmax for R2 and R3 . Consider the output tuple (u,v,w,x). Rectangles u and x can at most be distance 2dmax apart as the maximum diagonal length is dmax (Figure 6). Hence rectangle u (and x) needs to be replicated to all cells in 4th quadrant which are at most 2dmax distance apart from rectangle u. Similarly rectangles v and x (u and w) can be at most dmax apart. C-Rep hence limits the number of rectangles being replicated and C-Rep-L limits the extent of replication of rectangles chosen by C-Rep for replication.
Figure 6: Controlled Replication In Limit identical. In this experiment we compare the performance of 2-way Cascade and C-Rep on real-life California road data. We consider the star join query Q2s =R Overlaps R and R Overlaps R. This hence find road triples (rd1 ,rd2 ,rd3 ) such that rd1 overlaps with rd2 and rd2 overlaps with rd3 . We take California Road data and construct different datasets from this by enlarging each rectangle by a factor k. Hence as the enlarging factor increases, the sizes of the MBBs increase and more and more MBBs will overlap resulting in a larger output. Table 4 provides the comparison. We again find that C-Rep easily outperforms 2-way Cascade.
7.10 Experimental Evaluation-2 We implement C-Rep-L as described above and repeat the two controlled-experiments on synthetic data outlined in Section 7.8.4 and 7.8.5. Tables 2 and 3 also list out the results for C-Rep-L. The first experiment varies the number of rectangles. Not much difference is observed between C-Rep and C-Rep-L as the number of rectangles after replication (Section 7.8.3) i.e., the numbers in parenthesis are of similar magnitude. Note that the number of replicated rectangles remain the same. C-Rep-L only determines the limit to which a rectangle is replicated to. The decision whether a rectangle needs to be replicated or not is made by C-Rep. However a large improvement is observed in the performance of C-Rep-L vis-a-vis C-Rep for the case when we vary the maximum rectangle dimension (Table 3). As the lmax and bmax increase, the number of overlapping rectangles also increase. There is a substantial difference between the number of rectangles after replication (numbers in parenthesis) between C-Rep and C-Rep-L. C-Rep-L involves much smaller number of rectangles after replication and this translates to a smaller processing time. This shows the efficacy of C-Rep-L in identifying and eliminating unnecessary replication. Overall C-Rep-L substantially improves over the naive approach of 2-way Cascade. Finally Table 4 presents the performance of C-Rep-L on California road data. A small improvement is observed in the performance of C-Rep-L over C-Rep. The improvement is small as there is not much difference between the number of rectangles after replication (number in parenthesis).
Table 4: Query Q2s , California Road Data
nI=2 million (xmin ,xmax )=(0,63K), (ymin , Enlar Time Time Time ging 2-way Cd C-Rep C-Rep-L F actor (hh:mm) (hh:mm) (hh:mm) 1.00 00:19 00:15 00:14 1.25 00:27 00:24 00:21 1.5 00:43 00:25 00:24 1.75 01:04 00:46 00:42 2.0 01:35 00:57 00:53
ymax )=(0,100K) #Recs Rep. #Recs Rep. C-Rep C-Rep-L (million) (million) 0.08, (0.8) 0.08 (0.64) 0.12, (0.9) 0.12 (0.65) 0.18, (1.0) 0.18 (0.66) 0.23, (1.14) 0.23 (0.67) 0.32 (1.33) 0.32 (0.68)
7.9 Controlled Replicate in Limit C-Rep approach replicates a rectangle u starting out in partition-cell c to all reducers which lie in the 4th quadrant wrt partition-cell c. However a rectangle is only likely to join with rectangles which start-out in neighboring partitioncells. Rectangle u hence is not likely to be present in the join outputs of many reducers. Performance of C-Rep hence can be improved if we can apriori decide which reducers won’t require a rectangle and avoid replicating the rectangle to those reducers. We call this approach as Controlled Replicate in Limit (C-Rep-L). We can design one such scheme if we know the upper bound on the diagonal length of the rectangles for each relation. Lets say dmax is the upper bound on the diagonallength for each relation. If number of relations in the query are m, a rectangle u being replicated by C-Rep need only be communicated to reducers which are in the 4th quadrant to rectangle u and are at most a distance of (m − 2) ∗ dmax from the rectangle u 3 . Consider the figure 6 and query Q1 (Section 7.3). Suppose dmax is an upper-bound on the diagonal-length of any rectangle. Then it suffices that rectangles of relation R1 and R4 are replicated within distance 2dmax while rectangles of relations R2 and R3 are replicated within distance dmax i.e., the replication function f2 is applied with distance parameter 2dmax for relations R1 and R4 while with parameter
8. HANDLING RANGE JOINS In this section we present Controlled-Replicate based approaches for handling multi-way range join queries. The selectivity of range predicate is much lower as compared to overlap predicate as a range predicate joins rectangles at some distance apart while overlap predicate joins rectangles which are overlapping. The conditions for C-Rep for range join queries remain the same except condition C2 outlined below. We are looking for properties a rectangle-set U must satisfy in cell c. Condition C2 in Controlled-Replicate for Range Joins: Consider two relations R1 and R2 , R1 ∈ Rs , R2 ∈ / Rs and R2 ∈ R s.t. there is a triple (Ra(d),R1 ,R2 ) or (Ra(d),R2 ,R1 ) in Q. Let u1 be the rectangle in U which belongs to relation R1 . For all such pairs R1 and R2 , there must be a cell c′ (6= c) which is within distance d from rectangle u1 i.e. dist(c′ , u1 ) ≤ d. The proof-of-correctness is along the similar lines as outlined in Section 7.4. The revision in the condition C2 is natural as if a rectangle u1 starting within cell c is within range d of another rectangle u2 starting in cell c′ then cell c′ must be within distance d from u1 . If not, rectangle u1
3 It is assuming that the query is a chain join. The bounds can be easily obtained for a general query graph. A graph formalism is avoided in this paper so as to avoid mathematical details not directly relevant to this paper.
122
We now present an experimental evaluation on both synthetic as well as California Road data. We consider the query Q3 =R1 Ra(d) R2 and R2 Ra(d) R3 with d=100. We first generate three sets of rectangles synthetically. In the first experiment, we vary the number of rectangles in each relation while keeping other parameters identical. Table 5 presents the results. The parameters using which the synthetic data is generated are also provided. Performance numbers for 2-way Cascade quickly spiral out. C-Rep-L provides much better performance vis-a-vis both 2-way Cascade and C-Rep. It is again due to the fact that C-Rep-L carries out much lesser redundant replication. Numbers of rectangles after replication (Section 7.8.3) i.e. the numbers in parenthesis, are found to be approx. 30% of the corresponding numbers for C-Rep. There is hence a huge difference between the number of communicated rectangles between C-Rep and C-Rep-L. For example, for nI=5m, C-Rep communicates 40 million pairs more than those communicated by C-Rep-L and this difference exhibits as a much improved performance of C-Rep-L. In the second experiment, we vary the distance parameter d and process query Q3 . Number of rectangles are fixed at 1 million in all relations. Table 6 presents the results. C-RepL clearly out-performs C-Rep. It is again due to the fact that the number of rectangles after replication are much smaller for C-Rep-L as compared to C-Rep. Finally, we present performance results on California Road Data in Table 7. We consider the query: Q3 s=R Ra(d) R and R Ra(d) R. This finds the road triples (rd1 ,rd2 ,rd3 ) such that rd1 is within distance d from rd2 and rd2 is within distance d from rd3 . We sample the road data with probability 0.5 and retain only 1 million road MBBs. We then vary the distance parameter d. C-Rep beats 2-way Cascade easily. C-Rep-L performs slightly better than C-Rep as there is a slight reduction in the number of rectangles after replication.
Figure 7: Controlled Replication for Range Queries
Figure 8: C-Rep In Limit for Range Queries can have range relationship only with rectangles starting in cell c and need not be replicated. For example, consider the query Q3 =R1 Ra(d) R2 and R2 Ra(d) R3 and Figure 7. Let the rectangles denoted by u, v and w belong to relations R1 , R2 and R3 . Reducer C1 will receive rectangle u1 , v1 and v2 in the first round. Consider the reducer C1 and rectangle-set (u1 , v1 ). As the cell C2 is less than distance d apart from rectangle v1 , rectangle v1 can be within distance d of a rectangle (∈ R3 ) starting out in cell C2 . For example rectangle v1 is within distance d of rectangle w1 . Rectangle-set (u1 , v1 ) is consistent as rectangle u1 is within distance d of rectangle v1 and hence reducer C1 will mark rectangles u1 and v1 for replication. Note that even if the rectangle w1 were more than distance d apart from rectangle v1 , u1 and v1 would have still required to be replicated as reducer C1 has no way to figure that out. Rectangle v2 will not be replicated as no cell is within distance d of v2 and hence condition C2 as described above is not satisfied. Controlled-Replicate-In-Limit: We next extend the arguments in Section 7.9 in case of range joins. We need to find the distance to which a rectangle marked by C-Rep needs to be replicated to. If the number of relations in the query are m, dmax is the upper-bound on the diagonal length of rectangles and d is the upper-bound on all the range parameters in the query then a rectangle u needs to be replicated to all cells in the 4th quadrant which are within a distance (m − 2)*dmax +(m − 1)*d from rectangle u. Consider Figure 8 and query R1 Ra(d) R2 and R2 Ra(d) R3 and R3 Ra(d) R4 . Let rectangles u, v, w and x belong to relations R1 , R2 , R3 and R4 respectively. Rectangles u and x can be part of an output tuple only if they are within distance 2*dmax +3*d as shown in Figure 8. Hence a rectangle belonging to relations R1 and R4 need to be replicated to 4th quadrant cells within distance 2*dmax +3*d. Similarly rectangles belonging to relations R2 and R3 need to be replicated to 4th quadrant cells within distance dmax + 2*d. Rectangles v and x can be part of an output tuple only if they are within distance dmax +2*d. Rectangles v and w or rectangles v and u can be part of an output tuple only if they are within distance d. Hence R2 rectangles must be replicated to distance dmax +2*d. Similar is the reasoning for rectangles belonging to relation R3 .
Table 5: Query Q3 , Varying the dataset size
dS=Uniform, dX, dY, dL, dB=Uniform, (xmin , xmax )=(0,100K) (ymin , ymax )=(0,100K), (lmin , lmax ) & (bmin , bmax )=(0,100) nI, # Rectangles Replicated in millions nI Time Time Time # Rectangles # Rectangles 2-way Cd C-Rep C-Rep-L Replicated Replicated (hh:mm) (hh:mm) (hh:mm) C-Rep C-Rep-L 1 00:11 00:10 00:06 0.36, (9.1) 0.36 (3.0) 2 00:56 00:27 00:12 0.61, (16.5) 0.61 (6.1) 3 02:27 01:12 00:23 0.96 , (26.2) 0.96 (9.7) 4 04:23 01:43 00:39 1.3 , (41.6) 1.3 (12.8) 5 >06:00 02:37 01:03 1.7 (58.4) 1.7 (15.8)
Table 6: Query Q3 , Varying distance parameter d
dS, dX, dY, dL, dB=Uniform, (xmin , xmax )=(0,100K) (ymin , ymax )=(0, 100K), (lmin ,lmax ) & (bmin ,bmax )=(0,100) nI = 1 million, # Rectangles Replicated in millions d Time Time # Rectangles # Rectangles C-Rep C-Rep-L Replicated Replicated (hh:mm) (hh:mm) C-Rep C-Rep-L 100 00:10 00:06 0.36, (9.1) 0.36 (3.0) 200 00:18 00:08 0.53, (13.1) 0.53 (3.2) 300 00:42 00:15 0.72, (16.5) 0.72 (3.3) 400 01:16 00:25 0.94, (20.3) 0.94 (3.4) 500 01:40 00:41 1.06, (24.8) 1.06 (3.5)
9. MULTI-WAY HYBRID JOIN QUERIES The Controlled-Replicate framework easily extends to handle join queries involving both overlap and range predicates. Condition C2 can be written down as follows. We are looking for properties, a rectangle-set U must satisfy in cell c.
8.1 Experimental Evaluation
123
10. CONCLUSIONS
Table 7: Query Q3 s, California Road Data
In this paper we proposed novel approaches to handle multi-way spatial join queries on map-reduce platform. The proposed Controlled-Replicate framework is designed to minimize the communication among the cluster nodes. Using an experimental study over both synthetic and real-life California road data, we demonstrated that the proposed algorithms significantly improved the performance vis-a-vis naive methods. Though we presented our techniques in context of spatial data, we believe they are more general in applicability. We hence plan to look for use-cases other than spatial data. We also plan to look how we can use the proposed approaches for processing other classes of spatial queries e.g., nearest neighbor, containment etc.
nI=1m, (xmin , xmax )=(0,63K) (ymin , ymax )=(0,100K) nI, # Rectangles Replicated in millions d Time 2-way Time Time # Recs # Recs Cascade C-Rep C-Rep-L Rep. Rep. (hh:mm) (hh:mm) (hh:mm) C-Rep C-Rep-L 5 01:16 00:14 00:11 0.04, (4.1) 0.36 (3.1) 10 02:02 00:21 00:16 0.07, (4.9) 0.61 (3.2) 15 02:52 00:36 00:23 0.09, (5.4) 0.96 (3.2) 20 04:06 00:46 00:31 0.10, (5.9) 1.3 (3.3)
Condition C2 in Controlled-Replicate for Hybrid Queries: Consider two relations R1 and R2 , R1 ∈ Rs , R2 ∈ / Rs and R2 ∈ R s.t. there is a triple (P ,R1 ,R2 ) or (P ,R2 ,R1 ) in Q. Let u1 be the rectangle in U which belongs to relation R1 . For all such pairs R1 and R2 , the following holds:
11. REFERENCES
[1] Census 2000 Tiger/Line Data www.esri.com/data/download/census2000-tigerline. [2] OpenMap Library http://openmap.bbn.com/. [3] F. N. Afrati and J. D. Ullman. Optimizing joins in a map-reduce environment. In EDBT, 2010. [4] S. Blanas, J. M. Patel, V. Ercegovac, J. Rao, E. J. Shekita, and Y. Tian. A comparison of join algorithms for log processing in mapreduce. In SIGMOD, 2010. [5] T. Brinkhoff, H. P. Kriegal, and B. Seeger. Efficient processing of spatial joins using R-trees. In SIGMOD, 1993. [6] T. Brinkhoff, H.-P. Kriegel, R. Schneider, and B. Seeger. Multi-step processing of spatial joins. In SIGMOD, 1994. [7] T. Brinkhoff, H.-P. Kriegel, and B. Seeger. Parallel processing of spatial joins using r-trees. In ICDE, 1996. [8] J. Dean and S. Ghemawat. Mapreduce: simplified data processing on large clusters. Commun. ACM, 51(1), 2008. [9] J.-P. Dittrich and B. Seeger. Data redundancy and duplicate detection in spatial join processing. In ICDE, 2000. [10] O. G¨ unther. Efficient computation of spatial joins. In ICDE, 1993. [11] M.-L. Lo and C. V. Ravishankar. Spatial joins using seeded trees. In SIGMOD, 1994. [12] M.-L. Lo and C. V. Ravishankar. Spatial hash-joins. In SIGMOD, pages 247–258, 1996. [13] W. Lu, Y. Shen, S. Chen, and B. C. Ooi. Efficient processing of k nearest neighbor joins using mapreduce. PVLDB, 5(10), 2012. [14] N. Mamoulis and D. Papadias. Integration of spatial join algorithms for processing multiple inputs. In SIGMOD, 1999. [15] N. Mamoulis and D. Papadias. Multiway spatial joins. ACM Trans. Database Syst., 26(4), 2001. [16] A. Okcan and M. Riedewald. Processing theta-joins using mapreduce. In SIGMOD, 2011. [17] D. Papadias and D. Arkoumanis. Approximate processing of multiway spatial joins in very large databases. In EDBT, 2002. [18] J. M. Patel and D. J. DeWitt. Partition based spatial-merge join. In SIGMOD, 1996. [19] J. M. Patel and D. J. DeWitt. Clone join and shadow join: two parallel spatial join algorithms. In ACM-GIS, 2000. [20] R. Vernica, M. J. Carey, and C. Li. Efficient parallel set-similarity joins using mapreduce. In SIGMOD, 2010. [21] K. Wang, J. Han, B. Tu, J. Dai, W. Zhou, and X. Song. Accelerating spatial data processing with mapreduce. In ICPADS, 2010. [22] S. Zhang, J. Han, Z. Liu, K. Wang, and S. Feng. Spatial queries evaluation with mapreduce. In GCC, 2009. [23] S. Zhang, J. Han, Z. Liu, K. Wang, and Z. Xu. Sjmr: Parallelizing spatial join with mapreduce on clusters. In CLUSTER, 2009.
1. If predicate P is an overlap predicate, the rectangle u1 crosses the boundary of partition-cell c. 2. If predicate P is a range predicate with distance parameter d, there must be a cell c′ (6= c) which is within distance d from rectangle u1 i.e. dist(c′ , u1 ) ≤ d.
Condition C2 is a natural union of the individual C2 conditions presented in Section 7 and Section 8. Alternatively a hybrid query can be handled by replacing the overlap predicate as a range predicate with distance parameter 0 and handling the resulting query as a multi-way range join query. Similarly for C-Rep-L we can derive the distance bounds for rectangles belonging to each relation. Table 8: Query Q4 , Varying the dataset size dS=Uniform, dX, dY, dL, dB=Uniform, (xmin , xmax )=(0,100K) (ymin , ymax )=(0,100K), (lmin , lmax ) & (bmin , bmax )=(0,100) nI, # Rectangles Replicated in millions, d=200 nI Time Time # Rectangles # Rectangles # Recs C-Rep C-Rep-L Replicated Replicated (hh:mm) (hh:mm) C-Rep C-Rep-L 1 00:07 00:06 0.27, (8.0) 0.27 (3.1) 2 00:16 00:12 0.57, (15.8) 0.57 (6.3) 3 00:39 00:23 0.94 , (26.5) 0.94 (9.6) 4 01:08 00:44 1.22 , (33.0) 1.22 (12.7) 5 01:57 01:16 1.54, (46.3) 1.54 (16.1)
Table 9: Query Q4 s, California Road Data
dS=Uniform, dX, dY, dL, dB=Uniform, (xmin , xmax )=(0,63K) (ymin , ymax )=(0,100K) nI=1 million, # Rectangles Replicated in millions d Time Time # Rectangles # Rectangles C-Rep C-Rep-L Replicated Replicated (hh:mm) (hh:mm) C-Rep C-Rep-L 10 00:28 00:26 0.08, (5.0) 0.08 (3.6) 20 00:39 00:30 0.11, (5.9) 0.11 (3.8) 30 00:51 00:41 0.14 , (6.7) 0.14 (3.9) 40 01:03 00:48 0.18 , (7.5) 0.18 (4.1)
9.1 Experimental Evaluation We consider the query Q4 =R1 Ov R2 and R2 Ra(d) R3 with d=200. Table 8 presents the comparison between C-Rep and C-Rep-L on synthetic data. The parameters using which the synthetic data is generated are also provided. We vary the relation size while keeping other parameters same. Table 9 presents the results for California road data. Here we consider the query Q4 s=R Ov R and R Ra(d) R. This finds road triples (rd1 , rd2 , rd3 ) such that rd1 overlaps with rd2 and rd2 is within distance d of r3 . We vary the parameter d while keeping the number of roads as 1m (sampled with probability 0.5). Once again we get the similar trends and C-Rep-L out-performs C-Rep.
124