Send Orders for Reprints to
[email protected] The Open Geology Journal, 2014, 8, (Suppl 1: M5) 69-83
69
Open Access
Processing of Multispectral ASTER Data for Mapping Alteration Minerals Zones: As an Aid for Uranium Exploration in Elmissikat-Eleridiya Granites, Central Eastern Desert, Egypt Mahmoud Elsaid*,1, Hatem Aboelkhair2, Ahmed Dardier1, Elsayed Hermas3 and Urai Minoru4 1
Research Sector, Nuclear Materials Authority (NMA), Cairo, Egypt
2
Geology Department, Faculty of Science, Damietta University, New Damietta, Egypt
3
National Authority for Remote Sensing and Space Sciences (NARSS), Cairo, Egypt
4
Geological Survey of Japan (GSJ), AIST, Tsukuba 305-8567, Japan Abstract: Elmissikat-Eleridiya district is one of the most important uranium localities in the central Eastern Desert of Egypt. The feature oriented principal component selection (FPCS) and spectral angle mapper (SAM) techniques were applied on ASTER L1B imagery for mapping the common alteration zones. The study revealed that ASTER VNIR-SWIR bands are effectively used for delineating sericite, kaolinite, chlorite, illite and hematite bearing alteration zones, whereas ASTER TIR bands are most effective in delineation of silica-rich zones, which associate and could be used as pathfinder for radioactive mineralization within the study area. The resultant alteration maps show good coincidence with the explored uranium sites and suggest further similar unexplored sites. The results could assist the development of uranium exploration in the study area and other similar localities within the Egyptian deserts.
Keywords: Elmissikat-Eleridiya, FPCS, SAM, ASTER, Radioactive Mineralization, Thermal Emissivity. 1. INTRODUCTION The Egyptian basement complex has been discussed according to the plate tectonics theory [1-8]. Church [9] represented the evolution of the Pan-African in the Eastern Desert of Egypt through a complex sequence of events including the formation of one or several rift zones propagated within a more intracontinental crustal evolution like the Appalachian and Hercynian systems of Western Europe and Northern America. Granitic rocks occupy about 60 % of the total basement terrain of the Nubian Shield in Egypt [3]. The granites are the sole possible source for all uranium ore deposits in the Eastern Desert of Egypt. So the study of granites is very important to identify the type favorable for forming uranium ore deposits. According to their relative ages granitic rocks in Egypt have been divided into older and younger granites [10]. Elmissikat-Eleridiya younger granite is one of the most important promising anomalous radioactive zones in the central Eastern Desert of Egypt. The advanced space-borne thermal emission and reflection radiometer (ASTER) was launched on board NASA’s Terra spacecraft in December 1999. It covers a wide spectral region with 14 bands from the visible to the thermal infrared with high spatial, spectral and radiometric *Address correspondence to this author at the Research Sector, Nuclear Materials Authority (NMA), Cairo, Egypt; Tel: +2 0111 025 9784; +2 0106 9419293; E-mail:
[email protected]
1874−2629/14
resolution. An additional backward-looking near infrared band provides stereo coverage. The spatial resolution varies with wavelength: 15 m in the visible and near infrared (VNIR), 30 m in shortwave infrared (SWIR), and 90 m in thermal infrared (TIR). The minimum revisit time interval over any given site is 16 days. Each ASTER scene covers an area of about 60 x 60 km (Table 1). The most used ASTER data product is Level 1B (radiance at sensor). Higher-level data products are produced on demand and include surface radiance corrected for atmospheric effect (2B01), surface reflectance and emissivity (2B05 and 2B04) and surface kinetic temperature (2B03). Several papers discussed the usage of ASTER data as a powerful tool for lithologic mapping and delineation of hydrothermal alteration [11-14]. The main objective of this paper is to map the alteration mineralization and/or zones as pathfinders for uranium mineralization within Elmissikat-Eleridiya younger granite that may assist in developing a uranium exploration program using ASTER imagery. This will be used as a guide for further follow-up radioelement exploration work. 2. GEOLOGIC SETTING Elmissikat-Eleridiya district represents an important example of younger granites within the Arabian Nubian Shield. It lies in the central Eastern Desert of Egypt south Qena-Safaga asphaltic road just east the boundary between the basement hills and the sedimentary cover. The study area is located between latitudes 26° 18' N and 26° 32' N and longitudes 33° 20' E and 33° 30' E covering a total exposure surface area of about 433 km2. Generally, the area is 2014 Bentham Open
70
The Open Geology Journal, 2014, Volume 8
Table 1.
Elsaid et al.
ASTER Specification of the Three Separate Instrument Subsystems ASTER Specification
ASTER consists of three separate instrument subsystems covers 14 spectral bands: 1- Visible and Near Infrared (VNIR) 2- Shortwave Infrared (SWIR) 3- Thermal Infrared (TIR) Instrument
VNIR
SWIR
TIR
Bands
b1 -b3
b4 - b9
b10 - b14
Spectral range (µm)
0.52 - 060
1.600 - 1.700
8.125 - 8.475
063 - 069
2.145 - 2.185
8.475 - 8.825
0.78 - 0.86
2.185 - 2.225
8.925 - 9.275
2.235 - 2.285
10.25 - 10.95
2.295 - 2.365
10.95 - 11.65
2.360 - 2.430 Spatial resolution
15 m
30 m
90 m
Swath width
60 km
60 km
60 km
Cross track pointing
±318 km (± 24 deg)
±116 km (± 8.55 deg)
±116 km (± 8.55 deg)
Signal Quantization level (bits)
8
8
12
Band 3 has nadir and background telescopes for stereo pairs from a single orbit. The stereo pair capability of ASTER means that detail DEMs can be produced. Orbit Information Orbit
Altitude be range
Inclination
Repeat cycle
Orbit period
Sun Synchronous Descending
700-737 km
98.2° ±0.15°
16 days
98.9 min
(705 km at equator)
characterized by rugged topography with moderate to high relief and comprises different rock types including metavolcanics, older granitoids (quartz diorite and granodiorite), younger granites (monzogranite and syenogranite), sandstones and wadi deposits. False color combination of ASTER bands 9, 8, 1 in red, green and blue channels, respectively (Fig. 1) has the highest optimum index factor (OIF) and clearly identifies the main rock units. Panchromatic images, field geologic studies and previous works [5, 15] helped in preparing a detailed geologic map (Fig. 2) of scale 1:50,000. Airborne gamma ray spectrometry revealed that the syenogranitic bodies have the highest radioactivity related to shear zones. These shear zones are usually filled with siliceous veins and veinlets showing white (milky quartz), black (smoky quartz) and red (red jasper) colors and abnormal radioactivity with visible uranium mineralization. Both the jasper and quartz veins are not equally distributed so they are denser and closely spaced in the northern granitic mass of G. Elmissikat than those at the southern mass of G. Eleridiya. Several zoned and unzoned oval-shaped and/or elongated pegmatites were recorded. They are mainly composed of quartz and K-feldspars with traces of iron oxy-hydroxides,
mica, green to violet fluorite and jasper. Along shear zones, their walls are stained with variable colors according to alteration products. The reddish brown colors are due to hematitization, faint greyish green to whitish buff color are due to kaolinization and sericitization, whereas yellowish to dark green coloration is due to epidotization and chloritization. 3. MATERIALS AND METHODS ASTER L1B product is a registered radiance at sensor data. So, several pre-processing techniques were applied on subset data covering the study area to be suitable for further image processing techniques. These pre-processing techniques include cross-talk correction of ASTER-SWIR bands, layer stacking of VNIR-SWIR bands in unique nine bands data-cube, and orthorectification of data using SRTM topographic data. Moreover, converting pixel radiance at sensor into reflectance at surface data using fast line of sight atmospheric analysis of spectral hypercubes (FLAASH) module of ENVI software and thermal atmospheric correction of ASTER-TIR emittance bands were applied. The feature oriented principal component selection (FPCS) and spectral angle mapper (SAM) are the main image processing techniques applied during the present study.
Processing of Multispectral ASTER Data for Mapping Alteration Minerals Zones
The Open Geology Journal, 2014, Volume 8 71
Fig. (1). False color composite of ASTER bands (9:R, 8:G, 1:B) discriminates the different rock units in Elmissikat – Eleridiya district.
3.1. Feature Oriented Principal Component Selection (FPCS) Multispectral images often have similar visual appearance for different bands, which cause data redundancy (high correlation between spectral bands). Principal
component analysis (PCA) is a general method of analysis by mathematical transformation of the original data which are arranged according to the axis of greatest variability for creating new non-correlated components. Therefore, PCA displays the maximum contrast from several spectral bands with just three primary display colors [16]. The number of
72
The Open Geology Journal, 2014, Volume 8
Elsaid et al.
Fig. (2). Geologic map of Elmissikat-Eleridiya district, modified after El-Mansi, 1993, Takla and Hussien, 1995 and others.
output PCs is the same as the number of the input spectral bands. PC1 concentrates features common to all input bands (usually topography) and often displays important structural information. PC2 is orthogonal to PC1 in n directional space and highlights the spectral differences between visible and the infrared spectral bands. PC3 includes the third most variability and is orthogonal to the other two PCs. As a PC is a linear combination of the original spectral bands, so its relationship to the original spectral signatures of targets is not obvious, so we used the feature-oriented principal component selection (FPCS) method for color composition [17]. The method comprises examination of the eigenvectors to identify the contributions from original bands (-ve or +ve) to each PC to select specific PCs for
displaying and concentrate the desired spectral features by highlighting them as bright or dark pixels based on their respective eigenvector values magnitudes and signs (-ve eigenvector value indicates absorption while +ve ones mean reflectance). This technique was used for mineral exploration on four and six selected bands of Landsat TM data [17-21] and on ASTER data [22]. According to the alteration products found in the study area through field, petrographic and spectrometric examinations, we select the following dominant alteration minerals: silica (opal and jasper), chlorite, kaolinite, illite and hematite. For assessing the feature oriented principal
Processing of Multispectral ASTER Data for Mapping Alteration Minerals Zones
Table 2.
The Open Geology Journal, 2014, Volume 8 73
Input Bands for FPCS (Crosta) Analysis of the Selected Minerals
Minerals
Kaolinite Chlorite Illite Hematite Quartz
VNIR-SWIR (Reflectance)
TIR (Emittance)
High
Low
High
Low
Band 3
Band 6
Band 11
Band 12
Band 7
Band 9
Band 14
Band 13
Band 1
Band 2
Band 12
Band 11
Band 5
Band 8
Band 13
Band 14
Band 1
Band 6
Band 7
Band 8
Band 5
Band 3
Band 8
Band 6
Has no characteristic spectral features
Has no characteristic spectral features in thermal region
Band 10
Band 11
Band 12
Band 14
Fig. (3). The USGS library spectra of the studied minerals superimposed on ASTER data band intervals in the VNIR-SWIR region.
component selection (FPCS) input bands, the USGS library spectra of these minerals besides quartz were superimposed on ASTER data band intervals in the VNIR-SWIR (0.4 µm – 2.5 µm). Also, the Johns Hopkins University (JHU) spectral library was used for TIR (8 – 12 µm) spectral regions (Figs. 3, 4). Studying these charts helped in the selection of the four bands as input for the FPCS (Table 2). 3.2. Spectral Angle Mapper (SAM) Spectral angle mapping (SAM) technique suggested by Kruse, et al. [23], is a supervised classification depends on the angles between image pixel spectra and training data (ROIs) or library spectra of selected end-members. The
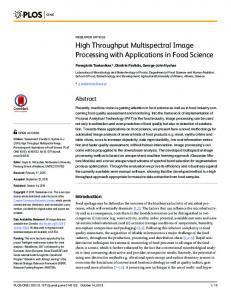
algorithm determines the similarity between two spectra by calculating the spectral angle between them (Fig. 5). According to vector algebra, the angle between two vectors r and t is defined as:
⎡ ⎛ t ⋅r ⎞ −1 ⎢ α = cos ⎜ Or α = cos ⎢ ⎝ t ⋅ r ⎟⎠ ⎢ ⎣ −1
∑
m
tr
i=1 i i 1/2 m 2 1/2 m 2 i i i=1 i=1
(∑ t ) (∑ r )
⎤ ⎥ ⎥ ⎥ ⎦
where m is the number of spectral bands and the value range of α is 0 – π The SAM output is a classified image whose pixel values represent the alpha (α) angle in radians, which is measured
74
The Open Geology Journal, 2014, Volume 8
Elsaid et al.
Fig. (4). The JHU library spectra of the studied minerals superimposed on ASTER data band intervals in the TIR region.
from the reference spectrum for each class, this is besides a set of rule images is produced (one per end-member), which is inversely related to the degree of spectral similarity calculated by SAM. These rule images could be used to produce RGB false color composites in order to highlight the surface distribution of hydrothermal alteration zones.
University (JHU) spectral libraries then resampled to ASTER spectral resolution (Fig. 6). The applied maximum angles for ASTER VNIR-SWIR and ASTER-TIR bands are listed in the (Table 3), and were selected according to field determinations, and used as threshold spectral angle of each end-member mineral; as lower spectral angles represent better matches to the end-member spectra [24]. 4. RESULTS 4.1. Feature Oriented Principal Component Selection (FPCS) Kaolinite: Mapping of kaolinite is carried out using ASTER bands 3, 7, 6 and 9 in VNIR-SWIR spectral region and bands 11, 14, 12 and 13 in TIR. This is based on its high reflectances within bands 3, 7, 11 and 14, and low reflectances within bands 6, 9, 12 and 13. Entering these selected bands in a principal component analysis process produced four PCs for VNIR-SWIR bands and other four for thermal emissivity bands. The resultant eigenvector values statistics of both selected groups are summarized in (Table 4a and b).
Fig. (5). A 2D illustration of two spectral vectors (t and r) and the spectral angle (α) between them.
Spectral angle mapping was applied on the normalized spectral data of the selected hydrothermal alteration minerals (sericite, chlorite, hematite, illite, kaolinite and quartz) from NASA's Jet Propulsion laboratory (JPL) and Johns Hopkins
Eigenvector statistics of input VNIR-SWIR bands reflects that PC3 shows a high negative loading from band 6 (-0.795) and a high positive loading from band 9 (0.576) this indicates that kaolinite mineralization will appear as bright pixels as the high negative loading matched with absorption feature at band 6, while the high positive loading matches with reflectance feature at band 9. Thresholding process was carried out on PC3 to exclude kaolinite lower concentrations by using the following equation: Band DN Threshold = Mean + 2*(Standard deviation) =137.40 + 2*(53.67) = 244.74 equation (1)
Processing of Multispectral ASTER Data for Mapping Alteration Minerals Zones
The Open Geology Journal, 2014, Volume 8 75
Fig. (6). Resampled to ASTER end-member minerals spectra used in SAM classification using JPL spectral library for VNIR-SWIR spectral region (left) and JHU spectral library for TIR one (right). Dotted lines represent ASTER bands wavelength centers. Table 3.
mineralization anomalies as red pixels. On the other hand, the eigenvector statistics of input thermal bands revealed that PC3 has a high negative loading from band 13 (-0.825) and high positive loading from band 14 (0.511); this suggests that kaolinite mineral will appear as bright pixels in PC3. After thresholding DN values (threshold DN value = 233.33) kaolinite will represented by red pixels (Fig. 7b). The resulted kaolinite anomalies form FPCS on selected VNIRSWIR bands are most abundant and clearer than that of thermal emissivity selected bands. This is due to the high spatial resolution of VNIR-SWIR bands compared with noisy coarse resolution in thermal emissivity bands.
Matching Maximum Angles (Radians) Used in SAM Classification for ASTER Bands of El Missikat – El Eridiya Syenogranite
End-Member
Maximum Angle (Radians) VNIR-SWIR
TIR
Sericite
0.150
0.363
Chlorite
0.100
0.225
Hematite
0.100
0.282
Illite
0.080
0.230
Kaolinite
0.230
0.406
Quartz
0.135
0.576
Chlorite: As chlorite has a remarkable high reflectance in bands 1 and 5 besides low reflectances in bands 2 and 8 in the VNIR-SWIR spectral region; these four bands are used as input bands in FPCS process producing four PCs with
The resulted image (Fig. 7a) shows the kaolinite
Table 4a. Eigenvector Values for Selected VNIR-SWIR ASTER Bands for Kaolinite (Red Upward Arrow Means Reflectance and Blue Downward Ones Mean Absorbtance) within Elmissikat-Eleridiya Syenogranite PC
Band 3↑
Band 6↓
Band 7↑
Band 9↓
Eigen Value
Eigen %
PC1
0.486
0.499
0.509
0.506
23934.77
97.92
PC2
0.873
-0.273
-0.245
-0.322
390.54
1.60
PC3
0.016
-0.795
0.190
0.576
77.17
0.32
PC4
-0.046
-0.212
0.803
-0.555
41.50
0.17
Table 4b. Eigenvector Values for Selected Thermal Emissivity ASTER Bands for Kaolinite within Elmissikat-Eleridiya Syenogranite PC
Band 11↑
Band 12↓
Band 13↓
Band 14↑
Eigen Value
Eigen %
PC1
0.497
0.524
0.501
0.477
29160.71
96.65
PC2
0.463
0.457
-0.258
-0.714
604.64
2.00
PC3
0.119
0.210
-0.825
0.511
316.50
1.05
PC4
0.724
-0.687
-0.042
0.046
90.63
0.30
76
The Open Geology Journal, 2014, Volume 8
Elsaid et al.
b
a
Fig. (7). (a) Resulted PC3 kaolinite image using FPCS (Crosta) technique for the input VNIR-SWIR bands applied on Elmissikat-Eleridiya syenogranite. Magenta pixels represent kaolinite anomalies. (b) Resulted PC3 kaolinite image using FPCS (Crosta) technique for the input thermal emissivity bands applied on Elmissikat-Eleridiya syenogranite. Magenta pixels represent thresholded kaolinite anomalies.
their eigenvector statistics shown in (Table 5a). PC4 has high opposite signed loadings for band 2 (-0.713) and band 1 (0.606), so chlorite will appear as bright pixels. After thresholding DN value (= 231.42), the resultant image represents chlorite mineral as green (Fig. 8a). On the other hand, the same operations were carried out on the thermal emissivity bands using highly emittance bands 12 and 13 besides low emittance bands 11 and 14 as input bands. The following (Table 5b) represent the resulted PCs besides the eigenvector statistics in which PC3 has high negative loading in band 13 (-0.825) and a low positive loading in band 14 (0.511). This suggests the presence of chlorite as dark pixels. Negation, resampling to gray scale 8-bit and thresholding DN values (threshold DN value = 240) represent chlorite as green pixels in the PC3 image (Fig. 8b).
four PCs where their eigenvectors are shown in (Table 6). There are two opposite signed loadings within PC4 in band 7 (-0.795) and in band 8 (0.571). The negative sign of band 7 (whose high reflectance) and positive sign of band 8 (whose high absorption suggest that illite will appear as dark pixels in PC4 image. Applying negation, resampling and thresholding PC4 DN values (= 246.53) resulted in mapping illite mineral as blue pixels in (Fig. 9). As illite does not imply characteristic features in TIR region, so, FPCS could not be applied. Hematite: The high reflectance of hematite at bands 5 and 8 compared to the low reflectance of bands 3 and 6 led to using these bands as input bands in FPCS process and producing four PCs (Table 7). PC4 has a strong negative loading with band 5 (-0.655) and a strong positive loading with band 6 (0.747); this indicates that hematite will appear as dark pixels in PC4 image. Resampling PC4 DN values then thresholding it (thresholding value = 231) to neglect lower hematite concentrations produced an image on which
Illite: Illite has a characteristic spectral signature in VNIR-SWIR spectral region with high reflectance at bands 1 and 7 besides high absorption at bands 6 and 8. So, these four bands were entered in FPCS as input data producing
Table 5a. Eigenvector Values for Selected VNIR-SWIR ASTER Bands for Chlorite within Elmissikat-Eleridiya Syenogranite PC
Band 1↑
Band 2↓
Band 5↑
Band 8↓
Eigen Value
Eigen %
PC1
0.493
0.496
0.498
0.513
23265.22
96.31
PC2
0.601
0.395
-0.419
-0.554
730.47
3.02
PC3
-0.169
0.299
-0.734
0.585
117.33
0.49
PC4
0.606
-0.713
-0.194
0.296
42.44
0.18
Processing of Multispectral ASTER Data for Mapping Alteration Minerals Zones
The Open Geology Journal, 2014, Volume 8 77
Table 5b. Eigenvector Values for Selected Thermal Emissivity ASTER Bands for Chlorite within Elmissikat-Eleridiya Syenogranite PC
Band 11↓
Band 12↑
Band 13↑
Band 14↓
Eigen Value
Eigen %
PC1
0.497
0.524
0.501
0.477
29160.71
96.65
PC2
0.463
0.457
-0.258
-0.714
604.64
2.00
PC3
0.119
0.210
-0.825
0.511
316.50
1.05
PC4
0.724
-0.687
-0.042
0.046
90.63
0.30
b
a
Fig. (8). (a) Resulted PC4 chlorite image using FPCS (Crosta) technique for the input VNIR-SWIR bands applied on Elmissikat-Eleridiya syenogranite. Green pixels represent thresholded chlorite anomalies. (b) Resulted PC3 chlorite image using FPCS (Crosta) technique for the input Thermal emissivity bands applied on Elmissikat-Eleridiya syenogranite. Green pixels represent thresholded chlorite anomalies.
spectra from the spectral library can be considered equivalent to lows expected in emissivity (E) spectra [24], hence the emissivity curve of massive quartz indicates clear absorption at band 10, band 12 and indicates clear reflection spike at band 11 on the contrary. In band 13 and band 14 spectral ranges, it is changing to higher emissivity value.
hematite is mapped as red pixels (Fig. 10). As illite, hematite lacks distinct spectral features in ASTERTIR region; so, Crosta FPCS technique was not applied here. Silica: Silica (quartz) has no significant spectral signature in VNIR-SWIR region where it has characteristic emissivity values within the TIR spectral region. Under most conditions, the infrared portion can be used to calculate emissivity using Kirchhoff’s Law (E=1-R), i.e. highs in the reflectance (R) Table 6.
Eigenvector Values for Selected VNIR-SWIR ASTER Bands for Illite within Elmissikat-Eleridiya Syenogranite PC
Band 1↑
Band 6↓
PC1
0.477
0.500
PC2
0.873
-0.184
PC3
0.100
-0.822
PC4
0.023
0.203
Band 7↑
Band 8↓
Eigen Value
Eigen %
0.509
0.513
23835.61
96.85
-0.278
-0.357
662.09
2.69
0.175
0.533
88.41
0.36
-0.795
0.571
24.51
0.10
78
The Open Geology Journal, 2014, Volume 8
Elsaid et al.
positive loading at band 11 (0.794) hence the quartz anomalies will appear as bright pixels in PC5 image. Thresholding DN values (thresholding value = 231.51) for neglecting lower concentrations gives quartz anomalies as cyan areas (Fig. 11). PC3 may be informative to differentiate quartz-rich rocks as grayish and dark pixels as it contains high negative loading in band 13 (-0.781) and a positive loading in band 10 (0.355).
Fig. (9). Resulted PC4 Illite image using FPCS (Crosta) technique for the selected input VNIR-SWIR bands applied on ElmissikatEleridiya syenogranite. Blue pixels represent thresholded illite anomalies.
These five thermal bands are used as input data in Crosta technique producing their own PCs and eigenvectors (Table 8) which reveals that the PC1 is composed of positive loadings of all total bands and has 96.59% (eigenvalue) of the spectral information. To enhance quartz-rich rocks we select PC5 as it has high negative loading at band 12 (-0.493) and high Table 7.
Fig. (10). Resulted PC1 hematite image using FPCS (Crosta) technique for the input VNIR-SWIR bands applied on ElmissikatEleridiya syenogranite. Red pixels represent Hematite anomalies.
Eigenvector Values for Selected VNIR-SWIR ASTER Bands for Hematite within Elmissikat-Eleridiya Syenogranite PC
Band 3↓
Band 5↑
Band 6↓
Band 8↑
Eigen Value
Eigen %
PC1
0.487
0.497
0.501
0.514
23769.99
97.75
PC2
0.872
-0.287
-0.304
-0.253
388.54
1.60
PC3
-0.035
-0.491
-0.313
0.812
127.56
0.52
PC4
0.014
-0.655
0.747
-0.108
31.41
0.13
Table 8.
Eigenvector Values for Selected Thermal Emissivity ASTER Bands for Quartz within Elmissikat-Eleridiya Syenogranite Band 10↓
Band 11↑
Band 12↓
Band 13↑
Band 14↑
Eigen Value
Eigen %
PC 1
0.423
0.451
0.476
0.453
0.432
35463.26
96.59
PC 2
0.272
0.404
0.361
-0.361
-0.709
642.83
1.75
PC 3
0.355
-0.004
-0.035
-0.781
0.513
344.86
0.94
PC 4
0.715
-0.049
-0.631
0.227
-0.191
195.30
0.53
PC 5
-0.333
0.794
-0.493
-0.063
0.106
70.57
0.19
Processing of Multispectral ASTER Data for Mapping Alteration Minerals Zones
The Open Geology Journal, 2014, Volume 8 79
4.2. Spectral Angle Mapper (SAM) SAM classification method succeeded in determining the alteration minerals both in VNIR-SWIR and TIR spectral regions with different magnitudes of accuracy. The ability of this method is directly affected by the spectral and/or spatial resolution. A good detection at minor maximum angle (α) of VNIR-SWIR nine bands with finer spatial resolution (pixel size about 30 x 30m) when compared with that of TIR five bands with coarse spatial resolution (pixel size about 90 x 90m) has been recorded. An additional important factor is the specific spectral characteristics of each end-member within the spectral region. This is clearly found with quartz (tectosilicate) which has been detected in TIR region more accurately than in VNIR-SWIR as silica implies a distinctive high emittance in ASTER-TIR band. (Figs. 12a, b, 13a, b, 14a, b, 15a, b, 16a, b, 17a, b) represent the separated sericite, kaolinite, chlorite, illite, hematite and quartz endmembers respectively after SAM classification carried out on VNIR-SWIR stack and on TIR stack. 5. CONCLUSIONS
Fig. (11). Resulted PC5 quartz image using FPCS (Crosta) technique for the input thermal emissivity bands applied on Elmissikat-Eleridiya syenogranite. Cyan pixels represent thresholded quartz anomalies.
a
The feature oriented principal component selection (FPCS) technique succeeded in highlighting characteristic spectral features of the common alteration minerals associating radioactive mineralization in ElmissikatEleridiya district. It maps kaolinite and illite using ASTER VNIR-SWIR-TIR data, illite and hematite using ASTER VNIR-SWIR data, and silica using ASTER-TIR according to the specific absorption features of each mineral.
b
Fig. (12). (a) Separated SAM classification end-member (Sericite) using VNIR-SWIR stack and the USGS ASTER resampled spectral library applied on Elmissikat-Eleridiya syenogranite. (b) Separated SAM classification end-member (Sericite) using ASTER TIR stack and the JHU ASTER resampled spectral library applied on Elmissikat-Eleridiya syenogranite.
80
The Open Geology Journal, 2014, Volume 8
Elsaid et al.
a
b
Fig. (13). (a) Separated SAM classification end-member (Kaolinite) using VNIR-SWIR stack and the USGS ASTER resampled spectral library applied on Elmissikat-Eleridiya syenogranite. (b) Separated SAM classification end-member (Kaolinite) using ASTER TIR stack and the JHU ASTER resampled spectral library applied on Elmissikat-Eleridiya syenogranite.
a
b
Fig. (14). (a) Separated SAM classification end-member (Chlorite) using ASTER VNIR-SWIR stack and the USGS ASTER resampled spectral library applied on Elmissikat-Eleridiya syenogranite. (b) Separated SAM classification end-member (Chlorite) using ASTER TIR stack and the USGS ASTER resampled spectral library applied on Elmissikat-Eleridiya syenogranite.
Processing of Multispectral ASTER Data for Mapping Alteration Minerals Zones
a
The Open Geology Journal, 2014, Volume 8 81
b
Fig. (15). (a) Separated SAM classification end-member (Illite) using ASTER VNIR-SWIR stack and the USGS ASTER resampled spectral library applied on Elmissikat-Eleridiya syenogranite. (b) Separated SAM classification end-member (Illite) using ASTER TIR stack and the USGS ASTER resampled spectral library applied on Elmissikat-Eleridiya syenogranite.
a
b
Fig. (16). (a) Separated SAM classification end-member (Hematite) using ASTER VNIR-SWIR stack and the USGS ASTER resampled spectral library applied on Elmissikat-Eleridiya syenogranite. (b) Separated SAM classification end-member (Hematite) using ASTER TIR stack and the USGS ASTER resampled spectral library applied on Elmissikat-Eleridiya syenogranite.
82
The Open Geology Journal, 2014, Volume 8
Elsaid et al.
b
a
Fig. (17). (a) Separated SAM classification end-member (Quartz) using ASTER VNIR-SWIR stack and the USGS ASTER resampled spectral library applied on Elmissikat-Eleridiya syenogranite. (b) Separated SAM classification end-member (Quartz) using ASTER TIR stack and the USGS ASTER resampled spectral library applied on Elmissikat-Eleridiya syenogranite.
On the other hand, spectral angle mapper (SAM) techniques succeeded in mapping alteration minerals; sericite, kaolinite, chlorite, illite, hematite and silica using ASTER L1B data. VNIR-SWIR bands have higher spatial and spectral resolution than TIR bands giving more obvious and/or accurate delineation of alteration minerals when applying FPCS or SAM techniques. The resulted alteration minerals maps (especially silica) nearly coincide with radioactive anomalies and could be used as pathfinders for new uranium exploration sites within the study area.
[3] [4] [5] [6] [7] [8]
CONFLICT OF INTEREST The authors declare that there are no conflicts of interest. [9]
ACKNOWLEDGEMENTS The authors thank Photogeology Department, Nuclear Materials Authority for facilitating image processing methods. REFERENCES [1] [2]
Bentor YK. The crustal evolution of the Arabo-Nubian massive with special reference to the Sinai Peninsula. Precambrian Res 1985; 28: 1-74. Kröner A. Ophiolites and evolution of tectonic boundaries in the Late-Proterozoic Arabian-Nubian Shield of the Northeast Africa and Arabia. Precam Res 1985; 27: 277-300.
[10] [11] [12] [13] [14]
Stern RJ, Hedge CE. Geochronological and isotopic constraints on Late-Precambrian crustal evolution in the Eastern Desert of Egypt. Am J Soc 1985; 285: 97-127. El Gaby S, List FK, Tehrani R. The basement complex of the Eastern Desert and Sinai, In: Said R, Ed. The Geology of Egypt, Balkema-Rotterdam-Bookfield, Holland 1990; pp. 175-84. Takla MA, Hussein AA. Shield rocks and related mineralizations in Egypt. 11th Sym Precamb Develop, Cairo, Abst. 1995; 6-7. Akaad M K, Noweir A M, Abu Ela A M. Geology of the PanAfrican Basement Rocks of the Jabal Hadid-Wadi Mubarak district, Eastern Desert, Egypt. Geol Surv Cairo 1996; 73: 8. Ragab A I, El Alfy Z. Arc-arc collision model and its implications on proposed classifications of the Pan-African rocks of the Eastern Desert of Egypt. Earth Sci 1996; 89-101. Johnson PR, Andresen A, Collins AS, et al. Late Cryogenian– Ediacaran history of the Arabian–Nubian Shield: A review of depositional, plutonic, structural, and tectonic events in the closing stages of the northern East African Orogeny. J Afr Earth Sci 2011; 61(3): 167-232. Church WR. Precambrian evolution of the Afro-Arabian crust from ocean arc to craton; Discussion. Geol Soc Am Bull 1983; 94: 67981. Hassan M A, Hashad AH. Precambrian of Egypt. In: Said R, Ed. The Geology of Egypt. Balkema, Rotterdam 1990; pp. 201-45. Di Tomasso I, Robenstein N. Hydrothermal alteration mapping using ASTER data in the Infiernillo porphyry deposit, Argentina. Ore Geol Rev 2007; 32: 275-90. Azizi H, Tarverdi MA, Akbarpour A. Extraction of hydrothermal alterations from ASTER SWIR data from east Zanjan, northern Iran. Adv Space Res 2010; 46: 99-109. Pour AB, Hashim M. The application of ASTER remote sensing data to porphyry copper and epithermal gold deposits. Ore Geol Rev 2012; 44: 1-9. Matar S S, Bamousa A O. Integration of the ASTER thermal infrared bands imageries with geological map of Jabal Al Hasir area, Asir Terrane, the Arabian Shield. J Taibah Uni Sci 2013; 7(1): 1-7
Processing of Multispectral ASTER Data for Mapping Alteration Minerals Zones [15] [16] [17]
[18] [19]
El-Mansi MM. Petrology, radioactivity and mineralizations of Abu Gerida El-Erediya area, Eastern Desert, Egypt. M. Sc. thesis, Faculty of Science, Cairo University, Cairo, Egypt 1993; p. 223. Vincent RK. Fundamentals of Geological and Environmental Remote Sensing: Upper Saddle River, NJ: Prentice-Hall, Inc. 1997. Crosta A, Moore J. Enhancement of Landsat thematic mapper imagery for residual soil mapping in SW Minais Gerais state, Brazil: a prospecting case history in Greenstone belt terrain, in: proceedings of the Seventh ERIM Thematic Conference: Remote sensing for Exploration Geology 1989; pp. 1173-87. Loughlin WP. Principal component analysis for alteration mapping. Photogrammetric Eng Remote Sens 1991; 57: 1163-9. Ruiz-Armenta JR, Prol-Ledesma RM. Techniques for enhancing the spectral response of hydrothermal alteration minerals in thematic mapper images of central Mexico. Int J Remote Sens 1998; 19: 1981-2000.
Received: May 12, 2013
[20] [21] [22]
[23]
[24]
The Open Geology Journal, 2014, Volume 8 83 Tangestani MH, Moore F. Porphyry copper alteration mapping at the Meiduk area, Iran. Int J Remote Sens 2002, 23: 4815-26. Carranza EJM, Hale M. Mineral imaging with Landsat thematic Mapper data for hydrothermal alteration mapping in heavily vegetated terrain. Int J Remote Sens 2002; 23: 4827-52. Crosta A P, Souza Filho CR, Azevedo F, Brodie C. Targeting key alteration minerals in epithermal deposits in Patagonia, Argentina, using ASTER imagery and principal component analysis. Int J Remote Sens 2003; 23: 4233-40. Kruse FA, Boardman JW, Lefkoff AB. The spectral image processing system (SIPS) – interactive visualization and analysis of imaging spectrometer data. Remote Sens Environ 1993; 44: 14563. ENVI 5.0 Users' Manual, 2012.
Revised: November 18, 2013
Accepted: February 4, 2014
© Elsaid et al.; Licensee Bentham Open. This is an open access article licensed under the terms of the Creative Commons Attribution Non−Commercial License (http://creativecommons.org/licenses/bync/3.0/) which permits unrestricted, non−commercial use, distribution and reproduction in any medium, provided the work is properly cited.