Post-Print Version The final publication is available at Springer via http://dx.doi.org/10.3182/20120523-3-RO-2023.00083
Product state based view and machine learning: A suitable approach to increase quality? C. Irgens*, T. Wuest**, K.-D. Thoben** * University of Strathclyde, Glasgow, G1 1XQ, UK (Tel: +44 (0)77 6748 6748; e-mail:
[email protected]). **Bremer Institut für Produktion und Logistik GmbH (BIBA), Bremen, 28359, Germany (Tel: +49 (0)421 218 5540; e-mail:{wue tho}@biba.uni-bremen.de). Abstract: Increasing market demand towards higher product and process quality and efficiency forces companies to think of ways to optimize their production. In the area of high-tech manufacturing products even slight variations of the product state during production can lead to costly and time-consuming rework or even scrap parts. Describing an individual products state along the whole manufacturing process including all relevant information involved for utilization in e.g. in-process adjustments of parameters can be one way to stay competitive. Ideally the gathered information can be directly analyzed and in case of an identified critical trend or event, adequate action, like an alarm, can be triggered. Within this paper, the possibility to generate such a system by using cluster analysis and supervised machine learning on product state data along manufacturing processes will be assessed. Finally, the question will be answered, if this concept is a promising approach to increase quality. Keywords: Products, State, Data, Manufacturing, Process, Cluster Analysis, Supervised Machine Learning, Requirements
1. INTRODUCTION Increasing market demand and customer requirements towards higher product and process quality and efficiency (Kovacic & Sarler, 2009) forces companies to think of ways to optimize their production. At the same time, high-tech engineering products become more and more optimized (e.g. gear wheels for offshore wind turbines) exploiting most of the achievable product properties. Facing these trends, manufacturing companies have to deal with increased complexity within their manufacturing and business processes. But in the end, the quality of a product is directly influenced by the quality of the production processes (Brinksmeier, 1991). Especially during the production of engineering products with a high value add rework and scrap due to problems within the processes can not only be very costly but also damage the reputation of a company within a distributed production network. One lever to increase the quality of products and processes is to carefully track every individual product along the chain and adjust the process parameters based on current information accordingly. To be able to do that, first it has to be known what information and data needs to be gathered, how it can be structured and finally, how applied with maximal impact. At the same time, tracking and tracing of individual products itself is challenging especially in manufacturing. The specific situation, concerning product, e.g. company and environment, has to be carefully assessed if such a concept makes economic sense and is technically feasible (Wuest, Klein, Seifert & Thoben, 2011a). Within this paper, the advantages of a combination of the state based view and use of cluster analysis and supervised machine
learning will be presented. Through this concept, a product can be described in a structured way along the process and with the analytical power of machine learning theory, whenever a product’s state shows too much variation an adequate action can be triggered. In the following first an introduction to the concept and advantages of a product state based view will be given. Followed by a section on how cluster analysis and supervised machine learning present a possibility to handle large sets of data. In the next section, these tools are applied to the product state based view and some theoretical examples are given to make the concept more feasible. The paper concludes with a short summary of the results, limitations and an outlook on further research planed. 2. CONCEPT OF PRODUCT STATE The goal of every manufacturing process is to add value to a work piece, component or product (hereinafter the term product will be used comprehensively) with each process step. Thus, the state of the product is changed at least with every value adding process step. Through looking at the product state along the whole manufacturing process combines to a complete picture of realized measures. 2.1 Product State The concept of a product state based view describes a product at certain times during a manufacturing process or after through a combination of state characteristics. Being definable and ascertainable measures, state characteristics can be described in a quantitative or qualitative way. The state of a product changes due to external influence, for example
W-190
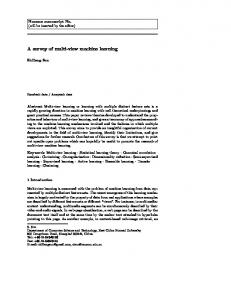
machining or corrosion from one point in time to another when at least one descriptive state characteristic changes (Wuest, Klein & Thoben, 2011). Within this concept, it is inalienable to identify information with an impact on the individual product and process to create a set of relevant state characteristics. 2.2 Product State in Manufacturing Processes Taking into consideration that manufacturing processes are not taken out by a single company at a single location any longer but in collaboration (Seifert, 2009), including extra interfaces and interdependencies between stakeholders and processes, the need for a clear structure to identify, share/distribute and use product and process information is indispensible (Merali & Bennett, 2011). The product state based view (Wuest, Klein & Thoben, 2011; Wuest, Klein, Seifert & Thoben, 2011b; Wuest, Klein, Seifert & Thoben, 2011c) (see Fig. 1) offers various advantages for a structuring of product and process data in complex distributed manufacturing: • • •
Information/Data is not interpreted and thus exchangeable on different systems/IT-Infrastructures Information/Data is directly connected to individual product and process Information/Data is time-dependent
PPS A-1
Production Process Step (PPS) A
PPS A+1
Product X (Input-) Product State PS0(n)
(Output-) Product State PS1(n+1)
State Characteristic A0(n) State Characteristic B0(n)
State Characteristic A1(n+1)
state change
State Characteristic C1(n+1)
State Characteristic D0(n)
State Characteristic D1(n)
Checkpoint 0 X(n)
State Characteristic did not change
X(n+1) State Characteristicdid change
Checkpoint 1 X0
State Characteristicat checkpoint 0
PS1
Product state at checkpoint 1
Different types of variations occur in all manufacturing processes. Variations have in the past been typified into common cause variations consisting of the variation inherent in the process as it is designed. Common cause variation may include variations in temperature, properties of raw materials, strength of an electrical current etc; and assignable-cause variation, which happens less frequently than the first. With sufficient investigation, a specific cause, such as abnormal raw material or incorrect set-up parameters, can be found for assignable-cause variations. However, modern multi-variate systems have considerable complexity with high dimensional data (Apley & Shi, 2001; Wang & Jiang, 2009), with unknown or unclear cause-effect relationships in the process(-es) and with non-Gaussian data distributions, at times exhibiting seeming chaotic behaviour (Chou, Polansky & Mason, 1998; Borror, Montgomery & Runger, 1999; Stoumbos & Sullivan, 2002), categorical (Wang & Tsung, 2007) or mixed (categorical and numerical) variables, and numerical data with different scales of measurement. Furthermore, a monitoring technique without assumptions on the parametric forms of distributions is important in this context. Constraining the manufacturing process sequence to a set of known and desirable states as well as a set of undesirable states can provide the basis for a hybrid process monitoring and control approach which uses supervised learning together with cluster analysis which can handle the aforementioned requirements of high dimensionality, unclear or unknown cause-effect mechanisms, non-Gaussian data with various scales and types.
State Characteristic B1(n)
State Characteristic C0(n)
determine whether or not the states represent a desirable stage in the manufacturing of the product. Classical Statistical Process Control (SPC) is based upon the use of state process data. The usefulness of SPC lies in the ability to examine a process and the sources of variation in that process. Variations in the process that may affect the quality of the end product or service can be detected and corrected, thus reducing waste as well as the likelihood that problems will be passed on to the customer.
Fig. 1. Product state change during production process. During a whole distributed manufacturing process with stakeholders in different locations all contributing to the final product, the product state change, respectively the change of certain relevant state characteristics at that point in time can be valuable information for following or even previous process steps. The product state information offers the chance to adjust process parameters according to the individual product during the process itself, ideally reducing quality deviations. On the other hand, the possibility to track product state change can be used to implement an alarm system which interferes if the state changes in an unappreciated direction. 2.3 Advantages of State View Sequences of manufacturing operations and processes may be characterised by the start and end states of each operation or process. Experiential data and information are often used to
To be able to ensure that processes, in the widest sense, are under control, there are a number of fundamental questions which must be answered and acted upon: 1. What is the state of the product/process? 2. Is the state desirable? 3. Is the state ‘driven’ by parameters which can be used to influence it? 4. What can be done if the state is undesirable and persistent? 5. Is it likely that the state may change thus needing no action i.e. non-persistent? Increasing process scope and the need to monitor conditions which are dependent upon large numbers of parameters, high-dimensionality, (possibly in their 1000s) have made the above questions more difficult to answer. Such processes typically exhibit chaotic behaviour, hiding cause-effect mechanisms.
W-191
Modern data-mining mining methods such as cluster analysis and machine-learning learning methods have shown the ability to overcome problems in process, or product, product condition monitoring by handling events with very large data dimensions and without explicitly itly known cause-effect cause models and inherent state information. 3. SUPERVISED LEARNING AND CLUSTER ANALYSIS Addressing the above fundamental state classification and analysis problem, it is possible to supply answers using a combination of cluster analysis and machine learning solutions. The principle of such solutions can be expressed in Fig. 2 below. Cluster analyze conditions & typify states
Y{y1 ... yj }
Supplement state types from experiential data
X{x1 ... x k }
Input condition vectors and classify state of xi
diagram shows two complementing methods by which this thi is achieved; clustering and adjustment by user specialist. Cluster analysis or clustering is the assignment of a set of observations into subsets, or clusters, so that observations in the same cluster are similar in some sense. Clustering is a method of unsupervised learning, learning and a common technique for data analysis used in machine learning, learning data mining and pattern recognition. Clustering techniques apply when there is no class to be predicted but rather when the instances are to be divided into natural groups. These clusters presumably reflect some mechanism at work in the domain from which instances are drawn, a mechanism that causes some instances to bear a stronger resemblance to each other than they do to the remaining instances. Cluster analysis is an approach that finds structure in data by identifying natural groupings (clusters) in the data. Cluster Clust analysis in this context should be viewed as exploratory data analysis tools because they are generally used to generate, rather than test, hypotheses about data structures, structures thus in this case used to generate and iterate a learning set for use in the supervised learning process.
Analyze and monitor state population S S{s1 ... sm }
Fig.. 2. Phases of Process State Monitoring using Cluster Analysis and Supervised Learning. The light grey phase on the left side of Fig. 2 indicates a continuous creation and updating of learning data, while the darker grey phases indicate a real-time time condition data capture and state classification and analysis. The product/process condition vectors xi form a population matrix X through time such that the population X is increasing incrementally with each sample vector xi. It is assumed that xi has high dimensionality and that this sample vector is captured in real-time. 3.1 The Learning Phase
In producing obvious clusters it is possible to name them and typify the cluster characteristics in terms of the implied im process/condition states. Consequently, the biggest gains are likely in knowledge-poor knowledge environments, particularly larly when there are large amounts of unlabelled, un-classified, classified, data. Indeed clustering techniques can be viewed as a way of generating taxonomies for the classification of objects. Thus clustering is seen as useful for the generation of learning data for supervised machine learning methods. There are various clustering methods, in this context the agglomerative approach is seen as the likely best candidate. This is so because this form of cluster representation provides inter cluster relationships in terms term of similarity scores at various levels. Therefore, it is considered suitable as a basis for selection of yi instances.
Supervised learning methods display great strength in their ability to handle large amounts of high dimensionality dimensiona data quickly and reliably. The perceived cost of such methods is the requirements for learning data. The learning data is used to create a model through which the real-time real monitoring vectors xi are processed to classify the implied state. The benefit of the use of learning data is that it can easily be updated thus facilitates continuous learning. This will in turn be useful as a process changes with time through wear and tear, maintenance, increased operator skills, changes is rawraw material supply etc. In order to create the learning model it is necessary to identify characteristic data vectors and label lab these as representative for a state. This phase is the initial phase for setting up the machine learning framework,, and can subsequently be used to incorporate maturing and changing knowledge. knowledge The above
Fig. 3. Agglomerative Clustering Output showing natural cluster trees with varying similarity values. values
W-192
Fig. 3 shows a small sample population X of 27 vectors x1 - 27, each indicated as an individual line forming the tree structure on the left of the diagram. The top line showing Q1 - 26 indicate the 23 elements of each xi , that is a dimensionality of 23, while the vertical list on the right of the diagram indicate the number of the corresponding xi from 1 to 27, similar to the dendrogram below in Fig. 4.
relatively immune to the ‘curse of dimensionality’. These methods offer considerable potential and have already been used by the author in condition monitoring involving xi event vectors up to 500 dimensions (parameters per observation). Supervised machine learning is originally a linear binary classification method. It is based upon the simple classification idea that an input set of values, vector xi is assigned to a positive class if g(xi )>= 0, where: g(xi )=wt * xi + b. The vectors xi are the attribute vectors as discussed above. Given the 'dot-product' nature of the classifier, it can be used as a non-linear classifier, making it particularly flexible and useful (Kernel method). Furthermore, the binary nature of the method is easily extended to a multi-class classifier as shown below in section 5.2. Thus in summary the method serves as a non-linear, multi-class classifier.
x1
x2
x3
x4
x5
x6
Fig. 4. Cluster Dendrogram. In Fig. 4 it is clear that the populations {x1, x2}, {x3, x4, x5} and {x6} form 3 clusters, the first 2 form a separate cluster with the 2nd highest measurements of similarity. These 2 or 3 clusters could be possible candidates for providing learning vectors for 2 or 3 states.
Given the present context this is seen as particularly valuable as inter-process product states can be given a higher resolution than just {good, bad} and a resultant nuanced corrective response can be activated. Fig 5 below indicates the simple linear, binary classification principles. The classification direction is indicated as perpendicular to the class divider, the hyper-plane.
The coloured section presents a visual indication of the similarity among the vectors, furthermore, the similarity is expressed quantitatively for each level in the cluster tree separately. Such clustering information can be used to identify learning sets from the population X, so that clusters which exhibit 'extreme'/'undesirable'/'unusual' states different from the main mass of the population X can be included in a learning set for a supervised learning method. This method is useful during continuing use of the process and for each product operation so that by regular use of the cluster analysis of product state data, state knowledge can be updated through adjustments in the learning set. This phase may be run as frequently as needed to reflect the growing knowledge and/or increasing data variance. The learning set will be denoted Y from now on, consisting of the learning vectors yi . Each yi having the same format as the vectors xi except having an additional label indicating which state it represents. The population Y can be as small as 1 for each state, but it is desirable to include a higher number. 4. SUPERVISED LEARNING AND PRODUCT/PROCESS STATES Once the learning data, Y, has been established the supervised machine learning process can be employed to assess the condition state by classifying each sample vector xi. Supervised machine learning needs a small example of data vectors which typify the various types of states. Modern, recently developed, machine learning methods build on developments in computational learning theory and have attracted attention, particularly in bio-informatics applications, because of their accuracy and their ability to deal with high dimensionality data. Indeed, some appear to be
Classification direction
Fig. 5. Binary illustration of results in 2-D. 4.1 Supervised Machine Learning and Cluster Analysis applied to Process/Product State Monitoring By constraining the product and associated manufacturing processes monitoring to the observation of desirable and undesirable inter process states and step-by-step product work-in-progress states; it is clear that the use of a hybrid monitoring and diagnosis method can be formed from cluster analysis coupled to supervised machine learning. Supervised machine learning is regarded as being particularly suited for this purpose due to its reliable classification of highdimensional data and relatively cheap data processing cost for real-time or quasi real-time applications. Assuming that the outlined approach in section 3 with respect to the creation and updating of the learning data, Y, is possible, supervised machine learning can be applied successfully to determine, incrementally in real-time or quasi
W-193
real-time the process/product states at various points in the overall manufacturing route. Presently, such a system, COMPASS, has been implemented by one of the authors and is successfully used on a frequent and regular basis in a different application domain. Some output from COMPASS is shown below.
3 2 1
3
-1
2
-2
1
-3
0
-4
1 23 45 67 89 111 133 155 177 199 221 243 265 287 309 331 353 375
-1
1 23 45 67 89 111 133 155 177 199 221 243 265 287 309 331 353 375
0
Fig. 8. Process/product states vs. time (alternative 3).
-2
The above state dynamics are considered suitable candidates for research into multi-fractal analysis to determine the active or inactive states' degree of persistence.
-3 -4 -5
Fig. 6. States vs. time, showing 4 process/product states. Fig. 6 shows state analysis done using supervised learning methods, over approx 380 samples’, xi , worth of process data. The curves show 4 states and how these states wax and vane with time. A state’s curve above the horizontal axis indicates an active state. When more than one curve is above the x-axis it indicates ‘gray zone/transition zone’. The y axis indicates the strength of the state, the x-axis indicates the xi. 3
Careful use of the learning data Y, the real-time observed product/process data X together with applied cluster analysis such as outlier score computation, can produce a probability model showing which observed individual process/product parameters, or vector elements of xi, seem to be driving the state dynamics. 0,6 0,4 0,2 0 -0,2
2
-0,4
1
-0,6 -0,8
0
-1
1 24 47 70 93 116 139 162 185 208 231 254 277 300 323 346 369 392
-1
1 4 7 1013161922252831343740434649525558
Fig. 9. Importance of individual process/product parameters in the state dynamics.
-2 -3 -4
Fig. 7. Process/product states vs. time (alternative 2). Fig. 7 is the same type as Fig. 6, but shows a potential sudden state change situation around vector 75, x75. It did not materialise. The present system, COMPASS, would indicate this with a clear signal that this situation was probably abnormal/unclear. Again, Fig. 8 is similar to Fig. 7 and 6, but shows interesting observations of the first differential at approx x294 and x341 as states 2, violet, and 3, green, did not recur after that time. It is considered possible to use this in further analysis.
Fig. 9 shows a small example of 59 different event parameters analysed to find which are currently 'drivers' for a specific process/product state. The greater the value, the stronger the 'driver'. This type of information could assist in the diagnosis of the actual state and its corrective action and as such would be important. 4.2 Data Requirements There are a few assumptions that form the data collection for the successful construction and use of a hybrid product/process monitoring system:
W-194
1. The partitioning of the whole manufacturing process into a sequence of processes, each process responsible
for the product states of each manufacturing step. The product state is thus the proxy measurement for the process state, 2. the population of product states and consequently process states by proxy, is characterised by high dimensionality and cause-effect mechanisms are not fully known or understood, 3. there is variability present at least due to variability in product raw-material and process changes, 4. collection of data across a wide spectrum of product and process information is possible. Given these assumptions, regular state data should be collected from the product manufacturing stages. Given that cause-effect mechanisms between multi-variate process data and the product states are largely unknown, it is considered necessary to collect process information. The wider this collection can be made the richer the ability of the clustersupervised machine learning and analysis method can be made. 6. CONCLUSIONS In this paper, first the concept of describing a manufacturing product through its product state along the whole (distributed) manufacturing chain was presented (product state view). Then cluster analysis and a supervised machine learning method, were introduced as promising tools to handle large amounts of data. Finally, combining the two parts, the possibility of using the aforementioned methods with product state based data was elaborated on and some examples of state changes during manufacturing over time were given on a theoretical basis. In conclusion, the approach on using cluster analysis and machine learning on product state data as an option to increase quality is very promising. In a next step, the approach will be developed in more detail and a proper application domain will be identified. An exemplary manufacturing process will be analysed and based on real life product state data the theoretically described steps will be put to the test. ACKNOWLEDGEMENTS
Chou, Y., Polansky, A. & Mason, R. (1998). Transforming Non-Normal Data to Normality in Statistical Process Control. Journal of Quality Technology, 30(2), pp. 133– 141. Kovacic, M. & Sarler, B. (2009). Application of the Genetic Programming for Increasing the Soft Annealing Productivity in Steel industry. Materials and Manufacturing Processes, (24), pp. 369-374. Merali, Y. & Bennet, Z. (2011). Web 2.0 and Network Intelligence, p. 11 – 26. In: Warren, P., Davies, J. & Simperl E. (Eds.). (2011). Context and Semantics for Knowledge Management. Heidelberg Berlin: Springer Verlag. Seifert, M. (2009). Collaboration Formation in Virtual Organisations by applying prospective Performance Measurement. Dissertation at the University of Bremen, Bremer Schriften zur Integrierten Produkt- und Prozessentwicklung. Stoumbos, Z. & Sullivan, J. (2002). Robustness to NonNormality of the Multivariate EWMA Control Chart. Journal of Quality Technology, 34(3), pp. 260–276. Wang, K. and Tsung, F. (2007). Run-to-Run Process Adjustment Using Categorical Observations. Journal of Quality Technology, 39(4), pp. 312–325. Wuest, T., Klein D., Seifert, M., Thoben, K.-D. (2011a). Challenges for grown engineering SMEs with a diverse product portfolio on information management and product tracking and tracing. Proceedings of the APMS 2011 International Conference of Advances in Production Management Systems, September 26 September 28, 2011, Stavanger, Norway. Wuest, T., Klein, D., Seifert, M. & Thoben, K.-D. (2011b). Der Werkstückzustand im Informationsmanagement. PRODUCTIVITY Management, 2(2011), pp. 26-28. Wuest, T., Klein, D., Seifert, M. & Thoben, K.-D. (2011c). Method to Describe Interdependencies of State Characteristics Related to Distortion. In Zoch, H.-W. and Lübben, Th. (eds.), Proceedings 3rd International Conference on Distortion Engineering, 14-16. September 2011, Bremen, Germany, pp. 239-246. Wuest, T., Klein, D. & Thoben, K.-D. (2011). State of steel products in industrial production processes. Procedia Engineering, 10(2011), pp. 2220-2225.
The authors would like to thank the “Deutsche Forschungsgemeinschaft” for financial support via the funded project “Informationssystem für werkstoffwissenschaftliche Forschungsdaten” (InfoSys). REFERENCES Apley, D. & Shi, J. (2001). A Factor-Analysis Method for Diagnosing Variability in Mulitvariate Manufacturing Processes. Technometrics, 43(1), pp. 84–95. Borror, C., Montgomery, D., & Runger, G. (1999). Robustness of The EWMA Control Chart to NonNormality. Journal of Quality Technology, 31(3), pp. 309–316. Brinksmeier, E. (1991). Prozeß- und Werkstückqualität in der Feinbearbeitung. Fortschritt-Berichte VDI Reihe2: Fertigungstechnik Nr. 234. Düsseldorf: VDI Verlag.
W-195