U.S. Department of Energy. Morgantown, WV. By. David Ramey. Environmental Energy Inc. 1253 N. Waggoner Road. P.O. Box 15. Blacklick, Ohio 43004. And.
Production of Butyric Acid and Butanol from Biomass
Final Report
Work Performed Under: Contract No.: DE-F-G02-00ER86106 For: U.S. Department of Energy Morgantown, WV By David Ramey Environmental Energy Inc. 1253 N. Waggoner Road P.O. Box 15 Blacklick, Ohio 43004 And Shang-Tian Yang Department of Chemical and Biomolecular Engineering The Ohio State University 140 West 19th Avenue Columbus, Ohio 43210
– 2004 –
Table of Contents Page
Proposal Face Page ..........................................................................................................................1 Table of Contents.............................................................................................................................2 Executive Summary .........................................................................................................................3 Introduction......................................................................................................................................6 Phase II Technical Objectives and Tasks.........................................................................................9 A. Enhanced butanol production from glucose and butyrate..........................................................9 B. Development of butyric acid over-producing strains...............................................................23 C. Optimization and Scale-Up of Fibrous Bed Bioreactor ...........................................................47 D. Develop Separation Techniques for Butanol Recovery from Fermentation............................52 E. Fermentation Process Study .....................................................................................................53 F. Scale Up to a Prototype Demonstration Plant ..........................................................................54 G. Economic Feasibility................................................................................................................60 Bibliography ..................................................................................................................................64 Appendix A. Decantation Recovery Modality..............................................................................68 Appendix B. Business Plan............................................................................................................76 Appendix C. Final Demonstration of the Efficacy of BUTANOL To Replace Gasoline Gallon for Gallon ........................................................................................................................................................81
2
Executive Summary Butanol replaced gasoline gallon for gallon in a 10,000 miles trip across the United States without the need to highly modify a ’92 Buick (your existing car today). Butanol can now be made for less than ethanol and yields more Btu’s from the same corn, making the plow to tire equation positive – more energy out than it takes to make it and Butanol is much safer. Butanol when substituted for gasoline gives better gas mileage and does not pollute as tested in 10 states. Butanol should now receive the same recognition as ethanol in U.S. legislation “ethanol/butanol”. There is abundant plant biomass present as low-value agricultural commodities or processing wastes requiring proper disposal to avoid pollution problems. One example is in the corn refinery industry, which processes more than 13% of the ~9.5 billion bushels (~240 million metric tons) of corn annually produced in the U.S. to produce highfructose-corn-syrup, dextrose, starch, and fuel alcohol, and generates more than 10 million metric tons of corn byproducts that are currently of limited use and pose significant environmental problems. The abundant inexpensive renewable resources as feedstock for fermentation, and recent advances in the fields of biotechnology and bioprocessing have resulted in a renewed interest in the fermentation production of chemicals and fuels, including n-butanol. The historic acetone-butanol-ethanol (ABE) fermentation by Clostridium acetobutylicum is one of the oldest known industrial fermentations. It was ranked second only to ethanol fermentation by yeast in its scale of production, and is one of the largest biotechnological processes ever known. However, since the 1950's industrial ABE fermentation has declined continuously, and almost all butanol is now produced via petrochemical routes (Chemical Marketing Reporter, 1993). Butanol is an important industrial solvent and is a better fuel for replacing gasoline – gallon for gallon than ethanol. Current butanol prices as a chemical are at $3.00 per gallon – wholesaling in 55 gallon drums for $6.80, with a worldwide market of 1.4 billion gallon per year. The market demand is expected to increase dramatically since butanol can now be produced economically from low-cost biomass. Butanol’s application as a replacement for gasoline will outpace ethanol, biodiesel and hydrogen when its safety and simplicity of use are seen. Butanol’s application for the Department of Defense as a clean-safe replacement for batteries when used in conjunction with fuel cell technology is seen as an application for the future. Disposable canisters made of PLA that carry butanol to be reformed and used to generate electricity for computers, night vision and stealth equipment can be easily disposed of. In a typical ABE fermentation, butyric, propionic and acetic acids are produced first by C. acetobutylicum; the culture then undergoes a metabolic shift and solvents (butanol, acetone, and ethanol) are formed (Fond et al., 1985). In conventional ABE fermentations, the butanol yield from glucose is low, typically at ~15% (w/w) and rarely exceeds 25% (0.77–1.3 gallons per bushel corn respectfully). The production of butanol is also limited by severe product inhibition. Butanol at a concentration of 10 g/L can significantly inhibit cell growth and the fermentation. Consequently, butanol titers in conventional ABE fermentations are usually lower than 13 g/L. The low butanol yield and butanol concentration made butanol production from glucose by ABE fermentation uneconomical. In the past 20+ years, there have been numerous engineering attempts to improve butanol production in ABE fermentation, including using cell recycle and cell immobilization to increase 3
cell density and reactor productivity and using extractive fermentation to minimize product inhibition. Cell immobilization benefits ABE fermentation by increasing cell density and producing cell-free product streams that are easier for product recovery. Also, extractive fermentation with in-situ butanol removal from the fermentation broth has been shown to improve the fermentation productivity by twofold as well as butanol yield. Despite all these efforts, the best results ever obtained for ABE fermentations to date are still less than 20 g/L in butanol concentration from fermentation, 4.5 g/L/h in butanol productivity, and a butanol yield of less than 25 % (w/w) from glucose (1.29 gallons per bushel). As a direct result of this contract the ancillary products of fermentation are eliminated and therefore more sugars go towards the end product – Butanol. The high yielding butanol process (US Patent. No. 5,753,474 “Continuous Two Stage, Dual Path Anaerobic Fermentation of Butanol and Other Organic solvents Using Two Different Strains of Bacteria”) eliminates production of all the ancillary byproducts; the process uses carbohydrates to manufacture only butyric acid, which is converted to butanol in the second stage. The improvement in butanol yield, along with increasing the fermentation rate, volumetric productivity, stability and butanol tolerance by the bacteria is attributed to the fibrous-bed bioreactor –FBB (US Patent No. 5,563,069 “Extractive Fermentation Using Convoluted Fibrous Bed Bio-reactor”) and has surpassed all expectations. The efficacy of the FBB reactor and the dual path fermentation gave a maximum yield of 49% (2.5 gallons per bushel), Volumetric Productivity of 30g/l/h, at a Dilution Rate of 3.5/h. Estimated cost of production is $0.15 per pound ($1.07/gallon) butanol. This approaches a theoretical maximum yield of 2.8 gallons butanol per bushel corn possible. This increases the Btu’s derived from a bushel of corn by 25% when compared to ethanol. More energy out for less costs. In an effort to solve another environmental problem EEI is approaching the cheese industry to deal with the whey lactose disposal. Lactose is an ideal source of sugar for the first microbe used to convert sugar to butyric acid and is the bane of the industry. Clostridium tyrobutyricum loves lactose and causes cheese wheels to “blow out”. By using this source of sugar, that has been Ultra High Filtered to remover butter fat and proteins, we eliminate the cost of corn overhead (40% typical in ethanol processes) each year, eliminate 23% the cost of material handling equipment to process corn and the costs of operations of the material handling system, all of which leads to butanol being produced for $0.08 per pound on Whey Permeate ($0.54 per gallon butanol). To demonstrate the gallon for gallon replacement of gasoline with butanol an unmodified ’92 Buick has been driven 10,000 miles across the United States from Columbus, Ohio to California via Phoenix and back via Denver Colorado to Washington DC (July–August 2005). The butanol powered Buick gets 20-26 miles per gallon. And in 10 states E-Test facility – Butanol’s average reduction of Hydrocarbons was 95%, Carbon monoxide to 97%, Oxides of Nitrogen by 27% and had a background of only 14.7% Carbon Dioxide. Commercialization of this new technology will have a profound impact on this Nations energy policy, has the propensity to reduce our Nation’s dependence on foreign oil and protect the fuel generation from sudden disruption by disseminating production of fuel throughout the country’s bio-belt instead of being centralized along coastal regions of the United States. It will take years
4
before butanol is seen in gasoline as ethanol is today because of the endless testing that has to be done. Many jobs will be created from this action. However Butanol’s first market is not as fuel but as an industrial solvent where it sells for 2.5 to 3 times the price of gasoline and is the entry point for Environmental Energy Inc. However Butanol’s local distribution to the fuels market may prove to be more efficacious and cost effective when considering the ease of distribution to existing vehicles of environmentally conscious consumers who also want a solution to the ever rising prices at the pump. This will eliminate the costs of distribution and material handling which is required by the Industrial Commodity Market – rail cars, barges, logistics etc.. Local farmers will supply fuel to local customers – a Value Added product circulating local money several times within the community. The summary business plan for Phase III is contained in Appendix 1. As we approached commercialization many sources of advice were taken and it was pointed out that Environmental Energy is a great “Home Run” but has no exit strategy - how do you get to first base. First base is the ability for investors to invest and have a 5-6 year exit strategy with a profit. To this end Environmental Energy developed a sister company (ChemLac) which deals with the cheese industry and uses lactose as a feedstock along with various EEI’s technology and Know-How to produce various acids, solvents, esters and of course butanol from the research carried out by this DOE/STTR grant. ChemLac Inc was formed in 2004 and is the vehicle to show a healthy profit and exit point. We found that our primary Agribusiness contacts wanted our technology and Know-How to make propionic acid and ammonium propionate. This association with Agribusiness #1 will allow us to stage our pre-commercial scale-up of the work by using a single reactor with a different microbe to produce the propionic acid and ammonium propionate. Agribusiness #2 is in negotiations and desires our fumaric acid work and that again uses a single FBB reactor. Both these opportunities allow EEI to enter commercialization of the butanol steam in an orderly manner and allow us to sell our pre-commercial scale units 2-5 million gallons of butanol per year to the cheese industry. Since most cheese manufactures produce 2-5 million pounds of whey per day it is an ideal size which can be scaled to their purposes. 30-50 million gallons per year biorefineries to produce butanol have the advantage of several small facilities to make any major changes in before investing in larger plants as is seen in the refining industry. Environmental Energy has established a web site which has helped find and qualify interested parties and began the long educational effort to raise public awareness that butanol replaces gasoline. Visit: www.butanol.com and the Cross-Country Trip Diary http://360.yahoo.com/dramey756
5
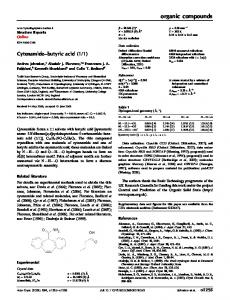
Introduction Butanol replaced gasoline gallon for gallon in a 10,000 miles trip across the United States without the need to highly modify a ’92 Buick (your existing car today). Butanol can now be made for less than ethanol and yields more Btu’s from the same corn, making the plow to tire equation positive – more energy out than it takes to make it and Butanol is much safer. Butanol when substituted for gasoline gives better gas mileage and does not pollute as tested in 10 states. Butanol should now receive the same recognition as ethanol in U.S. legislation “ethanol/butanol”. There is abundant plant biomass present as low-value agricultural commodities or processing wastes requiring proper disposal to avoid pollution problems. One example is in the corn refinery industry, which processes more than 13% of the ~9.5 billion bushels (~240 million metric tons) of corn annually produced in the U.S. to produce highfructose-corn-syrup, dextrose, starch, and fuel alcohol, and generates more than 10 million metric tons of corn byproducts that are currently of limited use and pose significant environmental problems. The abundant inexpensive renewable resources as feedstock for fermentation, and recent advances in the fields of biotechnology and bioprocessing have resulted in a renewed interest in the fermentation production of chemicals and fuels, including n-butanol (Durre, 1998; Somrutai et al, 1996; Claassen et al, 1999). The acetone-butanol-ethanol (ABE) fermentation by Clostridium acetobutylicum is one of the oldest known industrial fermentations. It was ranked second only to ethanol fermentation by yeast in its scale of production, and is one of the largest biotechnological processes ever known. However, since the 1950's industrial ABE fermentation has declined continuously, and almost all butanol is now produced via petrochemical routes (Chemical Marketing Reporter, 1993). Butanol is an important industrial solvent and potentially a better fuel extender than ethanol. Current butanol prices as a chemical are at $3.50 per gallon with a worldwide market of 1.4 billion gallon per year. The market demand is expected to increase dramatically if butanol can be produced economically from low-cost biomass (Durre, 1998). In a typical ABE fermentation, butyric and acetic acids are produced first by C. acetobutylicum; the culture then undergoes a metabolic shift and solvents (butanol, acetone, and ethanol) are formed (Fond et al., 1985). Figure 1 shows the metabolic pathways in ABE fermentation. Increasing butyric acid concentration to >2 g/L and decreasing the pH to 40% (w/w) can be expected, which is almost 100% higher than that from conventional ABE fermentations. The new process also allows both bacteria to work under their respective optimal pH and temperature conditions, and thus increased reactor productivity to 8 - 15 g/L/h, especially when extractive fermentation was used to remove butanol from the bioreactor. Figure 2 illustrates such a two-step fermentation process for butanol production from glucose. A small amount of glucose is also provided along with butyrate to the second fermentation to provide the needed energy source for the bacteria; butyrate does not serve as a good energy source for the bacteria. Using immobilized cells and maintaining the cells in the stationary (solventogenesis) phase minimized the energy consumption by the cells. The concept feasibility of this two-step fermentation was evaluated in Phase I, and the process was further studied and optimized in Phase II. The extraction methods for butanol separation and extractive fermentation were investigated in Phase II.
Butanol Production from Starch/Glucose Using a Two-Step Fermentation Process Butyric acid
Butanol
Immob. Cell Reactor
Butanol
Recovery unit
Starch / Glucose
Figure 2. A two-step fermentation process to convert glucose to butyrate and then to butanol. This project is a joint effort between Environmental Energy Inc. (EEI) and The Ohio State University (OSU). We are applying OSU's U.S. Patent 5,563,069 “Extractive Fermentation Using Convoluted Fibrous Bed Bio-reactor” and EEI's U.S. Patent 5,753,474 “Continuous Two Stage, Dual Path Anaerobic Fermentation of Butanol and Other Organic Solvents Using Two Different Strains of Bacteria” for economical production of butanol from biomass. Bacteria that express a solventogenesis phase physiology, such as C. acetobutylicum, waste a tremendous 8
amount of available carbon (e.g., glucose) on multiple byproducts. By first going through acidogenesis (first stage) where feedstock carbohydrates are converted into multiple acids and then as the acids build up the microbe changes to solventogenesis (second stage) and begins consuming the acids to produce the correlated solvents/alcohols. The advantage of this class of microbes is that they do consume acids and produce associated solvents. EEI’s patent is based on this fermentation nature and separates the fermentation into two steps: step one converts incoming carbohydrates to one specific acid and step two converts that acid into its associated solvent/alcohol. Preliminary laboratory studies and theoretical analysis based on metabolic pathway indicated that the new process could increase butanol yield from a bushel of corn by almost 100% compared to conventional batch processes (1.3 gallons per bushel to our 2.5 gallons per bushel). The results of this Phase II contract has seen these numbers proven. One key step in the new process is the butyric acid fermentation since the major carbon loss occurs during butyric acid production. In general, the selectivity for butyrate (ratio of butyrate to total acids produced) is strongly favored at a low cell growth rate. In the Phase I study, we used OSU's proprietary fibrous-bed bioreactor (FBB) for butyric acid production to obtain the highest possible butyrate concentration and yield from glucose. The FBB has a simple, scaleable packing design for cell immobilization, and has been demonstrated for continuous long-term production of propionic acid with 100% improvements in product yield, productivity, and final product concentration over the conventional fermentation process (Yang et al., 1994; 1995). Butyric acid production from glucose by C. tyrobutyricum in an FBB gave a high yield of ~50 % (w/w) and a high butyrate concentration of >43 g/L. It has been demonstrated that the butanol yield from butyric acid in the second step fermentation using C. acetobutylicum was close to the theoretical yield of 84% (w/w). Thus, the overall butanol yield from glucose in the two-step fermentation process was increased to >40% (w/w).
Phase II Technical Objectives and Tasks A. Develop mutant strains for enhanced butanol production B. Develop metabolically engineered strains for enhanced butyric acid production from glucose and xylose C. Optimize and scale up the fibrous bed bioreactor for fermentation D. Develop separation techniques for butanol recovery from fermentation E. Demonstrate the feasibility of producing butanol from glucose using the proposed two-step continuous fermentation process F. Optimize and scale up the process to a prototype demonstration plant G. Evaluate economic feasibility
A. Enhanced butanol production from glucose and butyrate Background Since the turn of the last century Clostridium acetobutylicum has been bred, mutated and investigated. Historically, ABE fermentation produces acetone, butanol and ethanol in a 3:6:1 ratio respectively (~1.3 gallons butanol, 0.65 gallon acetone and 0.22 gallons ethanol per bushel
9
corn) with a total solvent concentration of only ~1.5% . The advancements in science have spawned a multitude of new research, since today the microbiologist can cause specific mutations to occur with genetic engineering, whereas in the past microbiologist had to strain to find the mutations and then map their advantages. As a result many mutants show an increase in butanol generation while reducing acetone and ethanol. Several strains are being studied for their application in continuous fermentation processes. More recently, Genge and Park (1993, 1994) have investigated a low acid producing Clostridium acetobutylicum B-18, and pervaporation recovery techniques, but still they produce ancillary acids and solvents. Blaschek at Champaign, Ill has raised the final concentration of butanol in corn-steep liquor -- a low-value byproduct of corn wet-milling -- from 1 percent to 2 percent, "a small change that brings a huge reduction in energy costs required to recover the butanol,". Claiming that butanol producers may return to the corn fields following this dramatic improvement in the fermentation process. Scale-up of an integrated fermentation and recovery process for commercialization of butanol is taking place at MBI, Lansing, Michigan under the direction of Ponnam Elankovan. The research centers around ATCC 55025 which falls under US Patent 5,192,673 “Mutant stain of C. acetobutylicum and process for making butanol” held by Mahendra and Jain of MBI and the recovery modality of pervaporation. Their research increases the butanol boundary values but still produces other solvents, acids and alcohols. B.K. Soni also works closely with the team and has published many important articles on butyrate uptake that are useful to our research. Meyer and Papoutsakis identified patterns of energetics and product formation kinetics back in 1989, and still much research has been done to define the switch from acidogenesis to solventogenesis and the aid nutrition plays, the importance of cell physiology. Papoutsakis and his collaborators at Northwestern and Rice University are taking genetic and metabolic engineering approaches to create new mutants with improved characteristics for butanol production. Many countries such as France, Italy, England, Japan and other nations are doing landmark research and contributing to all our goals - a Butanol economy. Still in most articles it is referred to as the acetone, butanol, and ethanol (ABE) fermentation. EEI’s process refers only to butanol for that is the product of choice and by letting the microbes create mainly butanol the process becomes attractive economically. Butanol sells for about twice as much as acetone and three times as much as ethanol, plus unlike ethanol’s early years there is a well established industrial solvent market for butanol as paint thinner. The technical feasibility of this concept has been proven in Phase I. Phase II focused on the development of butanol tolerance, characterization of an asporogenic strain, and optimization of fermentation conditions for enhanced butanol production from glucose and butyrate. Microorganism and Media C. acetobutylicum was used for the study of butanol production from glucose and butyric acid. The most commonly used strains (ATCC 4259 and 824) and one asporogenic strain (ATCC 55025) were studied. They were cultured in laboratory FBB and adapted to tolerate higher butanol and butyrate concentrations. The same basic medium was used for all strains studied, with the following composition (per liter of distilled water): MgCl2⋅6H2O, 1 g; SO4(NH4)2, 1.5 g; KH2PO4, 0.5 g; FeSO4⋅7H2O, 10 mg; MnSO4⋅H2O, 10 mg; CaCl2⋅2H2O, 0.15 g; yeast extract, 5 g; glucose 30 g; and vitamin solution, 10 mL. Depending on the studies, glucose may be replaced
10
with other carbon source and at different concentrations. The vitamin solution per liter contains 5 mg of thiamine-HCl; 5 mg of riboflavin; 5 mg of nicotinic acid; 5 mg of Capantothenate; 0.1 mg of vitamin B12; 5 mg of p-aminobenzoic acid; 5 mg of lipoic acid. In continuous fermentation, a modified medium with corn steep liquor as the nitrogen source was used. The growth temperature of the culture was maintained at a constant temperature (between 30 and 37ºC). The fermentation was maintained at a controlled pH level by adding NaOH or ammonia. Factors affecting ABE fermentation Two most important parameters that affect the formation of butanol are the pH condition, including both external pH and internal pH, and the concentrations of the acids (butyric and acetic) produced. During the acidogenic phase of growth, the internal pH decreases in parallel with the decrease in the external pH due to the formation of acids, but the internal pH did not go below 5.5 throughout the batch growth (Terracciano and Kashket, 1986). As the external pH varied between 5.9 and 4.3, the cells kept a constant ∆pH of 0.9 to 1.3 (Gottwald and Gottschalk, 1985). Certain levels of butyric and acetic acid concentration are essential for the induction of butanol formation (Bahl, et al., 1982; Fond, et al., 1985; Gottschalk and Morris, 1981; Holt, et al., 1984; Martin, et al., 1983; Monot, et al., 1984; Terracciano and Kashket, 1986). But due to the complicated metabolic mechanisms involved during the induction of solvent formation, the exact concentration levels required still remains controversial. It is commonly believed that a minimum of 10 mM (i.e. 0.88 g/L butyric or 0.6 g/L acetic acid) acids were necessary to induce the solventogenesis (Gottschalk and Morris, 1981; Terracciano and Kashket, 1986). With an elevated concentration of acids initially added to the medium, the induction of solvent production was initiated at an earlier stage, but it does not necessarily improve the final production of butanol (Gottschalk and Morris, 1981). It has been reported that at different initial acetic and butyric concentrations, the total solvent and the ratio of solvents (acetone/butanol/ethanol) to be produced was changed (Martin, et al., 1983). Several other parameters were also found to affect the butanol production, including temperature, vitamin concentrations and other medium compositions. 37ºC is required for normal metabolic activity of C. acetobutylicum (Soni and Jain, 1997). Two basic vitamins required to maintain active growth of the culture are biotin and p-aminobenzoic acid (PABA), with PABA being the limiting factor. Increasing the vitamin concentrations by 8-fold from 0.01 mg/L biotin and 1.0 mg/L PABA was found to have increased both biomass growth rate and solvent formation rate (Soni, et al., 1987). Other medium compositions have also been reported to affect the solvent production (Soni, et al., 1987). The effect of pH in the range of 4 to 5.5 was evaluated to determine the optimal pH for butanol production. The effects of externally added butyrate on butanol production were also studied to establish the optimal butyrate/glucose ratio for butanol production. The detail of this study has been published (Appl. Biochem. Biotechnol., 113-116:887-898, 2004) and is described in the following section.
11
A.1 Continuous Production of Butanol by Clostridium acetobutylicum Immobilized in a Fibrous Bed Bioreactor Abstract
An investigation was undertaken to explore the influence of dilution rate and pH in continuous cultures of Clostridium acetobutylicum. A 200-ml fibrous bed bioreactor was used to produce high cell density and butyrate concentrations at pH 5.4 and 35 oC. By feeding glucose and butyrate as a co-substrate, the fermentation was maintained in the solventogenesis phase, and the optimal butanol productivity of 4.6 g l-1 h-1 and yield of 0.42 g g-1 (2.2 gallons per bushel corn) were obtained at the dilution rate of 0.9 h-1 and pH 4.3. Compared to the conventional ABE fermentation, the new fermentation process greatly improved butanol yield, making butanol production from corn an attractive alternative to ethanol fermentation. Introduction
Fermentation processes using anaerobic microorganisms provide a promising path for converting biomass and agricultural wastes into chemicals and fuels (1). Acetone-butanol-ethanol fermentation (ABE fermentation) with the strict anaerobic bacterium, Clostridium acetobutylicum, was once (1917-1955) one of the largest fermentation processes ever developed in industry. However, with a few exceptions, anaerobic fermentation processes for production of fuels and chemicals, including ABE fermentation, usually suffer from a number of serious limitations including low yields, low productivity, and low final product concentrations (2-3). It is likely that the fermentation route is now competitive with petroleum-based solvent synthesis because the limitations are now overcome (4). However, U.S. legislation to produce strategic chemicals, fuels, and energy from domestic renewable resources and the need to lessen the dependence on the diminishing petroleum supplies has resulted in the renaissance of the fermentation process as a possible source of solvents (5-7). U.S. Legislation needs to be changed to include Butanol i.e.: “ethanol/butanol” or “poly-carbon alcohols” (alcohols with more than one carbon atom which still eliminates methanol as originally sought by legislation when ethanol was specified) should be used so Butanol can reap the same subsidies that ethanol now entertains. Butanol has many characteristics that make it a better fuel than ethanol, now used in the formulation of gasohol (8). Butanol can solve many problems associated with the use of ethanol. Butanol has the following advantages over ethanol: (a) butanol has 25% more Btu per gallon; (b) butanol is less evaporative/explosive with a Reid vapor pressure (RVP) 7.5 times lower than ethanol; (c) butanol is safer than ethanol because of its higher flash point and lower vapor pressure; (d) butanol has a higher octane rating (9); (e) butanol is more miscible with gasoline and diesel fuel but less miscible with water (10). Petroleum-derived butanol is currently used in food and cosmetic industries as an extractant Bio-butanol is preferred (11), because there are concerns of its carcinogenic aspects associated with the residual petroleum components. Many new uses will occur in these fields as “green” butanol becomes available to the market. Other uses include current industrial applications in solvent (paint thinner), rubber monomers and break fluids. Butanol has the propensity to solve hydrogen infrastructure problems associated with fuel cell use of the future. Dispersed through existing pipelines and filling stations and then butanol can be reformed onboard the fuel cell vehicle, butanol offers a safer fuel with more
12
hydrogen than methanol (very dangerous) or ethanol. Even though there is less hydrogen per molecular mass, what is lost is gained in safety and ease of distribution capabilities. The present research on butanol fermentation has been focused primarily on the effects of pH and dilution rate (D) in continuous cultures of the mutant strain from C. acetobutylicum ATCC 55025. To overcome the problems of low productivity and yield of butanol, cell immobilization in a convoluted fibrous bed bioreactor (FBB) and feeding with dextrose and butyric acid as cosubstrates to produce butanol and reduce production of ancillary byproducts were used in the fermentation. By changing the dilution rate from 0.1 h-1 to 1.2 h-1 at pH 4.3 and varying the pH from 3.5 to 5.5 at the dilution rate of 0.6 h-1, the optimal conditions for high productivity and butanol yield were investigated. Materials and Methods Bacterial culture and Media
Clostridium acetobutylicum ATCC 55025 was cultured in 38 g l-1 Reinforced Clostridial Medium (Oxoid CM149, Hampshire, England) supplemented with 20 g l-1 glucose (Sigma Chemical Co.). Oxoid Reinforced Clostridial Medium has the typical formula (in g l-1): yeast extract 3.0; ‘Lab-Lemco’ powder 10.0; peptone 10.0; soluble starch 1.0; glucose 5.0; cysteine hydrochloride 0.5; sodium chloride 5.0; sodium acetate 3.0; and agar 0.5. The medium was autoclaved at 121 °C and 15 psig for 20 min. A butyric acid medium (BAM) was used in the fermentation study. The BAM was prepared in an 18-liter vessel (Kimax) and consisted of (in g l-1): CM-149: 7.0, dextrose: 50-67, and butyric acid: 3-4. The solution of dextrose and CM149 were autoclaved separately to prevent caramelization, a browning reaction, and then blended and sealed shortly after autoclaving to reduce oxygen contamination. After cooling, sterile nitrogen was added to break the vacuum formed during cooling. Butyric acid at 3 to 4 g l-1 of reagent grade (Aldrich Chemical Co.) and 1 ml of 1 N Na2S solution were added aseptically via filter membrane. The media in the vessel was kept anaerobic by initially sweeping filtered oxygen-free N2 across the surface and then by continuously keeping a low head pressure using a nitrogen filled elastic bladder, which prevented vacuum formation as the medium was transferred out during the continuous fermentation study. The medium pH was adjusted between 3.5 and 5.5, depending on the fermentation conditions studied, by adding 12 N HCl or 5 N NaOH. Fibrous Bed Bioreactor
Figure A.1 shows the experimental set-up of the continuous FBB system with medium recirculation. The FBB was made of a jacketed glass column (total volume: 800 ml) packed with a spiral wound fibrous matrix (packed volume: 200 ml) (12). Before use, the reactor was sterilized at 121 °C and 15 psig for 30 min, and then cooled to room temperature while purging with sterile filtered nitrogen for one hour to ensure that anaerobic conditions were attained inside the reactor. The reactor was then filled with 700 ml of sterile media containing 20 g l-1 dextrose. The medium pH was adjusted to 5.4 using 1 N NaOH or HCl, and the reactor temperature was controlled at 35 °C. The medium was continuously circulated at 20-50 ml/min via a peristaltic pump and flushed with filtered nitrogen to ensure anaerobiosis. The reactor was then inoculated with the cells by injecting 3 ml of a stock culture, and approximately 2-3 days were allowed for cell growth and immobilization in the fibrous matrix. Once solventogenesis occurred, the butyric acid media (BAM) described above was fed into the FBB continuously.
13
Fermentation Kinetics Study
The fermentation kinetics, mainly in solventogenesis phase, was studied with the FBB fed continuously with the butyric acid media (BAM) under strict anaberobiosis. The effects of pH (3.5 to 5.5) and dilution rate (0.1 h-1 to 1.2 h-1) were studied at 35 oC with two FBB’s. Two fibrous bed bioreactors, reactor L and R, were used in parallel experiments to ensure the reproducibility of the data. The reactor performance at various dilution rates was first studied at pH 4.3. The pH effect was then studied at a fixed dilution rate of 0.6 h-1. For each condition studied, the reactor was operated under a constant feed condition for ~100 h to allow the reactor to reach pseudo-steady state before changing to next feed condition. The dilution rate was estimated based on the reactor packed volume of 200 ml. With continuous medium recirculation and bubbling gas production in the fermentation, the reactor was sufficiently mixed and can be assumed to be well mixed. Analytical Methods
At specified time intervals, 1 ml of sample was drawn aseptically. The cell density (data not shown here) in the fermentation broth was measured by optical density (OD) at 600 nm wavelength with a spectrophotometer (Model 3400, Sequoia-Turner, Mountain View, CA). The pH was measured with a pH/ORP Controller (Model 5652-10, Cole Parmer, Vernon Hills, IL). After removing the bacterial cells by centrifugation at 13,200 rpm (16,100 g) for 5 min, the clear fermentation broth was subjected to analysis for residual glucose and product concentrations. Glucose concentration was measured using YSI model 2700 Select Biochemistry Analyzer (Yellow Springs, Inc., OH). Acetone, butanol, ethanol, acetic acid and butyric acid were determined by using a gas chromatograph (Varian 3400 GC) equipped with a flame ionization detector and a SP4270 integrator. The glass column (2 m x 2 mm) (Supelco Inc., Bellefonte, PA) was packed with 80/120 Carbopack BAW/6.6% Carbowax 20M. The oven temperature was programmed from 100 °C to 185 °C at a rate of 15 °C/min after an initial holding time of one minute. The injector and detector temperatures were set at 200 °C and 225 °C, respectively. Nitrogen was the carrier gas set at a flow rate of 20 ml/min. Results Effects of Dilution Rate
Figure A.2 shows the concentration profiles of the outlet streams from the reactors operated at various dilution rates with the feed medium at pH 4.3. After the initial growth phase and the feed medium had been changed to BAM, the reactor L was operated by gradually increasing the dilution rate from 0.1 h-1 to 0.3 h-1 at 102 h, to 0.5 h-1 at 201 h, and to 1.0 h-1 at 311 h; and then dropped to 0.8 h-1 at 407 h before increasing again to 1.2 h-1 at 503 h. In contrast, the reactor R was initially operated at 0.9 h-1 and then gradually decreased to 0.6 h-1 at 109 h, to 0.4 h-1 at 205 h, and to 0.2 h-1 at 301 h. The dilution rate was then increased to 0.7 h-1 at 407 h and again to 1.1 h-1 at 500 h. As can be seen in the figure, the outlet concentrations of substrates and products changed as the dilution rate changed, and in general they fluctuated before approaching a pseudo-steady state towards the end of each operating condition period. Although a clear steady state was not always achieved, there were clear trends in solvents production and substrates utilization as affected by the dilution rate. In general, as the dilution rate increased from 0.1 to 1.2 h-1, the outlet concentrations of glucose, butyrate, and acetate also increased, whereas the concentrations of acetone, ethanol and butanol decreased (Reactor L). Consistent trends in reactor responses to decreasing the dilution rate were also observed (Reactor 14
R). These were expected results since at a higher dilution rate, the medium had shorter contact time with cells and, therefore, less substrates were consumed with less products formed in the fermentation. The highest concentration of butanol produced in the fermentation was 12.5 g l-1 at the dilution rate of 0.1 h-1, whereas a low butanol concentration of ~3.5 g l-1 was obtained at higher dilution rates of 0.8 - 1.2 h-1. It should be noted that the butyrate concentration in the reactor outlet was always lower than that in the BAM, indicating that butyrate also was used as a carbon source in the solventogenic fermentation. However, a significant amount of acetate was still produced in the fermentation, especially at high dilution rates when there was significant cell growth or acidogenesis. As the dilution rate decreased, acetate concentration also decreased because the acetate produced in acidogenesis was re-consumed in solventogenesis. The reactor volumetric productivities and product yields at pH 4.3 and various dilution rates were estimated based on the time course data in the pseudo-steady state, and are shown in Figure A.3. In general, production rates for butanol and acetate increased with increasing the dilution rate from 0.1 to 1.2 h-1, whereas acetone and ethanol remained relatively unaffected by the dilution rate except at 0.1 h-1. The maximum butanol productivity of 4.6 g l-1 h-1 at 0.9 h-1 dilution rate was obtained with Reactor R at the beginning of the solventogenic fermentation, while a lower productivity of ~3.3 g l-1 h-1 at higher dilution rates was obtained after the reactor had been operated for a long period. It is not clear if the large difference was attributed to the dilution rate effect or the culture age. Butanol is a strong inhibitor to the fermentation. It is thus expected to have a lower butanol productivity at a lower dilution rate where the butanol concentration was higher. The increased acetate productivity by increasing the dilution rate was consistent with the higher cell growth rate as acetate and butyrate are the main products in the acidogenic phase where cell growth also occurs. The product yields from glucose in the fermentation were based on the total consumption of glucose and butyrate, and each gram of butyric acid consumed was considered as two grams of glucose in the feed since the butyric acid yield from glucose in butyric acid fermentation was ~50% (12). As can be seen in Figure 3B at pH 4.3, the butanol yield decreased slightly as the dilution rate increased from 0.1 to 0.3 h-1, but then increased with increasing the dilution rate until reaching the maximum value of 0.42 g g-1 at 0.9 h-1. The butanol yield was lower as the dilution rate continued to increase to 1.2 h-1. In contrast, acetone and ethanol yields appeared to be not significantly affected by the dilution rate. The overall yield of solvents (acetone, butanol, and ethanol) was ~0.4 g g-1, with the maximum value of 0.53 g g-1 obtained at 1.0 h-1. The average product yields at all dilution rates studied were found to be 0.27, 0.12, and 0.015 g g-1 for butanol, acetone, and ethanol, respectively. Effects of pH
After 606 h, the dilution rate in the reactor L was decreased from 1.2 to 0.6 h-1. When the pH was adjusted to 3.5 at 623 h, the concentrations of acetone, butanol and ethanol decreased dramatically and reduced to almost 0 g l-1 by 700 h (see Figure A.4A). In the mean time, the concentrations of glucose and butyric acid increased with time to reach almost their feed concentrations. Coupling with the low OD value, it was apparent that the fermentation had almost ceased at this low pH value. However, the trends were reversed and the reactor started to recover after the feed pH was increased to 3.8 at 726 h. The product concentrations (ABE) continued to increase while substrates decreased as the feed pH was increased to 4.0 at 887 h. For reactor R, after reducing the dilution rate from 1.1 to 0.6 h-1 and increasing the feed pH from 15
4.3 to 5.3 at 661 h, the concentration of butanol increased rapidly and the concentrations of glucose and butyrate reduced (see Figure A.4B). This trend appeared to continue with time, although slowed down as the pH changed to 4.7 at 733 h, despite that the pH decreased to 4.5 at 795 h and then increased to 5.1 at 901 h, reaching a significantly higher butanol concentration of ~7.7 g l-1 at 956 h. The observed effects probably were mainly attributed to the change in the dilution rate and much less to the pH in the range studied (4.5 to 5.3). However, further increasing the feed pH to 5.5 at 1028 h abruptly decreased butanol production in the fermentation and the concentration of butanol dropped to below 4 g l-1, with corresponding increase in the glucose concentration. For both reactors, the concentration of acetic acid appeared to increase somewhat with increasing the pH, consistent with the fact that acidogenesis is generally favored at a higher pH. Although steady state might have not been reached in certain operating pH conditions studied, the productivities and product yields at the dilution rate of 0.6 h-1 and various feed pH values were estimated and are shown in Figure A.5. In general, the reactor productivity for butanol increased with increasing the pH until reaching the maximum value of 4.6 g l-1 h-1 at pH 5.1, but then decreased as the pH increased further to 5.5. The effect of pH on the butanol yield appeared to be small in the range of 3.8 to 5.3, although the maximum value was found at pH 4.5. Butanol yield was significantly lower at pH 5.5, which is usually considered to be the pH value more favorable to acidogenesis. Both the productivity and butanol yield were low at pH 3.5, which appeared to be the lower limit for ABE fermentation. Acetone and ethanol production appeared to be much less sensitive to the pH in the range studied. Discussion
Optimizing the ABE fermentation process has long been the aspiration of over a century of research. Conventionally, the profitability of fermentation is influenced by the type and concentration of substrate, the dilution rate, pH, culture medium and product recovery. Even using cell recycle, cell immobilization or extractive fermentation to increase cell density and productivity, the yield of the combined ABE production never exceeded 0.44 g g-1 (13-15). The production of butanol is usually associated with the uptake of various acids. In this work, we developed a continuous fermentation that improved the uptake of butyric acid and glucose by C. acetobutylicum in the FBB. Producing butanol via butyric acid converted from carbohydrates was efficient owing to the high density of viable cells maintained in the FBB through continual cell renewal (16). The optimal butanol yield of 0.42 g g-1 and productivity of 4.6 g l-1 h-1 were obtained in a 200-ml FBB at the dilution rate of 0.9 h-1, pH 4.3, and 35 oC with 54 g l-1 glucose and 3.6 g l-1 butyric acid in the feed stream. The concentration of butanol was 5.1 g l-1 on average. The conversions of glucose and butyric acid were 0.19 and 0.31, respectively. The optimum solvent (ABE) yield was 0.53 g g-1 under the same process condition. The higher butanol and total solvent yields obtained in this work can be attributed to feeding with butyrate as a co-substrate (BAM), which greatly reduced acidogenesis and promoted solventogenesis. The increased butanol yield also could be due to the dramatically reduced ethanol production. Also, cell immobilization in the FBB allowed the bacteria to survive long in the solventogenic phase, allowing for long-term continuous solvent production without frequent cell regeneration. .
16
This work has shown that doubling the yield of butanol to ~2.5 gal/bushel of corn (0.37 L/kg) in the conventional ABE fermentation can be achieved by converting carbohydrates into mainly butanol, which can make fermentation derived butanol economically competitive with petrochemically derived butanol. Compared to the conventional ABE fermentation (the optimum butanol yield of 0.25 g g-1 and productivity of 4.5 g l-1 h-1), the FBB notably enhanced the yield of butanol and ABE (more than 68 and 20%, respectively) by C. acetobutylicum, making butanol production from renewable resource an attractive alternative to ethanol fermentation. Commercialization of this new technology has the propensity to reduce our Nation’s dependence on foreign oil, protect our fuel generation grid from sudden disruption, develop our agricultural base, solve the hydrogen supply problem associated with fuel cells, and help reduce global warming. References
Minton, N. P. and Clarke, D. J. (1989), Clostridia, Plenum Press, New York. Soni, B. K., Soucaille P., and Goma, G. (1987), Appl. Microbiol. Biotechnol., 25, 317-321. Garcia, A., Ianotti, E. L., Fischer, J. L. (1986), Biotechnol. Bioeng., 28, 785-791. Durre, P. (1998), Appl. Microbiol. Biotechol., 49, 639-648. Mollah, A. H. and Stuckey, D. C. (1993), J. Chem. Tech. Biotechnol., 56, 83-89. Qureshi, N., Schripsema, J., Lienhardt, J., and Blaschek, H. P. (2000), World J. Microbiol. Biotechnol., 16(4), 377-382. Huang, J. and Meagher, M. M. (2001), J. Membrane Sci., 192, 231-242. Mollah, A. H. and Stuckey, D. C. (1993), Enzyme Microb. Technol., 15, 200-207. Ladisch, M. R. (1991), Enzyme Micorb. Technol., 13, 280-283. Park, C.-H., Okos, M. R., and Wankat P. C. (1989), Biotechnol. Bioeng., 34, 18-29 Qureshi, N. and Blaschek, H. P. (1999), Biotechnol. Prog., 15, 594-602. Zhu, Y., Wu, Z., and Yang, S.-T. (2002), Process Biochem., 38(5), 657-666. Qureshi, N., Maddox, I.S., and Friedl, A. (1992), Biotechnol. Prog., 8, 382-390. Qureshi, N. and Blaschek, H.P. (2000), Appl. Microbiol. Biotechol., 84-86, 225-235. Qureshi, N. and Blaschek, H.P. (2001), Renewable Energy, 22, 557-564. Zhu, Y. and Yang, S.-T. (2003), Biotechnol. Prog., 19, 365-372.
17
pH Probe Gas Outlet
Input Metering Pump Fibrous Bed Bioreactor Medium Supply
Output Metering Pump Circulation Pump
Product Receiver
Figure A.1. A continuous fibrous bed bioreactor (FBB) system for ABE fermentation.
18
Reactor L
14
D = 0.1
0.5
0.3
1.0
60
-1
0.8
1.2 h
12
8 30 OD
6
20 4 10
2
0
0 0
100
200
300
A
600
Ethanol
Butanol
Butyrate
Dextrose
OD
Acetate
0.6
0.4
0.2
-1
0.7
60
1.1 h
10
50
8
40
6
30 OD
4
20
2
-1
Acetone
Glucose ( g l ); OD (x 0.05 )
-1
500
Reactor R D = 0.9
Concentration (g l )
400
Time (h )
12
10
0
0 0
B
-1
40
-1
Concentration (g l )
10
Glucose ( g l ); OD (x 0.05 )
50
100
200
300
400
500
600
Time (h )
Figure A.2. Kinetics of continuous ABE fermentation at various dilution rates and pH 4.3. Glucose and OD are on the right axis; others are on the left axis.
19
20
21
22
B. Development of butyric acid over-producing strains The metabolic pathway of glucose in acidogenic Clostridium tyrobutyricum has several possible end-products, including butyrate, and acetate, CO2, H2 and lactate as byproducts. Two analogous pathways lead to the formation of acetate and butyrate, with acetyl-CoA and butyryl-CoA functioning as key intermediates, respectively. First, acetyl phosphate and butyryl phosphate are produced from their CoA derivatives, catalyzed by phosphotransacetylase (PTA) and phosphotransbutyrylase (PTB), respectively. Then, these acyl phosphates are converted to acetate and butyrate catalyzed by acetate kinase (AK) and butyrate kinase (BK), respectively. Fermentation studies have shown that the major characteristic of this fermentation is the concomitant production of acetate with butyrate. In addition to 0.95 mol/mol of butyrate production from glucose, a high amount of 0.27 mol/mol of acetate was also formed in the immobilized cell fermentation. This situation raises the physiological question of redirecting carbon flow between the pathways involved in order to improve the selectivity of butyrate production over acetate. Glucose
2 ADP
2 NAD+
2 ATP
2 NADH
2 Pyruvate CoA 2 CO2
ATP
Acetate
H2
FdH2
H+
2 Acetyl-CoA
PT ADP
Fd
Acetyl-P AK CoA
Acetoacetyl-CoA 2 NADH+H+ 2 NAD+
Butyryl-CoA PTB Butyryl-P ADP BK ATP Butyrate 23
Metabolic pathway for butyric acid fermentation of glucose. (AK: acetate kinase, BK: butyrate kinase, PTA: phosphotransacetylase, PTB: phosphotransbutyrylase).
Based on the fermentation biochemistry, stoichiometric equations have been derived for fermentations of glucose and xylose by C. tyrobutyricum. It is clear that butyrate yield can be increased significantly by reducing biomass formation and acetate production. The butyrate yields can be increased to more than 1 mol/mol for glucose and 0.83 mol/mol for xylose as the substrate for immobilized cell fermentation when acetate formation is completely eliminated. The objectives of this study were to: (1) genetically modify cellular metabolism by using recombinant DNA technology in order to produce more butyrate and reduce or eliminate acetate formation, (2) investigate the impact of down-regulating acetate formation enzymes in the metabolism of C. tyrobutyricum, (3) develop new strains of C. tyrobutyricum exhibiting significantly enhanced butyrate production capacities for industrial applications. We focused on the genes ack and pta encoding enzymes AK and PTA involved in the acetate formation pathway. Gene knockout experiments were carried out to develop butyric acid over-producing strains, and the results have been published (Biotechnol. Bioeng., 90:154-166, 2005) and are discussed in the following section. B1. Construction and Characterization of pta Gene Deleted Mutant of Clostridium tyrobutyricum for Enhanced Butyric Acid Fermentation Abstract Clostridium tyrobutyricum ATCC 25755 is an acidogenic bacterium, producing butyrate and acetate as its main fermentation products. In order to decrease acetate and increase butyrate production, integrational mutagenesis was used to disrupt gene associated with the acetate formation pathway in C. tyrobutyricum. A non-replicative integrational plasmid containing phosphotransacetylase gene (pta) fragment cloned from C. tyrobutyricum by using degenerate primers and an erythromycin resistance cassette was constructed and introduced into C. tyrobutyricum by electroporation. Integration of the plasmid into the homologous region on the chromosome inactivated the target pta gene and produced the pta-deleted mutant (PPTA-Em), which was confirmed by Southern hybridization. SDS-PAGE and two-dimensional protein electrophoresis results indicated that protein expressions were changed in the mutant. Enzyme activity assays using the cell lysate showed that the activities of PTA and AK in the mutant were reduced by more than 60% for PTA and 80% for AK. The mutant grew slower in batch fermentation with glucose as the substrate, but produced 15% more butyrate and 14% less acetate as compared to the wild type strain. Its butyrate productivity was approximately two fold higher than the wild type strain. Moreover, the mutant showed much higher tolerance to butyrate inhibition and the final butyrate concentration was improved by 68%. However, inactivation of pta gene did not completely eliminate acetate production in the fermentation, suggesting the existence of other enzymes (or pathways) also leading to acetate formation. This is the first reported genetic engineering study demonstrating the feasibility of using gene inactivation technique to manipulate the acetic acid formation pathway in C. tyrobutyricum in order to improve butyric acid production from glucose.
24
INTRODUCTION Clostridium tyrobutyricum ATCC 25755 is a gram-positive, rod-shaped, spore-forming, obligate anaerobic bacterium capable of fermenting a wide variety of carbohydrates to butyric and acetic acids. There has been increasing interest in the production of butyric acid from agricultural commodities and processing wastes using C. tyrobutyricum (Zhu et al., 2002). Butyric acid has many applications in chemical, food, and pharmaceutical industries (Zigova, et al. 1999; Vandak et al. 1997). Conventional butyric acid fermentation process is not yet economically competitive because it produces butyric acid at a relatively low concentration, yield and rate. Recently, C. tyrobutyricum cells immobilized in a fibrous-bed bioreactor were successfully used for butyrate fermentation with increased reactor productivity and final product concentration (Zhu et al., 2002; Wu and Yang, 2003). However, the butyrate yield was only ~0.5 g/g or 0.9 mol/mol and acetate yield was ~0.27 mol/mol of glucose fermented in the fermentation (Zhu et al., 2002). To improve the economics of the fermentation process, it is desirable to increase butyrate production while reducing acetate production, which also reduces the product separation cost. Several factors influencing the selectivity for butyrate over acetate in the fermentation have been identified, including cell growth rate, glucose concentration or supply mode, and the partial pressure of H2 (van der Lelie, et al., 1988; Michel-Savin, et al., 1990; Michel-Savin, et al., 1990). Complete selectivity for butyrate production was shown to be possible in glucose-limited fedbatch cultures (Michel-Savin, et al., 1990), but the reactor productivity and final product concentration were not high enough for economical production purpose. The metabolic pathways for acids production in some clostridial strains, such as Clostridium acetobutylicum, have been extensively studied (Rogers and Gottschalk, 1993). The breakdown of hexose to pyruvate proceeds via the Embden-Meyerhof-Parnas pathway in C. acetobutylicum. Phosphotransacetylase (PTA) and acetate kinase (AK) are two key enzymes involved in the pathway leading to acetic acid formation, whereas phosphotransbutyrylase (PTB) and butyrate kinase (BK) catalyze the formation of butyric acid from butyryl-CoA. C. tyrobutyricum produces butyrate with acetate as its main co-product, indicating similar acids formation metabolic pathways possibly exist in this bacterium. The detection of enzyme activities of PTA, AK, PTB, and BK in C. tyrobutyricum demonstrates that the production of butyrate and acetate can also be catalyzed by these enzymes (Zhu and Yang, 2003). Integrational mutagenesis, a genetic engineering technique that can selectively inactivate undesired genes from the host chromosome has been developed and successfully used to create metabolically engineered mutants of Clostridial strains (Green et al., 1996). In this technique, a fragment of the target gene is cloned into a non-replicative vector with a selection marker, resulting in the non-replicative integrational plasmid. The partial gene in the non-replicative plasmid can recombine with the internal homologous region of the original target gene in the parental chromosome, which results in insertional inactivation of the target gene. Previous studies using integrational mutagenesis to improve clostridial fermentation product yield have focused on solventogenic C. acetobutylicum. A non-replicative plasmid (pJC4) with partial pta gene (encoding PTA) was constructed and integrated into the homologous region of pta gene on the chromosome of C. acetobutylicum ATCC 824, resulting in reduced PTA and AK activities and acetate production (Green and Bennett, 1998; Green et al., 1996). The same metabolic engineering approach can be used to reduce or eliminate acetate production in butyric acid fermentation by C. tyrobutyricum. The main objectives of this study were to genetically modify the acetate formation pathway by inactivating pta gene in C. tyrobutyricum and to study its effect on butyric acid
25
fermentation. The pta gene has been cloned and characterized for several microorganisms, including C. acetobutylicum (Boynton, et al., 1996), Escherichia coli (Kakuda et al., 1994; Matsuyama, et al., 1989), and Methanosarcina thermophila (Latimer and Fery, 1993). However, to date no genetic engineering study has been reported for C. tyrobutyricum or similar butyric acid bacteria, and very little is known about the pta gene in C. tyrobutyricum. In this work, the partial pta gene from C. tyrobutyricum was cloned and sequenced. Gene inactivation by integrational plasmid was then carried out to develop a pta-deleted mutant. The protein expressions and the enzyme activities of the mutant were examined to understand how the gene manipulation worked. Finally, the effects of the mutation on cell growth and fermentation kinetics were studied and are discussed in this paper. MATERIALS AND METHODS Bacterial Strains and Plasmids Table 1 lists all bacterial strains and plasmids used or created in this work along with their characteristics and sources. C. tyrobutyricum ATCC 25755, designated as the wild type, was grown anaerobically at 37°C in clostridial growth medium (CGM) (Huang et al., 1998). Colonies were maintained on Reinforced Clostridial Medium (RCM; Difco) plates in the anaerobic chamber. These media were supplemented with 40 µg/ml erythromycin (Em) for C. tyrobutyricum mutant selection. E. coli was grown aerobically at 37°C in Luria-Bertani (LB) medium supplemented with ampicillin (100 µg/ml) and erythromycin (200 µg/ml). DNA Manipulations Plasmid DNA from E. coli was isolated using QIAprep Miniprep plasmid purification kit (Qiagen, Valencia, CA) for sequencing and transformation purposes. Chromosomal DNA from C. tyrobutyricum was prepared using QIAGEN genomic DNA kit. DNA fragment was purified from gel using QIAGEN gel extraction kit. PCR Amplification. Synthetic oligonucleotides were designed as primers for PCR amplification based on the homology alignment analysis of PTA from E. coli, C. acetobutylicum, B. subtilis, M. thermophila, P. denitrificans, and Mycoplasma genitalium (Boynton et al., 1996) and the codon usage preference for C. tyrobutyricum (http://www.kazusa.or.jp/codon). The highest homologous region of the amino acid sequence was selected as the degenerate primers. The DNA sequences of the non-specific primers for pta gene were 5’–GA(A/G) (C/T)T(A/T/G) AG(A/G) AA(A/G) CA(T/C) AA(A/G) GG(A/T) ATG AC–3’ (upstream) and 5’–(A/T)GC CTG (A/T)(G/A)C (A/T)GC(A/T/C) GT(A/T) AT(A/T) GC–3’ (downstream). Amplification of partial pta sequence from wild type C. tyrobutyricum chromosomal DNA (template) was performed with optimized PCR buffer containing 0.5 mM (each) dNTPs, 300 nM (each) primers, 2.5 mM MgCl2 and 2.5 U Taq DNA polymerase (Invitrogen, Carlsbad, CA) in a DNA engine (MJ Research, Reno, NV). Thermal cycling was conducted under the following conditions: initial denaturation (94oC for 3 min); 40 cycles program with template denaturation (94oC for 50 s), primers annealing (48oC for 50 s), and extension (72oC for 1 min); deoxyadenosine (A) adding to the 3’ ends of PCR products (72oC for10 min). The PCR product with expected size of 730 bp was cloned into PCR vector pCR 2.1 (3.9 kb) using TA cloning kit (Invitrogen), and the produced plasmid pCR-PTA (4.65 kb) was then sequenced to determine the DNA sequence of the cloned pta gene fragment. Construction of Integrational Plasmid. Fig. B.1 shows the general design in constructing the integrational plasmid pPTA-Em. First, a 1.5-kb fragment was removed from pCR-PTA (4.65
26
kb) with SphI digestion, and the remaining pCR-PTA was religated to form plasmid pCR-PTA1 (3.15 kb). Then, a 1.6-kb HindIII fragment containing the Emr cassette from pDG 647 (GuéroutFleury et al., 1995) was ligated with HindIII digested pCR-PTA1, forming the integrational plasmid pPTA-Em (4.75 kb) for use in pta gene inactivation. Transformation Plasmid transformation to E. coli was performed according to the manufacturer’s instruction (Invitrogen). Transformation of integrational plasmid into C. tyrobutyricum was carried out using a Bio-Rad Gene pulser (Model II). All manipulations were operated in an anaerobic chamber equipped with an incubator and a centrifuge. The competent cells of C. tyrobutyricum were prepared as follows: after overnight growth, a 50 ml culture at late log-growth phase was used to inoculate 40 ml CGM medium supplied with 40 mM DL-threonine. Cells were grown for 4 h (OD600 = ~0.8), harvested, washed twice and suspended in ice-cold electroporation buffer, referred as SMP buffer (270 mM sucrose, 1 mM MgCl2, 7 mM sodium phosphate, pH 7.4). About 0.5 ml of cell suspension was chilled on ice for 5 min in a 0.4-cm electroporation cuvette (Bio-Rad, Hercules, CA), and plasmid DNA (10~15 µg of non-replicative plasmid pPTA-Em) was added into the cold competent cell suspension. After the pulse (2.5 kV, 600 Ω, 25 µF) was applied to the cuvette, the transformed cells were transferred to 5 ml pre-warmed CGM and incubated at 37°C for 3 h prior to plating on RCM plates containing 40 µg/ml Em. Plates were incubated to develop the mutant colonies in 37°C anaerobic incubator for 3-5 days. Southern Hybridization Restriction enzyme SmaI was used to digest the chromosomal DNA of both wild type and mutant completely at 30oC. After being separated on a 1% agarose gel with low voltage, all digested DNA fragments were transferred from the agarose gel to a Hybond-N+ nylon membrane (Amersham, Piscataway, NJ) by upward Southern capillary transfer. Pre-hybridization of blotted nylon membrane was performed at 50oC for 1 h. Two probes were used separately for the hybridization of Emr gene and pta gene. The Emr probe was prepared from HindIII-digested pPTA-Em followed with SacI digestion, resulting in a partial Emr gene fragment of ~345 bp. The pta probe was the same as the cloned pta fragment from PCR. Both probes and the HindIIIdigested λ DNA, which was used as DNA-size marker, were labeled with alkaline phosphatase (Amersham). The hybridization with the probes was carried out with gently shaking at 62oC overnight. HyperfilmTM ECL (Amersham) was then used for the detection. Characterization of Mutant The protein expression pattern and the enzyme activities of PTA, AK, PTB and BK in the ptadeleted mutant (PPTA-Em) were studied. Fermentations were performed to further characterize PPTA-Em in its butyrate production and sensitivity to butyrate inhibition. Preparation of Cell Extract. Bacteria were grown in 50 ml CGM at 37°C to the exponential phase (OD600 = ~1.5). Cells were harvested, washed and suspended in 5 ml of 25 mM Tris/HCl (pH 7.4). The cell suspension was sonicated, and cell debris was removed by centrifugation. The protein content of extracts was determined following standard Bradford protocol (Bio-Rad). SDS-PAGE and Two-Dimensional Protein Electrophoresis. Protein samples for SDSPAGE electrophoresis were prepared following standard protocol (Bio-Rad). Total protein samples (24 µg each) were loaded into wells and SDS-PAGE gel was run at 100 V for 3 h with
27
PROTEAN II xi Cell (Bio-Rad). For two-dimensional protein electrophoresis (2DE) analysis, cell extract was concentrated by acetone and then dissolved in rehydration buffer (8 M urea, 4% CHAPS, 10 mM DTT, 0.2% (w/v) Bio-Lytes 3/10) for sample preparation. The first dimension was performed on a 7 cm IPG strip with a nonlinear immobilized pH 3-10 gradient (Amersham). The IPG strip was rehydrated in rehydration buffer with 6 µg protein sample at 50 V for 12 h using PROTEAN IEF Cell (Bio-Rad). After rehydration, the protein was focused on IPG strip by preset method, at 250 V for 15 min to remove excess salts, then ramped linearly from 250 V to 4000 V for 2 h, and finally maintained at 4000 V for 5 h for focusing purpose. After isoelectric focusing (IEF), the strip was equilibrated in equilibrated buffer I (6 M urea, 2% SDS, 0.375 M Tris-HCl, pH 8.8, 20% glycerol and 130 mM DTT) for 10-15 min and in equilibrate buffer II (6 M urea, 2% SDS, 0.375 M Tris-HCl, pH 8.8, 20% glycerol and 135 mM iodoacetamide) for 1015 min. The equilibrated strip was applied to a polyacrylamide/PDA SDS gel to run the second dimension electrophoresis at 100 V for 90-120 min with Mini-PROTEAN 3 Cell (Bio-Rad). The protein spots were developed using silver staining kit (Amersham). The two-dimensional protein electrophoresis gels were analyzed using Phoretix 2D AdvancedTM software (Nonlinear Dynamics Ltd, Newcastle upon Tyne, UK). Enzyme Assays. The activities of acetate kinase (AK) and butyrate kinase (BK) were measured by monitoring the formation of acyl phosphate from acetate and butyrate, respectively, at 540 nm (Rose, 1955). Enzyme activity was calculated on the basis of a molar extinction coefficient of 0.169 mM-1cm-1 (Cary et al., 1988). One unit of AK and BK activity was defined as the amount of enzyme that produces 1 µmol of hydroxamic acid per minute. Phosphotransacetylase (PTA) and phosphotransbutyrylase (PTB) were assayed by detecting the liberation of CoA from acetyl-CoA and butyryl-CoA at 405 nm, respectively (Andersch et al., 1983). An extinction coefficient of 13.6 mM-1cm-1 was used for activity calculation. One activity unit of PTA and PTB was defined as the amount of enzyme converting 1 µmol of acyl-CoA or butyryl-CoA per minute under the reaction conditions. Specific activity of all enzymes was defined as the unit of activity per mg of protein. For each enzyme, the data reported are from two separate assays with two duplicates in each assay. Fermentation Kinetic Study. Batch and fed-batch fermentations of C. tyrobutyricum were performed in a 5 L stirred-tank fermentor (Marubishi MD-300) containing 2 L of clostridial growth medium (CGM) supplemented with glucose (30 g/L) and 40 µg/ml erythromycin (Em) as required. Anaerobiosis was reached by initially sparging the medium with nitrogen. The medium pH was adjusted to ~6.0 with 6 N HCl before inoculation with ~100 ml of cell suspension prepared in a serum bottle. Experiments were carried out at 37°C, 150 rpm, and pH 6.0 controlled by NH4OH. The fed-batch mode was operated by pulse feeding concentrated substrate solution when the sugar level in the fermentation broth was close to zero. The feeding was continued until the fermentation ceased to produce butyrate due to product inhibition. Gas (H2 and CO2) production in the fermentation was monitored using an on-line respirometer system equipped with both H2 and CO2 sensors (Micro-oxymax, Columbus Instrument). Samples were taken at regular intervals from the fermentation broth for the analyses of cell, substrate and products. A high performance liquid chromatograph (HPLC) was used to analyze the organic compounds, including glucose, butyrate, and acetate in the liquid samples (Wu and Yang, 2003). Inhibition Effect of Butyrate on Cell Growth. Cultures of C. tyrobutyricum were grown in serum tubes containing 10 ml of media with various concentrations of butyrate (0 – 15 g/L) to evaluate the inhibition effect of butyrate on cell growth, which was followed by measuring the
28
optical density at 600 nm (OD600) with a spectrophotometer (Sequoia-Turner, Model 340). Specific growth rates were estimated from the OD600 data. RESULTS PCR Amplification and Sequence Analysis One DNA fragment with expected size of ~730 base nucleotides was generated with degenerate primers by PCR amplification. This DNA fragment was cloned into pCR 2.1 vector. The resulting plasmid, designated as pCR-PTA, was then transformed into E. coli. Positive clones were identified, and nucleotide sequencing of the pta fragment showed 732 nucleotides, encoding for 244 amino acids, which can be found in GenBank (GBAN AY572855). The partial amino acid sequence of PTA of C. tyrobutyricum was then compared with the known sequences of complete PTA from several other microorganisms. As shown in the homology alignment (Fig. B.2), there are high degrees of identities and similarities between C. tyrobutyricum and C. acetobutylicum (70%), Methanosarcina thermophila (56%), E. coli (51%), B. subtilis (47%), Mycoplasma genitalium (47%), and P. denitrificans (47%), confirming that the PCR product was from the pta gene in C. tyrobutyricum. Transformation The non-replicative plasmid pPTA-Em (4.75 kb) was constructed and used to transform C. tyrobutyricum by electroporation. Before electroporation, the protoplast of C. tyrobutyricum was prepared to examine the presence of restriction system on this plasmid. The inability to detect any digestion of the plasmid suggested that no restriction enzymes were present in C. tyrobutyricum, similar to the results previously obtained with Clostridium pasteurianum ATCC 6013 (Richards et al., 1988). After electroporation, a selective pressure of Em was used to detect mutant cells containing the non-replicative plasmids. A total of ~10 Em-resistant colonies were obtained after electroporation with a transformation efficiency of 1 colony per µg DNA, which was similar to those obtained for the integrational plasmids in C. acetobutylicum ATCC 824 (Green and Bennett, 1998; Green et al., 1996). As a negative control, non-replicative plasmid with Emr cassette but without the pta fragment was also used to transform the C. tyrobutyricum cells. As expected, no transformed mutant was obtained since the plasmid cannot be replicated in the cells without first integrating into the chromosome via homologous recombination. Therefore, the pPTA-Em must have been integrated into the chromosome by homologous recombination in the transformed cells. Since the homologous region in pPTA-Em is the internal DNA sequence of pta, the transformed cells were mutagenic and the original pta gene on the chromosome have been disrupted. Southern Hybridization DNA hybridization was performed to localize the integration site of the non-replicative plasmid on the parental chromosome. Both SmaI digested PPTA-Em and wild type chromosomal DNA was identified with two probes (partial Emr and pta gene) following the method described by Green et al. (Green et al., 1996). It is noted that the non-replicative plasmid pPTA-Em had unique SmaI restriction site in the backbone and there was no SmaI site in the pta insert. As shown in Fig. B.3, the Emr probe only hybridized to one SmaI fragment (6.3 kb) from mutant PPTA-Em but none from the wild type strain, indicating that the integrational plasmid was inserted into the chromosomal DNA of the mutant since the 6.3-kb fragment contained the
29
antibiotics gene from the plasmid pPTA-Em. Meanwhile, two SmaI fragments (approximate 4.5 kb and 6.3 kb) from the mutant strain and a 6-kb SmaI fragment from the wild type strain were detected by the pta probe (Fig. B.3). The total size (10.8 kb) of the pta probe hybridized fragments from the mutant (4.5 kb + 6.3 kb) was equal to the size of pta hybridized fragment from the wild type (6.0 kb) plus the size of the plasmid pPTA-Em (4.8 kb), indicating that pPTAEm had been inserted into the parental pta gene on the chromosome in the mutant through homologous recombination (Campbell, 1962), as illustrated in Fig. B.3. Since pPTA-Em was internal to the pta gene, the original pta gene on the chromosome was disrupted and has lost its function, producing the pta-deleted mutant PPTA-Em. Protein Expression The effects of pta gene disruption on protein expression in the mutant cells were evaluated with SDS-PAGE and 2DE analyses. The SDS-PAGE gel clearly showed that the highly expressed protein in the wild type with molecular weight of ~32 kDa diminished in PPTA-Em mutant (Fig. B.4). Fig. B.5 shows the two-dimensional protein analysis of wild type and mutant PPTA-Em grown at 37oC, pH 6.0, and with glucose as the carbon source. The 2DE gels were analyzed with the Phoretix 2D AdvancedTM software, which also normalized the different intensities of the protein spots on these gels for easy comparison. As can be seen in Fig. B.5, the number of proteins and their expression levels were altered in the mutant PPTA-EM. At least two proteins with molecular weight of ~32 kDa (spot #57, PI ≈ 6.2 and spot #60, PI ≈ 6.8) in the wild type were missing and one protein (#58) highly expressed in wild type was dramatically down regulated in the mutant. This result is consistent with the finding from the SDS-PAGE analysis. The missing proteins in the mutant were probably AK and PTA. Disrupting the pta gene might have resulted in the deletion of both AK and PTA from the mutant PPTA-Em since both pta and ack genes are most likely to be in the same operon with pta gene being upstream of the ack gene, as found in several microorganisms including C. acetobutylicum (Boynton et al., 1996). Acid-Forming Enzyme Activities Exponential-phase cultures of C. tyrobutyricum wild type and PPTA-Em mutant were harvested, and the cell extracts were assayed for acetate and butyrate-producing enzymes PTA, AK, PTB, and BK. As shown in Fig. B.6, although the activities of PTA and AK were reduced dramatically, the mutant PPTA-Em still had some activities of PTA (40%) and AK (20%). The smaller decrease in the PTA activity is probably because the cloned pta fragment is near the stop codon of the gene and after recombination, most part of the pta gene is intact on the chromosome. However, the lowered PTA and AK activities in the mutant were more likely from other enzymes that also can produce acetate from the same substrates (Rogers and Gottschalk, 1993). The mutant also had a higher BK activity (~135%) and similar PTB activity, as compared to the wild type strain. The greatly reduced AK enzyme activity in PPTA-Em also indicates that the ack gene lies downstream from pta gene in the same operon. After growing the mutant in the medium without Em for ~10 generations (48 h), no differences in the key enzyme activities were detected as compared to the mutant in the antibiotics-containing medium, indicating no revertants (data not shown). Also, there was no obvious change in cell growth and acid production kinetics in repeated batch fermentations even in the absence of the antibiotics (data not shown). It thus can be concluded that the mutant with gene mutation resulted from the homologous recombination on the chromosome is stable and can be maintained without using the antibiotics in long-term fermentation.
30
Fermentation Kinetics Fig. B.7 shows the kinetics of fed-batch fermentations with the mutant and the wild type strains. The mutant grew exponentially in the first fed-batch and then entered the stationary phase. It continued to produce butyrate until the butyrate concentration reached 32.5 g/L, which was much higher than that obtained in the wild-type fermentation (20.2 g/L). However, a significant amount of acetate was still produced by the mutant and reached ~4.28 g/L. It was found that the mutant had a lower specific growth rate than that of the wild type, although its cell yield appeared to be higher. Table 2 compares the fermentation results from the mutant and the wild type. It is clear that pta deletion resulted in lower acetate yield, higher butyrate yield, final concentration, and productivity, and consequently, higher selectivity of butyrate over acetate. Besides the greatly increased final butyrate concentration produced by the mutant, the butyrate yield was also increased, from 0.33 g/g by the wild type to 0.38 g/g by the mutant, and the acetate yield decreased from 0.067 g/g by the wild type to 0.058 g/g by the mutant. There was significant improvement in butyrate productivity by the mutant (0.63 g/L·h), which was about 1.9 fold higher than that of the wild type (0.33 g/L·h). However, inactivation of the pta gene did not completely eliminate acetate formation, indicating that additional acetate-forming enzymes were probably present in C. tyrobutyricum. Also, the higher butyrate concentration produced by the mutant in the fed-batch fermentation suggested a phenotypic change in its butyrate tolerance, which was unexpected in the original experimental design. It is noted that the carbon balance in the fermentation was close to 100% for both the wild type (95.3%) and the mutant (100%) (see Table 2), indicating a complete recovery of carbon in the fermentation products and cells from the substrate, glucose. Butyrate Tolerance To determine the phenotypic change about butyrate tolerance in mutant strain, cells were grown as free-cell suspension cultures at different initial butyrate concentrations (0 ~ 15 g/L). The specific growth rates determined from the growth data are shown as the relative growth rate with the rate at zero initial butyrate concentration being 100%. As shown in Fig. B.8, the pta-deleted mutant had a much higher tolerance to butyric acid than the wild type. At 15 g/L of butyric acid, the mutant retained ~30% of its maximum growth rate as compared to less than 10% in the wild type. The growth inhibition by butyric acid followed the non-competitive inhibition kinetics with the inhibition rate constants KP equal to 1.59 g/L and 5.56 g/L for the wild type and mutant, respectively. It is clear that butyric acid strongly inhibited cell growth of the wild type but not as strongly to the mutant. DISCUSSION Cloning of C. tyrobutyricum The partial pta gene in C. tyrobutyricum ATCC 25755 was successfully cloned and sequenced using degenerate primers. One integrational plasmid (pPTA-Em) was constructed with the cloned pta fragment, which was then introduced into the chromosomal DNA of the parental bacterium via electroporation and homologous recombination, and the pta gene on the chromosome was successfully inactivated. This is the first time a genetically engineered mutant of C. tyrobutyricum has been successfully created for butyric acid fermentation. Although similar cloning work has been done with other Clostridia species, the cloning procedures for C. tyrobutyricum used in this work were developed after careful optimization. For PCR
31
amplification, the optimal Mg2+ concentration in the buffer was found to be 2.5 mM and the optimal primer annealing temperature was 48°C. Decreasing the annealing temperature reduced the reaction specificity and enhanced the incorrect anneal of the degenerate primers. The electroporation method to transform plasmids into C. tyrobutyricum was developed after optimizing the conditions used in preparing the competent cells, the selection of an appropriate electroporation buffer, and the electroporation gene pulser parameters. The choice of electroporation buffer was important to transform C. tyrobutyricum. Several electroporation buffers referred in the literature (Phillips-Jones, 1995), including 15% glycerol, 10% (w/v) PEG 8000, SP buffer (270 mM sucrose, 5 mM NaH2PO4, pH 7.4) and the SMP buffer (270 mM sucrose, 1 mM MgCl2, 7 mM sodium phosphate, pH 7.4) were evaluated, and the last one was found to work the best for C. tyrobutyricum. The highest transformation efficiency was obtained by using mid-log phase cells (OD600 = 0.8-1.0) instead of late-log phase (OD600 = ~2.0). This result is similar to that observed with C. botulinum (Zhou and Johnson, 1993) and C. acetobutylicum DSM 792 (Nakotte, 1998), but different from the result obtained in C. perfringens, in which the optimal transformation efficiency was found with cells harvested from the late-log phase (Allen and Blaschek, 1990) or the stationary phase (Phillips-Jones, 1990). The gene pulser parameters, including the voltage 2.5 kV with the field strength of 6.25 kV/cm and the electrical resistance 600 Ω with a capacitance 25 µF, were applied in electroporation. It is found that decreasing the discharge to 2.0 kV and increasing the resistance to ∞ did not improve the transformation efficiency with C. tyrobutyricum. The pulse duration under the optimized conditions was 6.3-7.5 ms. Also, the transformation efficiency of C. tyrobutyricum by electroporation was enhanced with the addition of DL-threonine in the medium, which helped to weaken the cell wall of gram-positive microorganism by incorporation of the D-isomer (van der Lelie et al., 1988). It is noted that the optimized transformation conditions are somewhat different from the ones previously reported and commonly used for other clostridia. No transformed colonies of C. tyrobutyricum could be obtained under the previously reported electroporation conditions. The improved electroporation method provides an efficient way to introduce foreign genes into C. tyrobutyricum with a transformation efficiency of 1 colony per µg DNA for non-replicative plasmids, which is similar to the result for C. acetobutylicum ATCC 824 (Green et al., 1996). It opens the way for future molecular genetic studies in C. tyrobutyricum. Protein Expression In this work, both SDS-PAGE gel and two-dimensional protein electrophoresis (2DE) maps showed that at least two proteins (spot #57 and #60) found in the wild type were not expressed in the pta-deleted mutant. These missing proteins are most likely to include PTA and AK, but cannot be identified in this work due to lack of proteomic information for C. tyrobutyricum. Phosphotransacetylase (PTA) and acetate kinase (AK) from several microorganisms have been purified and characterized (Boyton, et al., 1996). PTA is a monomer with a molecular weight of approximate 36.2 kDa in C. acetobutylicum, 88 kDa in C. thermoaceticum, and 27 kDa in S. pyogenes. AK is a dimer of two identical subunits with various molecular masses in different species, 44.3 kDa in C. acetobutylicum and 60 kDa in C. thermoaceticum. Only the PI values of PTA and AK for some E. coli strains are available in the literature (Kirkpatrick et al., 2001; Peng and Shimizu, 2003). The large variations in PI and molecular weight for AK and PTA from different microorganisms make it difficult to identify AK and PTA on the 2DE gels. Further
32
studies and analysis of the proteins isolated from the 2DE gels was necessary to confirm their identities. Effects of Inactivating pta Gene Gene inactivation has been proved to be a feasible genetic engineering technique for studying molecular genetics in C. acetobutylicum (Harris, et al., 2000), but has not been applied to C. tyrobutyricum. In this work, the pta gene in the acetate-forming pathway in C. tyrobutyricum was inactivated by integration of a non-replicative plasmid on the chromosome. The enzyme activity assays showed that both PTA and AK activities were reduced greatly in the pta-deleted mutant, suggesting that deletion of the pta gene also resulted in the inactivation of ack gene. This finding is consistent with the study of the pta-deleted mutant of C. acetobutylicum (Green et al., 1996), and suggests that the acetic acid-forming genes, pta and ack, exist in the same operon with pta preceding ack (Boynton, et al., 1996). However, PTA and AK activities were still detected in the mutant, which probably came from other enzymes working with the same substrates as PTA and AK. The specific activities of PTB and BK enzymes involving in the formation of butyrate were either unaffected or increased. It is possible that the deletion of the acetate formation pathway had pushed more carbon and energy sources to flow through the butyrate formation pathway, which required a higher BK enzyme activity for the increased flux. Fermentation study showed that the pta-deleted mutant produced more butyrate from glucose but was still capable of producing acetate. The butyrate yield increased ~15% while acetate yield decreased only ~14%, even though the specific activities of PTA and AK in the mutant had been reduced by more than 50% as compared to the wild type. The chance for a revertant to appear in the fermentation was low even when Em was not included in the fermentation medium. Therefore, there must be other enzymes besides PTA and AK in C. tyrobutyricum that also can produce acetate from acetyl-CoA and perhaps other substrates as well. For example, CoA transferase can catalyze the formation of acetate from acetyl-CoA. This enzyme has been found in some clostridia bacteria (Rogers and Gottschalk, 1993), and could also be present in C. tyrobutyricum. It also has been reported that PTB and BK exhibited broad substrate specificities with C2- to C6-chained acyl-CoA and carboxylic acid compounds in C. acetobutylicum (Wiesenborn et al., 1989; Hartmanis, 1987). The butyrate-producing enzymes PTB and BK in C. tyrobutyricum mutant might have been responsible for the observed acetate production in the fermentation. It is also possible that there is additional acetate formation pathway catalyzed by other enzymes in C. tyrobutyricum, as was reported for some species (Lindmark, 1976). Possible presence of PTA and AK isozymes also could not be ruled out. Two acetate kinase isozymes from spirochete MA-2 cell extracts (Harwood and Canale-Parola, 1982) and a butyrate kinase isoenzyme (BKII) in C. acetobutylicum ATCC 824 (Huang, et. al, 2000) have been reported. Inactivation of pta also had a significant effect on cell growth. Compared to the wildtype, the mutant PPTA-Em had a reduced specific growth rate, but had a higher cell yield from glucose (Table 2). This observation is similar to that found in pta or buk inactivated C. acetobutylicum (Green et al., 1996). Since both acid-formation pathways are responsible for generating energy (ATP) for cells, a reduced acetate production may impose a metabolic burden on cells. A feasible cellular response to this metabolic burden is the elevation of the flux through the alternate ATP-generation pathway, namely butyrate formation, to avoid any significant loss in overall cell growth. This metabolic change might have resulted in the observed increase in cellular BK enzyme activity. Since the acetate formation pathway can produce more ATP per
33
glucose metabolized than the butyrate formation pathway, the elimination of acetate metabolic pathway resulted in reduced energy production efficiency, which in turn could direct more substrates towards the butyrate formation pathway to offset loss in the ATP generation and overall cell growth. This also could explain why biomass production was increased in the mutant even though the specific growth rate was lowered. Compared to the wild type, the butyrate tolerance of pta-deleted mutant had significantly enhanced butyrate tolerance (Fig. 8), which is unexpected but can explain the observed higher butyrate productivity and final butyrate concentration in the fermentation with the mutant. It had been noted that PTA in C. tyrobutyricum was more strongly inhibited by butyric acid than PTB (Zhu and Yang, 2003). It is thus possible that by disrupting the butyrate-sensitive PTA and acetate-forming pathway, the mutant became less sensitive to butyrate inhibition since they used mainly the butyrate-forming pathway to generate ATP needed for biosynthesis and maintaining a functional pH gradient across the cell membrane. It should be noted, however, that cultures adapted and grown in a fibrous-bed bioreactor (FBB) were much more tolerant to butyrate inhibition and produced more butyric acid from glucose than those obtained in free-cell fermentations (Zhu and Yang, 2003). With the FBB, butyric acid can be produced at a concentration of higher than 50 g/L with a high butyrate yield of more than 0.5 g/g glucose. CONCLUSION This is the first genetic engineering study of C. tyrobutyricum for enhanced butyric acid fermentation. In this work, the cloning procedures for C. tyrobutyricum were optimized and gene inactivation experiments were carried out to develop mutant strains of C. tyrobutyricum for butyrate production from glucose with improved productivity, yield, final product concentration, and butyrate tolerance. The manipulation of acid-forming pathways by gene inactivation proved to be feasible for obtaining metabolically advantageous mutants for butyrate production from glucose. However, gene manipulations in the metabolic pathway can lead to unexpected changes in protein expression pattern and other phenotypes that require further studies. REFERENCES Allen SP, Blaschek HP. 1990. Factors involved in the electroporation-induced transformation of Clostridium perfringens. FEMS Microbiol. Lett. 70:217-220. Andersch W, Bahl H, Gottschalk G. 1983. Levels of enzymes involved in acetate, butyrate, acetone and butanol formation by Clostridium acetobutylicum. Eur J Appl Microbiol Biotechnol 17:327-332. Boynton ZL, Bennett GN, Rudolph FB. 1996. Cloning, sequencing, and expression of genes encoding phosphotransacetylase and acetate kinase from Clostridium acetobutylicum ATCC 824. Appl Environ Microbiol 62:2758-2766. Campbell AM. 1962. Episomes. Adv Genet 11:101-146. Cary JW, Peterson DJ, Papoutsakis ET, Bennett GN. 1988. Cloning and expression of Clostridium acetobutylicum phosphotransbutyrylase and butyrate kinase genes in Escherichia coli. J Bacteriol 170:4613-4618. Green EM, Bennett GN. 1998. Genetic manipulation of acid and solvent formation in Clostridium acetobutylicum ATCC 824. Biotechnol Bioeng 58:215-221. Green EM, Boynton ZL, Harris LM, Rudolph FB, Papoutsakis ET, Bennett GN. 1996. Genetic manipulation of acid formation pathways by gene inactivation in Clostridium acetobutylicum ATCC 824. Microbiol 142:2079-2086.
34
Guérout-Fleury AM, Shazand K, Frandsen N, Stragier P. 1995. Antibiotic-resistance cassettes for Bacillus subtilis. Gene 167:335-336. Harris LM, Desai RP, Welker NE, Papoutsakis ET. 2000. Characterization of recombinant strains of the Clostridium acetobutylicum butyrate kinase inactivation mutant: need for new phenomenological models for solventogenesis and butanol inhibition? Biotechnol Bioeng 67:111. Hartmanis MGN. 1987. Butyrate kinase from Clostridium acetobutylicum. J Biol Chem 262:617621. Harwood CS, Caale-Parola E. 1982. Properties of acetate kinase isozymes and a branched-chain fatty kinase from a spirochete. J Bacteriol 152:246-254. Huang KX, Huang S, Rudolph FB, Bennett GN. 2000. Identification and characterization of a second butyrate kinase from Clostridium acetobutylicum ATCC 824. J Mol Microbiol Biotechnol 2:33-38. Huang Y L, Mann K, Novak J M, Yang S T. 1998. Acetic acid production from fructose by Clostridium formicoaceticum immobilized in a fibrous-bed bioreactor. Biotechnol Prog 14:800806. Kakuda H, Hosono K, Shiroshi K, Ichihara S. 1994. Identification and characterization of the ackA (acetate kinase A) - pta (phosphotransacetylase) operon and complementation analysis of acetate utilization by an ackA-pta deletion mutant of Escherichia coli. J Biochem 116:916-922. Kirkpatrick C, Maurer LM, Oyelakin NE, Yoncheva YN, Mauer R, Slonczewski J L. 2001. Acetate and formate stress: opposite responses in the proteome of Escherichia coli. J Bacterial 183:6466-6477. Latimer MT, Fery JG. 1993. Cloning, sequence analysis, and hyperexpression of the genes encoding phosphotransacetylase and acetate kinase from Methanosarcina thermophila. J Bacterial 175:6822-6829. Lindmark DG. 1976. Acetate production by Tritrichomonas foetus. Biochem Parasites HostParasite Relat Proc Int Sym 10:15-21. Matsuyama AH, Yamamoto H, Nakano E. 1989. Cloning, expression, and nucleotide sequences of the Escherichia coli K-12 ackA gene. J bacterial 171:77-580. Michel-Savin D, Marchal R, Vandecasteele J P. 1990. Control of the selectivity of butyric acid production and improvement of fermentation performance with Clostridium tyrobutyricum. Appl Microbiol Biotechnol 32:387-392. Michel-Savin D, Marchal R, Vandecasteele J P. 1990. Butyrate production in continuous culture of Clostridium tyrobutyricum: effect of end-product inhibition. Appl Microbiol Biotechnol 33:127-131. Nakotte S, Schaffer S, Böhringer M, Dürrre P. 1998. Electroporation of, plasmid isolation from and plasmid conservation in Clostridium acetobutylicum DSM 792. Appl Microbiol Biotechnol 50:564-567. Papoutsakis ET, Meyer CL. 1985. Equations and calculations of product yields and preferred pathways for butanediol and mixed-acid fermentations. Biotechnol Bioeng 27:50-66. Peng L, Shimizu K. 2003. Global metabolic regulation analysis for Escherichia coli K12 based on protein expression by 2-dimensional electrophoresis and enzyme activity measurement. Appl Microbiol Biotechnol 61:163-178. Phillips-Jones M K. 1990. Plasmid transformation of Clostridium perfringens by electroporation methods. FEMS Microbiol Lett 66:221-226.
35
Phillips-Jones MK. 1995. Introduction of recombinant DNA into Clostridium spp. In: Nickoloff JA, editor. Methods in Molecular Biology, vol. 47. Electroporation protocols for microorganisms. New York: Hunana Press Inc. p 227-235. Richards DF, Linnett PE, Oultram JD, Young M. 1988. Restriction endonucleases in Clostridium pasteurianum ATCC 6013 and C. thermohydrosulfuricum DSM 568. J Gen Microbiol 134:31513157. Rogers P, Gottschalk G. 1993. Biochemistry and regulation of acid and solvent production in Clostridia. In: Woods DR, editor. The clostridia and biotechnology. Massachusetts: ButterworthHeinemann. p 25-50. Rose IA. 1955. Acetate kinase of bacteria (acetokinase). Methods Enzymol 1:591-595. van Andel JG, Zouttberg GR, Crabbendam PM, Breure AM. 1985. Glucose fermentation by Clostridium butyricum grown under a self generated gas atmosphere in chemostat culture. Appl Microbiol Biotechnol 23:21-26. van der Lelie D, van der Vossen JMBM, Venema G. 1988. Effect of plasmid incompatibility on DNA transfer to Streptococcus cremoris. Appl Environ Microbiol 54:865-871. Vandak D, Zigova J, Sturdik E, Schlosser S. 1997. Evaluation of solvent and pH for extractive fermentation of butyric acid. Process Biochemistry 32:245-251. Wiesenborn DP, Rudolph FB, Papoutsakis ET. 1989. Phosphotransbutyrylase from Clostridium acetobutylicum ATCC 824 and its role in acidogenesis. Appl Environ Microbiol 55:317-322. Wu Z, Yang ST. 2003. Extractive fermentation for butyric acid production from glucose by Clostridium tyrobutyricum. Biotechnol Bioeng 82:93-102. Zhou Y, Johnson EA. 1993. Genetic transformation of Clostridium Botulinum Hall A by electroporation. Biotechnol Lett 15:121-126. Zhu Y, Wu Z, Yang ST. 2002. Butyric acid production from acid hydrolysate of corn fiber by Clostridium tyrobutyricum in a fibrous-bed bioreactor. Process Biochemistry, 38:657-666. Zhu Y, Yang ST. 2003. Adaptation of Clostridium tyrobutyricum for enhanced tolerance to butyric acid in a fibrous-bed bioreactor. Biotechnol Prog, 19:365-372. Zigova J, Sturdik E, Vandak D, Schlosser S. 1999. Butyric acid production by Clostridium butyricum with integrated extraction and pertraction. Process Biochemistry 34:835-843.
36
Table 1. Bacterial strains and plasmids Strain/plasmid
Characteristic
Source/reference
Ems
ATCC
pta- Emr
Insertion of pPTA-Em into ATCC 25755; this study
recA1 Apr
Invitrogen
Apr Kmr
Invitrogen
Strain C. tyrobutyricum ATCC 25755 PPTA-Em E. coli INVαF’ Plasmid pCR 2.1 pCR-PTA
a
r
r
Ap Km
This study
pCR-PTA1
Apr
This study
pDG 647 pPTA-Em b
r
r
Ap Em Apr Emr
Guérout-Fleury et al. (1995) This study
a
pCR-PTA was constructed by insertion of 0.73-kb pta fragment into pCR 2.1. pPTA-Em is the non-replicative integrational plasmid. Note: Abbreviations: pta-, phosphotransacetylase gene deleted; Apr, ampicillin resistant; Kmr, kanamycin r resistant; Em , erythromycin resistant; recA1, homologous recombination abolished. b
37
Table 2. Comparison of fermentation results with the pta-deleted mutant PPTA-EM and the wild type strain of C. tyrobutyricum in fed-batch cultures controlled at pH 6.0, 37 ºC. Products
Wild-type
PPTA-Em
0.19 ± 0.02
0.12 ± 0.01
(g/g)
0.11 ± 0.02
0.16 ± 0.02
(mole C/mole)*
0.77 ± 0.14
1.12 ± 0.14
20.2
32.5
(g/g)
0.33 ± 0.03
0.38 ± 0.03
(mole/mole)
0.68 ± 0.06
0.78 ± 0.06
Productivity (g/L·h)
0.33
0.63
Max. Concentration (g/L)
3.57
4.28
0.067 ± 0.003
0.058 ± 0.004
0.20 ± 0.01
0.17 ± 0.01
Butyrate/Acetate Ratio (g/g)
4.95
6.55
Carbon dioxide (mole/mole)
1.83 ± 0.12
1.51 ± 0.09
Carbon balance (%)
95.3 ± 4.22
101 ± 3.81
µ (h-1) Cell Yield
Max Concentration (g/L) Butyrate
Yield
Acetate
(g/g) Yield (mole/mole)
*Based on that the carbon content of cell biomass is 46.7% for Clostridia (Papoutsakis and Meyer, 1984)
38
EcoRI
EcoRI
pta’ (0.7 kb)
pCR-PTA (4.65 kb)
HindIII
SphI HindIII
EcoRI
EcoRI SphI
pta’ f1
DELETE
pCR-PTA1
pCR 2.1
ColE1
(3.15 kb)
(3.9 kb)
ColE1 Km
Apr
Apr
r
SphI
HindIII Digestion SmaI
EcoRI HindIII
pta’
SacI r
Em (1.6 kb)
HindIII
HindIII
EcoRI SphI
SacI
pDG647 (4.3 kb)
Em
pPTA-Em
r
(4.75 kb)
Apr
ColE1 SmaI
HindIII
FIG. B.1. Construction of integrational plasmid pPTA-Em with one 0.7-kb pta fragment cloned from C. tyrobutyricum ATCC 25755. The directions of each gene are shown by arrows. Some important restriction sites used in this work are indicated. Abbreviations: pta, partial pta gene; f1, f1 filamentous phage origin of replication with helper phage; Kmr, kanamycin resistance gene; Apr, ampicillin resistance gene; Emr, erythromycin resistance gene; ColE1, compatibility group origin of replication in E. coli.
39
Cac Cty Mes Pde Eco Bsu Myc
1 1 1 1 1 1 1
ELRKHKGMTIEKSEKMVRDPLYFATMALKDGYVDGMVSGAVHTTGDLLRPGLQIIKTAPG ELRKHKGMTPDKANKIVRDPLYFATMMVKLGDADGLVSGSIHTTGDLLRPGLQIVKTAPG ELRKHKGITLENAAEIMSDYVYFAVMMAKLGEVDGVVSGAAHSSSDTLRPAVQIVKTAKG RMRAARGMTAERALTEMRDPIRQAAMRVRLGQADGTVGGAVATTADTVRAALQIIGKAPG ELRKNKGMTETVAREQLEDNVVLGTLMLEQDEVDGLVSGAVHTTANTIRPPLQLIKTAPG -ERRKGKATEEQARKALLDENYFGTMLVYKGLADGLVSGAAHSTADTVRPALQIIKTKEG EKRKHKGMDLKEAQKFVRDPSSLAATLVALKVVDGEVCGKEYATKDTLRPALQLLATG--
Cac Cty Mes Pde Eco Bsu Myc
61 61 61 61 61 60 59
VKIVSGFFVMIIPDCDYGEEGLLLFADCAVNPNPTSDELADIAITTAETARKLCNVEPKV TSVVSSIFMMEVPNCDLGDNGFLLFSDCAVNPVPNTEQLAAIAISTAETAKSLCGMDPKV AALASAFFIISVPDCEYGSDGTFLFADSGMVEMPSVEDVANIAVISAKTFELLVQDVPKV AGIVSSFFLMLSCGPGAPVRGGMIFADCGLVIQPDARELAAIALSAADSCRRILAEEPRV SSLVSSVFFMLLP------EQVYVYGDCAINPDPTAEQLAEIAIQSADSAAAFG-IEPRV VKKTSGVFIMARG------EEQYVFADCAINIAPDSQDLAEIAIESANTAKMFD-IEPRV -NFVSSVFIMEKG------EERLYFTDCAFAVYPNSQELATIAENTFNFAKSLNEDEIKM
Cac Cty Mes Pde Eco Bsu Myc
121 121 121 121 114 113 112
AMLSFSTMGGAKGEMVDKVKNAVEITKKFRPH--LAIDGELQLDAAIDSEVAALKAPSSN AMLSFSTKGSAQHENVDKVREATKLAKQMQPD--LKIDGELQLDASLIQEVANLKAPGSP AMLSYSTKGSAKSKLTEATIASTKLAQELAPD--IAIDGELQVDAAIVPKVAASKAPGSP ALLSFSTAGSAEHPSLGRIREALALIRAAAPG--LEVDGEMQFDAALDEAIRARKAPESP AMLSYSTGTSGAGSDVEKVREATRLAQEKRPD--LMIDGPLQYDAAVMADVAKSKAPNSP AMLSFSTKGSAKSDETEKVADAVKIAKEKAPE--LTLDGEFQFDAAFVPSVAEKKAPDSE AFLSYSTLGSGKGEMVDKVVLATKLFLEKHPELHQSVCGELQFDAAFVEKVRLQKAPQLT
Cac Cty Mes Pde Eco Bsu Myc
179 179 179 179 172 171 172
VAGNANVLVFPDLQTGNIGYKLVQRFAKAKAIGPICQGFAKPINDLSRSCSSEDIVNVVA VAGKANVLIFPELQAGNIGYKLVQRFAKAEAIGPICQGFAKPINDLSRGCSSDDIVNVVA VAGKANVFIFPDLNCGNIAYKIAQRLAKAEAYGPITQGLAKPINDLSRGCSDEDIVGAVA LTGRPNVFVFPDLADGNIGYKIAERLAGLTAIGPILQGLAKPANDLSRACSVKDIVNATA VAGRATVFIFPDLNTGNTTYKAVQRSADLISIGPMLQGMRKPVNDLSRGALVDDIVYTIA IKGDANVFVFPSLEAGNIGYKIAQRLGNFEAVGPILQGLNMPVNDLSRGCNAEDVYNLAL WKNSANIYVFPNLDAGNIAYKIAQRLGGYDAIGPIVLGLSSPVNDLSRGASVSDIFNVGI
Cac Cty Mes Pde Eco Bsu Myc
239 239 239 239 232 231 232
ITVVQA ITAAQA ITCVQA ITAMQT LTAIQS ITAAQA ITAAQA
FIG. B.2. Alignment of partial amino acid sequences of PTA from C. acetobutylicum (Cac; GBAN U38234), C. tyrobutyricum (Cty; GBAN AY572855), Methanosarcina thermophila (Mes; GBAN L23147), P. denitrificans (Pde; GBAN U08864), E. coli (Eco; GBAN D21123), B. subtilis (Bsu; GBAN; X73124), and Mycoplasma genitalium (Myc; GBAN L43967).
40
Erm gene
Non-replicative plasmid
pPTA-Em 4.8 kb
SmaI
pta fragment
Homologous recombination SmaI
SmaI
6.0 kb pta gene
Wild type chromosome
SmaI
4.5 kb
SmaI
pta gene deleted mutant
A.
pta frag. 1 pta 2
10.8 kb = 4.5 kb + 6.3 kb = 6 kb + 4.8 kb
r
pta probe
Em probe 1
SmaI
6.3 kb Erm
pta 1 pta frag. 2
2
1
2 kb 6.3 6.0
4.5
B. FIG. B.3. DNA hybridization. (A) Homologous recombination of plasmid pPTA-Em containing partial pta gene with the chromosome, resulting in the disruption of pta gene. The restriction sites of SmaI and the DNA fragment sizes after cut are indicated. (B) Southern blots with Emr probe and pta probe. Wild type (Lane 1) showed no Emr and a 6.0 kb pta-containing DNA. The mutant PPTA-Em (Lane 2) showed both Emr and 2 pta-containing DNAs (6.3 kb and 4.5 kb). The total size of these two DNAs is the same as the total size of the plasmid (4.8 kb) and the DNA containing the undisrupted pta (6.0 kb). 41
FIG. B.4. SDS polyacrylamide gel electrophoresis of cellular proteins from C. tyrobutyricum. (Lane 1: PPTA-Em mutant; Lane 2: Molecular weight markers; Lane 3: Wild type.) The mutant PPTA-Em had a 32 kDa (approximate) band with greatly reduced expression as compared to that of wild type.
42
FIG. B.5. Two-dimensional protein electrophoresis maps of cell extracts of C. tyrobutyricum wild type (top) and mutant PPTA-Em (bottom). The horizontal axis shows the approximate PI range of IEF step. The vertical axis shows the approximate molecular weight.
43
160
Relative activity (%)
140 120 100 80 60 40 20 0 PTA
AK
PTB
BK
FIG. B.6. Relative activities of key enzymes in acetate and butyrate-forming pathways in the PPTA-Em mutant as compared with the wild type. All enzyme activities in PPTA-Em are expressed as the percentage of the specific enzyme activities in the wild-type of C. tyrobutyricum ATCC 25755.
44
40
8
30
6
20
4
OD600
Concentration (g/L)
Wild Type
Glucose Acetate Butyrate
10
2
OD600
0
0 0
10
20
30
40
50
60
70
80
Time (h) 50
8
PPTA-Em 6
30 4
OD600
Concentration (g/L)
40
20 Glucose Acetic Butyric OD
10
0
2
0 0
10
20
30
40
50
60
70
80
90
100
Time (h)
FIG. B.7. Fermentation kinetics of C. tyrobutyricum wild-type (top) and pta-deleted mutant (bottom). The fed-batch fermentations were carried out in a 5-L fermentor at 37oC, pH 6.0. OD600 (×), glucose concentration (■), butyrate concentration (○) and acetate concentration (∆).
45
Relative Growth Rate (%)
100
80
µ=
µm K P KP + P
60
K P = 5.56
Mutant 40 Wild Type
20
K P = 1.59 0 0
5
10
15
20
Butyrate Concentration (g/L)
FIG. B.8. Noncompetitive inhibition of butyric acid on cell growth of C. tyrobutyricum wild type (∆) and PPTA-Em (○). The relative specific growth rate with the one at zero butyrate concentration being 100% was used here for easier comparison between the wild type and the mutant.
46
C. Optimization and Scale-Up of Fibrous Bed Bioreactor Cell immobilization has been studied in the laboratory during the last 20 years as a method to improve the performance and economics of many fermentation processes. Fibrous matrices have been developed as the media for cell immobilization because of its high specific surface area, high void volume, low cost, high mechanical strength, high permeability, and low pressure drop. The fibrous bed bioreactor (FBB) with cells immobilized in the fibrous matrix packed in the reactor has been successfully used for several organic acid fermentations, including butyric acid in Phase I, with greatly increased reactor productivity, final product concentration, and product yield. Other advantages of the FBB include efficient and continuous operation without requiring repeated inoculation, elimination of cell lag phase, good long-term stability, and easier downstream processing. The great reactor performance of the FBB can be attributed to the high viable cell density maintained in the bioreactor as a result of the unique cell immobilization mechanism within the porous fibrous matrix. Conventional immobilized cell fermentation usually lose fermentation productivity over a long operation period when the cells are used continually or repeated in a continuous or fed-batch fermentation, due to limited mass transfer and accumulation of dead cells. Reactor clogging and channeling often happen, resulting in deteriorated reactor efficiency and consequently an inoperable reactor. Therefore, for stable long-term operation of the bioreactor, cells in the reactor must be continuously renewed to maintain high productivity and to prevent reactor or culture degeneration. Aged, non-viable and non-productive cells are removed immediately and cell density in the bioreactor is controlled to avoid clogging. Understanding the mechanism and factors controlling cell immobilization in the FBB is the first step in optimizing and scaling up the bioreactor for industrial applications. Hydrodynamics and mass transfer in the fibrous bed are affected by the fibrous bed packing design, and are critical to the fermentation performance. These were investigated so that the reactor was properly scaled up. Also, the feasibility of engineering and construction of a large-scale fibrous bed bioreactor was also evaluated and carried out. Cell immobilization (adsorption) on fibrous matrix Cell immobilization on fibrous matrices can occur in three stages: transport of cells from the bulk phase to the fiber surface, adhesion of cells to the surface, and subsequent colonization along the surface. Cell-support adhesion is the key step in controlling cell immobilization in the FBB and is thus the focus of this study. It is governed by non-specific physicochemical interactions and by more specific adhesin-receptor binding events. Since the fibrous materials used in the FBB are essentially inert to the cells, attention was focused on non-specific factors only and the cells adhering to the substrates can be regarded as colloidal particles. The physicochemical forces of attraction and repulsion include long-range forces, e.g., electrostatic interactions and van der Waals forces, and short-range interactions, e.g., dipole interactions, chemical bonding, and hydrophobic interactions (McEldowney and Fletcher, 1986). Most gram-negative and many gram-positive bacteria are negatively charged, as are many solid surfaces. As a result, electrostatic repulsion between the bacteria and solid surfaces prevent their contact. If the microbial cells and the substratum come close together (ca.