tem kernel [4] with code that utilizes hardware performance monitoring counters .... ber of performance counters offered by the Pentium-4 pro- cessor, 189 ...
Profiling Interrupt Handler Performance through Kernel Instrumentation Branden Moore, Thomas Slabach, Lambert Schaelicke Department of Computer Science and Engineering University of Notre Dame {bmoore, tslabach, lambert}@cse.nd.edu Abstract As a result of technology trends towards multi-gigahertz processors, the I/O system is becoming a critical bottleneck for many applications. Interrupts are a major aspect of most device drivers. Characterizing interrupt performance and its relation to architectural trends is important for understanding and improving I/O subsystem performance. Kernel instrumentation in combination with performance counters is able to overcome the limitations of microbenchmarks when measuring interrupts. A comparative analysis of a range of IA-32 based systems reveals that interrupt handler code exhibits only a low degree of instruction-level parallelism. Consequently, the trend towards deeper processor pipelines and smaller caches to maximize clock frequency can be detrimental to interrupt handling performance.
1. Introduction As semiconductor technology moves processor performace into the multi-gigahertz range, the input/output subsystem increasingly affects overall system performance. The shift towards ubiquitous network connectivity and multimedia content further amplifies the need for the efficient transfer of data into and out of computer systems. Interrupts are one important component of I/O software as they handle a wide variety of asynchronous events. Inefficient interrupt handling not only slows down the communication between the host processor and I/O device, it also incurs significant processing time at the expense of application code. For example, on a fully saturated 100 Mb/s Ethernet link with an average packet size of 512 bytes, the network adapter may generate over 20,000 interrupts per second. If each interrupt takes 15µsec, over 30% of the processor time may be devoted to interrupt handling. Continuously increasing data rates of high-speed I/O devices such as network adapters and hard disks further emphasize the need for efficient interrupt handling. Quantifying the inter-
rupt handling capabilities of current systems, determining sources of deficiencies and relating interrupt cost to architectural trends is an important step towards optimizing the I/O performance of computer systems. Measuring interrupt cost is complicated by several factors. Unlike many other performance characteristics, interrupts can not directly be observed at the application level because they are part of a larger kernel operation that can only be measured in its entirety. Furthermore, interrupts respond to asynchronous events that are not easily controlled by application-level software. This work addresses these shortcomings by instrumenting the Linux operating system kernel [4] with code that utilizes hardware performance monitoring counters present in various processors of the Intel IA-32 family [11]. In addition to measuring execution time in cycles, these counters allow accurate measurements of various microarchitectural aspects such as instruction decode and graduation counts, branch prediction behavior and cache misses, thus providing further insights into the cost of interrupt handling. The instrumented kernel provides detailed interrupt performance measurements for disk and network interrupts under varying system conditions on a number of platforms based on the same IA-32 ISA and operating system. Results show that in Linux network interrupts are generally more expensive than disk interrupts, and that there is significant variation in interrupt cost between idle and highly-utilized systems. Furthermore, interrupt handler code exhibits uniformly low instruction level-parallelism, largely due to high level-1 cache miss rates. As a result, interrupt performance does not benefit from modern deeply-pipeline microarchitectures despite their significantly higher clock frequency. The following section summarizes previous work in the areas of operating system measurements, interrupt performance analysis and performance monitoring counter support. Section 3 describes in detail the experimental setup and kernel modifications. Measurement results are presented in Section 4. Section 5 outlines directions for future work and Section 6 summarizes the approach and findings of this work.
2. Related Work A wide variety of techniques exists to measure and describe computer system performance. Application-level benchmarks such as SPECweb [22] and various TPC queries [16] approximate the complex behavior of real applications and evaluate several components of system performance simultaneously. However, while such complex benchmarks can provide an accurate view of overall system performance, they are unable to focus on individual aspects such as interrupt or system call costs. Microbenchmarks, on the other hand, are designed to measure components of system performance in isolation. LmBench [13] provides a number of tools to measure architectural and operating system characteristics, including a number of I/O features such as disk and network bandwidth. Since microbenchmarks generally execute as unprivileged user processes, measurements are restricted to effects observable by applications and internal effects such as interrupts can not be characterized with microbenchmarks. While interrupt cost itself is not easily measured by microbenchmarks, the impact interrupts have on applications can be observed by user-level code. For instance, by continuously refreshing the instruction or data cache, and counting the number of cache misses after an interrupt it is possible to measure the cache footprint of interrupt handlers [18]. The portability of this approach allows the comparison of a variety of I/O interrupt handlers on different systems, but it provides little insight into the source of the observed behavior, or into the performance characteristics of the interrupt handler code itself. Profiling is an alternative to direct benchmarking that is particularly useful to characterize regular application performance instead of benchmarks. Profiling tools such as gprof [7] or DCPI [2] perform statistical sampling of the processor state to obtain execution profiles of applications or operating systems. If gathered over a sufficiently long interval, such profiles can provide detailed information about the contribution of individual routines to overall execution time. However, the short execution time of interrupt handling code reduces the probability of sampling the interrupt handler. Furthermore, I/O interrupts and sampling events such as clock interrupts may interact or correlate and thus bias the results of statistical sampling. Direct measurements of operating system behavior usually requires instrumentation of the kernel. A number of tools exist that facilitate the automatic or semiautomatic insertion of profiling code into executables [12,23]. Automating the instrumentation process lets users focus on the measurement task and reduces the risk of introducing errors into the code to be profiled. However, interrupt handler code is a complex combination of carefully hand-optimized assembler code and high-level language routines and is thus chal-
lenging to instrument via automatic tools. Nevertheless, a properly instrumented kernel in combination with a powerful analysis tool can offer important insights into operating system behavior [20]. Special-purpose profiling hardware can significantly extend the capabilities of instrumentation or profiling. For instance, programmable hardware can implement a wide variety of custom counters and timers to measure nearly any aspect of system performance [14, 19]. However, the interplay between profiling hardware and software can be complex and may require intimate knowledge of the system to be measured. Furthermore, the additional cost incurred by the hardware component makes this approach less viable for casual users. In the past few years performance monitoring counters as one form of dedicated profiling hardware have become available in nearly all processors [1, 5, 11, 15, 24]. These counters can be programmed to count a variety of events, ranging from processor cycles and instructions executed to cache misses and system bus stall times. Access to the counter registers is usually privileged and a variety of interfaces that give user-level programs light-weight access have been developed [6, 8, 10, 17, 21]. While invaluable for application developers, most performance-counter support packages are designed to characterize regular applications and are unsuitable to measure the operating system kernel.
3. Methodology 3.1. Kernel Instrumentation Instrumenting the Linux kernel to measure interrupt performance requires three modifications. First, a mechanism is required to configure the performance counters to measure the desired events. Second, the interrupt handler itself must be modified to read the performance counters upon entry and exit and to record the observed values in a known kernel location. Third, an interface to retrieve the measurement samples recorded by the interrupt handler is needed. The kernel instrumentation methodology used in this work deliberately separates these tasks to minimize the interference of the instrumentation with the events to be measured. The instrumented interrupt handler reads the values of all performance counters and the time stamp register and stores them on the stack before saving any other processor registers. Before returning to the interrupted instruction, the same set of counters is read again, and all values are copied to an array in kernel memory for later retrieval. By sampling the performance counters as close to the trap entry and exit as possible, the difference between the observed values is a close approximation of the true interrupt cost. Additional code to copy the counter values into a kernel buffer is executed after the counters are sampled for the second time
and thus does not affect the results. On the Pentium-II/III systems, the instrumentation adds 42 assembler instructions to access the performance counters upon interrupt entry and exit, for an overhead of less than 3.8 percent of the total interrupt execution time. Due to the significantly larger number of performance counters offered by the Pentium-4 processor, 189 assembler instructions are needed to access the performance counters on this CPU, resulting in a performance overhead of 22 percent. However, since counters are accessed in the same order at the beginning and end of the interrupt, the impact on the measurement results of individual counters is even smaller. It is important to note that the programming of the performance counters and the management of sample buffer are not part of the interrupt handler. Instead, these functions are performed by user-level code through extensions of the /proc file system. Individual performance counters are configured by writing to the corresponding files in the /proc file system. The most recently sampled counter values can be read from files associated with the various interrupt classes. This design provides flexible access to the counters for configuration and measurement, while minimizing the impact on the interrupts to be measured.
3.2. Experimental Setup To provide a comprehensive view of I/O interrupt performance, this study analyzes both disk and network interrupts under different system conditions. Hard disks and network adapters are the two most commonly found highperformance I/O devices. Understanding the interrupt handling capabilities of modern systems for these two classes of interrupts is important for a wide variety of applications, ranging from desktop multimedia applications to database and web servers. Each interrupt class is characterized under two system conditions: idle and loaded. The idle system provides only a minimum number of daemon services and executes no other user processes. Except for the interrupt handling code, the processor is idle. The loaded system executes a synthetic load generation program that repeatedly compresses a large region of randomly initialized memory using the GNU zlib compression library. This state corresponds to a system executing a compute-intensive process that fully utilizes the processor, caches and main memory system. In addition to the different system states, each interrupt class is measured when occurring at different rates. High interrupt rates correspond to I/O intensive applications like databases or file servers. Low interrupt rates are representative of applications that perform I/O operations only occasionally, for instance interactive programs like web browsers. Disk interrupts are triggered at a slow rate by repeatedly
invoking the dd utility to copy a small file. High disk interrupt rates are generated by a program that reads a large file without performing any other processing on the data. To ensure that each file read request results in an interrupt, the individual request sizes are larger than the file system block size, and the file is read backwards, thus defeating the read-ahead mechanism of the file system. Network interrupts are caused by issuing a series of ping commands on a remote machine. Frequent network interrupts are generated by a TCP connection between the test system and another host using the ttcp utility to transfer a large block of data without any further processing. This experimental design results in the following four measurement conditions for each interrupt class. • • • •
no load, low interrupt rate no load, high interrupt rate load, low interrupt rate load, high interrupt rate
Under each condition, the most recent performance counter values are retrieved by a script every five seconds, for a total period of 500 seconds. Sampling the counter values at such relatively long intervals minimizes the interference of the script with the measurements. The results reported in the following sections are the arithmetic mean of the 100 samples obtained for each test. In all cases, the combined memory requirements of the load generation process, test script and interrupt trigger do not exceed the available physical memory to avoid swapping to disk during the experiments.
3.3. Data Collected In addition to recording the Time Stamp Counter during each interrupt, the Performance Monitoring Counters (PMCs) are programmed and sampled to determine what causes performance differences between systems. In the platforms tested, each processor provides PMCs that can count a wide variety of events. Unfortunately, the number of events common among all platforms is relatively small. Thus, a direct comparison between all systems is restricted to the number of cycles spent handling interrupts, the number of instructions decoded and retired, and branch prediction performance. In addition, level-1 cache miss rates are measured on a subset of the systems
3.4. Experimental Systems The interrupt performance measurements are performed on the six computer systems described in Table 1. These configurations cover a broad range of system and processor architectures based on the same IA-32 instruction set, and range from a previous-generation Pentium II to a modern Pentium 4. Varying the system architecture while leaving
Table 1. Test System Configuration System
CPU
Memory
Caches
p2-333
Pentium II 333Mhz
384MB SDRAM
p2-450
Pentium II 450Mhz
384MB SDRAM
p3-600
Pentium III 600Mhz
128MB SDRAM
p3-1266
Pentium III 1266Mhz
128MB SDRAM
p4-1700
Pentium 4 1.7Ghz
512MB DDR2100
p4-1800
Pentium 4 1.8Ghz
128MB SDRAM
16KB/16KB Split 512KB L2 16KB/16KB Split 512KB L2 16KB/16KB Split 256KB L2 16KB/16KB Split 512KB L2 12KB/8KB Split 256KB L2 12KB/8KB Split 256KB L2
Chipset
Network Adapter
Hard Drive Bus
L1,
Intel PIIX4
Intel EEPro 100
IDE
L1,
Intel 440BX
3c905B
IDE
L1,
Intel 810E
3c905B
IDE
L1,
Intel EEPro 100
SCSI
L1,
Serverworks ServerSet III SIS645
3c905TX
IDE
L1,
Intel 845
3c905
IDE
the operating system and measurement methodology constant provides meaningful insight into the impact of architectural trends on interrupt performance.
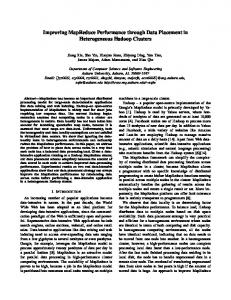
50,000 45,000 40,000 35,000
4. Results 4.1. Number of Cycles
Cycles
30,000 25,000 20,000 15,000 10,000 5,000 0 p2-333
p2-450
p3-600
p3-1266
p4-1700
p4-1800
Machine No Load, Low Int
No Load, High Int
Load, Low Int
Load, High Int
(a) Network Interrupts
50,000 45,000 40,000 35,000 30,000
Cycles
Processor cycle count is a clock frequency independent performance metric and allows the comparison of the various systems despite their widely different architectures. The number of cycles spent in the interrupt handler is obtained by sampling the Time Stamp Counter register at the beginning and end of the interrupt handler and computing the difference between the observed values. Note that the Time Stamp Counter is read after accessing the other performance counters upon entry, and before reading the counters the second time before exit. Thus, most of the instrumentation overhead is not included in the cycle counts reported here. Figure 1 shows the interrupt handling cost in terms of processor cycles for each platform tested under the four different system conditions. Although individual results vary considerably between platforms and system conditions, the most striking difference can be observed between PentiumII/III and the Pentium-4 processor. On average, processors based on the Pentium-4 architecture require at least twice as many cycles to handle an interrupt. It is important to note that all experiments are performed with the same operating system kernel code. Hence, these results reflect only differences between the architectures. The Pentium-II and Pentium-III processors are based on the same basic microarchitecture with a moderately deep superscalar dynamicallyscheduled pipeline. The Pentium-4 microarchitecture employs a significantly deeper pipeline as well as smaller level1 caches to achieve high clock rates [9], and this organization results in the higher interrupt cost. Overall, network interrupts are significantly more expensive than disk interrupts. In the Linux operating system, the
25,000 20,000 15,000 10,000 5,000 0 p2-333
p2-450
p3-600
p3-1266
p4-1700
p4-1800
Machine No Load, Low Int
No Load, High Int
Load, Low Int
Load, High Int
(b) Disk Interrupts
Figure 1. Average Interrupt Handling Overhead in Cycles
Figure 2 shows the execution time for handling interrupts across each processor and test condition. The Pentium-II/III systems show a consistent decrease in execution time as the processor speed increases. In nearly all cases, execution time scales with clock rate improvements for PentiumII/III platforms. Most strikingly, however, is that the much higher clock frequency afforded by the Pentium-4 microarchitecture is not able to compensate for the larger number of cycles required for the same interrupts. Consequently, a previous-generation Pentium-III system running at 1.2 Ghz outperforms the nominally faster Pentium-4 platforms in almost all cases.
4.3. Instruction-level Parallelism Instructions Per Cycle, or IPC, is a measure of the parallelism and efficiency of the processor. The IPC value depends both on the processor microarchitecture and the parallelism available in the instruction stream. Figure 3 shows the IPC for both interrupt classes under the four system conditions. It is calculated as the ratio of graduated instructions over the interrupt execution time in cycles. Most striking is the low number of instructions retired per cycle. Compared to results obtained on a PentiumPro system with Spec95 benchmarks [3], interrupt handler code retires 5 to 20 times fewer instructions in each cycle. Generally, network interrupts show a higher IPC for frequent interrupts, even under additional processing load. This observation is consistent with the lower cycle count observed for network interrupts at high rates, and indicates that these interrupts exhibit some amount of locality. Overall, instruction-level parallelism decreases as processor clock rate increases, indicating that the number and severity of stalls is growing. Instruction-level parallelism can be negatively affected by instruction cache misses, pipeline flushes due to branch mispredictions or explicit serialization instructions, data cache misses and TLB misses. The following sections examine some of these potential sources to determine the source of the low ILP.
50
Execution Time (micro-sec)
4.2. Execution Time
60
40
30
20
10
0 p2-333
p2-450
p3-600
p3-1266
p4-1700
p4-1800
Machine No Load, Low Int
No Load, High Int
Load, Low Int
Load, High Int
(a) Network Interrupts
60
50
Execution Time (micro-sec)
network interrupt handler performs a significant portion of the TCP/IP protocol processing. Compared to the relatively simple structure of a disk interrupt, traversing multiple layers of a network protocol stack requires more software overhead.
40
30
20
10
0 p2-333
p2-450
p3-600
p3-1266
p4-1700
p4-1800
Machine No Load, Low Int
No Load, High Int
Load, Low Int
Load, High Int
(b) Disk Interrupts
Figure 2. Average Execution Time Instructions do not complete if the pipeline is flushed due to an exception, branch misprediction or an instruction that modifies privileged state and thus requires explicit serialization. Figure 4 shows each processor’s instruction completion rate for all test conditions. While results vary considerably between tests on the same system, there is no significant difference between systems. Furthermore, with a few exceptions, only between 15 and 30 percent of the decoded instructions do not graduate. These observations indicate that the low instructionlevel parallelism is not a result of a large number of pipeline flushes, but stems from other stalls.
4.4. Instruction Completion Rate 4.5. Branch Prediction Instruction Completion Rate is a measure of a processors speculation capabilities. It is computed as the ratio of graduated instructions over the number of instructions decoded.
Branch prediction is an important component of high performance processors. As pipeline depths increase, ac-
0.2500
100.00% 90.00%
0.2000
80.00% 70.00%
0.1500
IPC
60.00% 50.00%
0.1000
40.00% 30.00%
0.0500
20.00% 10.00%
0.0000
0.00% p2-333
p2-450
p3-600
p3-1266
p4-1700
p4-1800
p2-333
p2-450
p3-600
Machine No Load, Low Int
No Load, High Int
p3-1266
p4-1700
p4-1800
Test Load, Low Int
Load, High Int
No Load, Low Int
(a) Network Interrupts
No Load, High Int
Load, Low Int
Load, High Int
(a) Network Interrupts
0.2500
100.00% 90.00%
0.2000
80.00% 70.00% 60.00%
IPC
0.1500
50.00% 0.1000
40.00% 30.00%
0.0500
20.00% 10.00%
0.0000
0.00% p2-333
p2-450
p3-600
p3-1266
p4-1700
p4-1800
p2-333
p2-450
p3-600
Machine No Load, Low Int
No Load, High Int
p3-1266
p4-1700
p4-1800
Test Load, Low Int
Load, High Int
(b) Disk Interrupts
Figure 3. Instructions Per Cycle
curate prediction becomes more important to take full advantage of the processors execution capabilities. Figure 5 summarizes the branch prediction accuracy of all systems. Perhaps surprisingly, branch misprediction rates are not significantly higher than for compute-intensive codes like Spec95 [3]. This observation indicates that branch mispredictions are not responsible for the low instruction-level parallelism found in interrupt handling code. Instead, longlatency operations such as cache misses as well as instruction fetch stalls are the most likely source of this phenomenon. However, branch prediction accuracy decreases for the Pentium-4 systems, despite its more sophisticated branch prediction hardware. Combined with a much higher branch misprediction penalty due to the deeper pipeline, this effect is one reason for the interrupt performance disadvantage of this microarchitecure.
No Load, Low Int
No Load, High Int
Load, Low Int
Load, High Int
(b) Disk Interrupts
Figure 4. Instruction Completion Rate Interestingly, for network interrupts, under a high rate, the Pentium-4 systems show good branch prediction accuracy, while low interrupt rates lead to very poor branch prediction accuracy. This effect indicates that the branch predictor is able to retain useful history information across successive interrupts, while at low interrupt rates other system activity causes more branch predictor interference. Interestingly, the same effect is not seen for disk interrupts, most likely because even at fast rates disk interrupts occur at large enough intervals to not retain much prediction history.
4.6. Cache Miss Rate Cache misses can be a significant source of pipeline stalls that lead to degradations in instruction-level parallelism and performance. Unfortunately, the cache-oriented performance counters are not consistent across the tested
Table 2. Level-1 Cache Miss Rates
% Branches Mispredicted
50.00%
40.00%
30.00%
P2-450 No Load, Low Int No Load, High Int Load, Low Int Load, High Int
I-Cache Net Disk 2.656% 0.430% 3.347% 2.200% 2.327% 1.067% 3.272% 1.843%
D-Cache Net Disk 4.246% 1.063% 8.025% 1.732% 3.792% 7.635% 7.314% 3.811%
P3-1266 No Load, Low Int No Load, High Int Load, Low Int Load, High Int
I-Cache Net Disk 0.259% 0.321% 1.690% 2.626% 0.592% 1.260% 1.705% 1.810%
D-Cache Net Disk 1.116% 2.191% 9.591% 4.268% 6.402% 10.420% 9.629% 7.039%
20.00%
10.00%
0.00% p2-333
p2-450
p3-600
p3-1266
p4-1700
p4-1800
Machine No Load, Low Int
No Load, High Int
Load, Low Int
Load, High Int
(a) Network Interrupts
the high rate of interrupt handler invocations, a large number of the level-1 misses are satisfied by the second-level cache, thus incurring a smaller miss penalty. Consequently, these interrupts exhibit a higher IPC and require fewer cycles to complete. A similar, although less strong effect can be observed for disk interrupts, but in this case the level2 cache is not able to exploit as much locality and cache misses lead to an IPC degradation.
% Branches Mispredicted
50.00%
40.00%
30.00%
20.00%
5. Future Work 10.00%
0.00% p2-333
p2-450
p3-600
p3-1266
p4-1700
p4-1800
Machine No Load, Low Int
No Load, High Int
Load, Low Int
Load, High Int
(b) Disk Interrupts
Figure 5. Branch Misprediction Rates
platforms, but results obtained for two representative systems are able to provide further insight into interrupt handling code characteristics in general. Table 2 summarizes level-1 instruction and data cache misses for two systems. Under most test conditions, both the instruction and data cache incur a significant number of cache misses, thus confirming memory system performance as the main bottleneck in interrupt handling. Furthermore, data cache miss rates rise drastically for the loaded systems, as well as for high interrupt rates on idle systems. The first trend is expected, as the additional processing load evicts a large number of interrupt handler instructions and data between successive interrupts. The second trend is a result of the experimental design, where even on an idle system the ttcp client performs a system call between successive interrupts that evicts large portions of the level-1 caches. However, due to
This study investigates I/O interrupt handling performance of a variety of platforms using kernel instrumentation and onchip performance counters, with an emphasis on relating observed effects to architectural trends. The ability to compare the same performance metric on a variety of systems is limited by the availability of similar performance counters on these systems. Unfortunately, on the IA32 family studied in this work, only a small number of performance counters is common to all processors. A more detailed analysis of the sources of the low ILP observed needs to focus on individual processors that provide the required measurement facilities. Multiprocessor systems are becoming more popular for I/O-intensive applications, but the characterization of SMP systems is complicated by dynamic interrupt assignments. While such scheduling effectively distributes the interrupt processing load over all available CPUs, it may be detrimental to instruction and data locality. Multithreading offers another dimension to characterize interrupt performance. Multithreading technologies such as HyperThreading present the operating system with multiple virtual processors, while sharing many physical resources. The performance gained by overlapping execution of the interrupt handler and other code may be enough to counter the latency incurred by the decreased amount of available caching and other resources.
6. Conclusion The work presented in this paper instruments the Linux operating system kernel to utilize onchip performance monitoring counters of IA-32 processors for a detailed performance characterization of network and disk interrupts. Results show that interrupt cost does not improve proportionally to overall processor performance. The main reason for the disappointing performance is the low degree of instruction-level parallelism that even complex dynamically-scheduled processors are able to extract from interrupt handler code. Deepening processor pipelines only aggrevate this problem. Even though branch prediction performance and overall speculation is comparable to compute-intensive benchmarks, interrupt handler code retires only a fraction of an instruction per cycle. High instruction and data cache miss rates introduce significant pipeline stalls and are one of the main sources of high interrupt costs. These results confirm that interrupt handling cost is largely determined by memory system performance. Furthermore, on the systems tested, the high clock rate achieved by modern microarchitectures does not compensate for the performance penalty of the deep pipeline and small level-1 caches.
7. Acknowledgments The authors would like to thank Curt Freeland for the use of his lab hardware for data collection and debugging. Thanks also go to the anonymous reviewers for their time and helpful commentary.
References [1] Amd athlon processor x86 code optimization guide. Technical Report 22007 Rev K., Advanced Micro Design, February 2002. [2] J. Anderson, L. Berc, J. Dean, S. Ghemawat, M. Henzinger, S. Leung, D. Sites, M. Vandevoorde, C. Waldspurger, and W. Weihl. Continuous profiling: Where have all the cycles gone. Technical Report 1997-016, Digital Equipment Corporation Systems Research Center, Palo Alto, CA, July 1997. [3] D. Bhandarkar and J. Ding. Performance characterization of the pentium pro processor. In Proc. Third IEEE Symposium on High-Performance Computer Architecture (HPCA’97), pages 288–299. IEEE CS Press, Los Alamitos, CA, 1997. [4] R. Card, E. Dumas, and F. M`evel. The Linux Kernel Book. Wiley and Sons, 1998. [5] C. C. Corporation. Alpha 21264/ev67 microprocessor hardware reference manual. [6] R. Enbody. Perfmon user’s guide. http://www.cse.msu.edu/ enbody/perfmon/index.html.
[7] S. Graham, P. Kessler, and M. McKusick. gprof: A call graph execution profiler. ACM SIGPLAN Notices, 17(6):120–126, June 1982. [8] D. Heller. Rabbit: A performance counters library for intel/amd processors and linux. Technical report, Scalable Computing Laboratory, Ames Laboratory, U.S. D.O.E., Iowa State University, October 2000. [9] G. Hinton, D. Sager, M. Upton, D. Boggs, D. Carmean, A. Kyker, and P. Roussel. The microarchitecture of the pentium 4 processor. Intel Technology Journal, Q1 2001, 2001. [10] Intel Corporation. Intel Architecture Optimization: Reference Manual, 1999. [11] Intel Corporation. IA-32 Intel Architecture Software Developer’s Manual Volume 3: System Programming Guide, 2002. [12] J. Larus and E. Schnarr. Eel: Machine-independent executable editing. In Proc. SIGPLAN’95 Conf. Programming Language Design Implementation, pages 291–300. ACM Press, New York, NY, 1995. [13] L. W. McVoy and C. Staelin. lmbench: Portable tools for performance analysis. In Proc. USENIX Annual Technical Conference, pages 279–294. Usenix Assoc., Berkeley, Calif., 1996. [14] A. Mink, W. Salamon, J. K. Hollingsworth, and R. Arunachalam. Performance measurement using low perturbation and high precision hardware assists. In Proc. 1998 IEEE Real-Time System Symposium, pages 379–388. IEEE CS Press, Los Alamitos, Calif., 1998. [15] Motorola Inc. MPC7400 RISC Microprocessor User’s Manual, March. [16] M. Poess and C. Floyd. New tpc benchmarks for decision support and web commerce. ACM SIGMOD Record, 29(4):64–71, December 2000. [17] K. D. Safford. A framework for using the pentium’s performance monitoring hardware. Master’s thesis, University of Illinois at Urbana-Champaign, 1997. [18] L. Schaelicke, A. Davis, and S. McKee. Profiling interrupts in modern architectures. In Proc. Eighth International Symposium on Modeling, Analysis and Simulation of Computer and Telecommunication Systems (MASCOTS-2000), pages 115–123. IEEE CS Press, Los Alamitos, Calif., 2000. [19] M. Shand. Measuring system performance with reprogrammable hardware. Technical Report 19, Digital Paris Research Laboratory, August 1992. [20] Silicon Graphics Inc. IRIXview User’s Guide, 1998. http://techpubs.sgi.com. [21] B. Sprunt. Brink and abyss: Pentium 4 performance counter tools for linux. Technical report, Electrical Engineering Department, Bucknell University, 2002. [22] Standard Performance Evaluation Corporation. SPECweb99 Release 1.02 User’s Guide, 2000. [23] A. Tamches and B. P. Miller. Fine-grained dynamic instrumentation of commodity operating system kernels. In Proc. Third Symposium on Operating Systems Design Implementation, pages 117–130. USENIX Assoc., Berkeley, CA, 1999. [24] M. Zagha, B. Larson, S. Turner, and M. Itzkowitz. Performance analysis using the MIPS R10000 performance counters. In Proc. Supercomputing ’96 Conference. ACM Press, New York, NY, November 1996.