International Journal of
Environmental Research and Public Health Article
Profiling of Sediment Microbial Community in Dongting Lake before and after Impoundment of the Three Gorges Dam Wei Huang and Xia Jiang * State Key Laboratory of Environmental Criteria and Risk Assessment, Chinese Research Academy of Environmental Sciences, Beijing 100012, China;
[email protected] * Correspondence:
[email protected]; Tel./Fax: +86-010-8491-3896 Academic Editor: Miklas Scholz Received: 11 April 2016; Accepted: 9 June 2016; Published: 21 June 2016
Abstract: The sediment microbial community in downstream-linked lakes can be affected by the operation of large-scale water conservancy projects. The present study determined Illumina reads (16S rRNA gene amplicons) to analyze and compare the bacterial communities from sediments in Dongting Lake (China) before and after impoundment of the Three Gorges Dam (TGD), the largest hydroelectric project in the world. Bacterial communities in sediment samples in Dongting Lake before impoundment of the TGD (the high water period) had a higher diversity than after impoundment of the TGD (the low water period). The most abundant phylum in the sediment samples was Proteobacteria (36.4%–51.5%), and this result was due to the significant abundance of Betaproteobacteria and Deltaproteobacteria in the sediment samples before impoundment of the TGD and the abundance of Gammaproteobacteria in the sediment samples after impoundment of the TGD. In addition, bacterial sequences of the sediment samples are also affiliated with Acidobacteria (11.0% on average), Chloroflexi (10.9% on average), Bacteroidetes (6.7% on average), and Nitrospirae (5.1% on average). Variations in the composition of the bacterial community within some sediment samples from the river estuary into Dongting Lake were related to the pH values. The bacterial community in the samples from the three lake districts of Dongting Lake before and after impoundment of the TGD was linked to the nutrient concentration. Keywords: bacterial community; sediment; high throughput sequencing; water period; impoundment
1. Introduction The operation of large-scale water conservancy projects can change the natural hydrological cycles and sediment translocation processes in downstream linked lakes [1,2]. The damming of rivers has had a significant global impact on natural water resources [3], as impoundment of dams can affect the water environments, i.e., physical, chemical, and biological characteristics, as well as the hydrology of neighboring lakes or rivers. Yangtze River is the largest river in China (6300 km); it is the fifth largest river in the world in terms of fresh water discharge (9.8 ˆ 1011 m3 /year), and the fourth largest in solid discharge (4.86 ˆ 108 t/year) [4]. The Three Gorges Dam (TGD) is on the lower section of the upper reaches of the Yangtze River, and is the largest hydroelectric project in the world. The construction of the TGD began in 1993, and was completed in 2009, with some exceptions. The project has played a significant role in controlling frequent catastrophic floods downstream, generating hydropower (18,200 MW), water storage (12.4 billion m3 , 2003), and improving navigation at the upper reaches of the Yangtze River. However, the TGD affects ecosystems, known as TGD’s upstream and downstream effects, which stem from inundation, flow manipulation, and fragmentation [5]. Dongting Lake is located in
Int. J. Environ. Res. Public Health 2016, 13, 617; doi:10.3390/ijerph13060617
www.mdpi.com/journal/ijerph
Int. J. Environ. Res. Public Health 2016, 13, 617
2 of 15
the middle and lower reaches of the Yangtze River. It is one of the largest freshwater lakes in China, and plays a significant role in regulating the amount of water entering the Yangtze River. The inflow from the Yangtze River carries an average of 4 million MT of sediment load per year [6]. In recent years, the impoundment of the TGD has been implemented at the end of September. Before impoundment of the TGD, the water level in Dongting Lake was high and the lake was in its high water period, with the average water level reaching 27.36 m. After impoundment of the TGD, the water input from Yangtze River decreased and the lake entered its low water period with the average water level of 21.51 m. The phenomenon of dry–rewet cycles occurred and the sediments at some positions exposed from the water when the lake was in low water period. As a distinct realm in aquatic ecosystems, sediments have higher biomass and microbe taxon richness than the bodies of water [7]. Prokaryotes, especially bacteria, play a dominant role in fresh water lake sediments, promoting nutrient recycling and decomposition of organic or inorganic compounds [8,9]. Therefore, a shift in bacterial communities may be one of the most sensitive indicators of environmental changes in the lake [10]. The impoundment of the TGD has a significant effect on the Yangtze River, and it also affects the sediment in Dongting Lake because of its location. In recent years, the sediment in Dongting Lake has been influenced by the operation of TGD, such as the sediment deposition, the unsaturated sediment carrying capacity in the downstream-linked riverway, and riverbed sediment erosions occurring downstream after the impoundment of TGD, thereby causing siltation [11–13]. In addition, microbial community changes in sediment also occur due to the impoundment of TGD. A few studies have addressed the microbial community composition affected by the TGD along the Yangtze River using more course-level culture-independent methods such as denaturing gradient gel electrophoresis (DGGE) and clone libraries [14–16]. As one of the most significant microbes, bacteria in the sediment in Dongting Lake are crucial to the entire lake’s ecosystem. The relationship between the Dongting Lake and the TGD has been studied by scholars from different perspectives, and most of the researchers focused on the early dry season in the downstream lakes, which is caused by TGD and nutrient characteristics, translocation, or sediment discharge [17,18]. The potential effects of TGD impoundment on Dongting Lake have been investigated in previous studies that focused on prediction, verification, and analysis of soil properties and biomass in the early low-water period [18–20]. However, few studies have been conducted on the effects of the impoundment of the TGD on the sediment bacterial community in Dongting Lake, and traditional techniques present inherent limitations in bacterial community studies. For example, when employing fingerprinting techniques, such as DGGE and phospholipid fatty acid analysis (PLFA), precise, accurate, and comprehensive description of microbial communities are difficult to obtain [21–23]. Thus, the objective of the present study was to compare the sediment bacterial communities before and after impoundment of the TGD using Illumina Miseq. This study may provide new insights into the bacterial communities in the sediment of Dongting Lake. 2. Materials and Methods 2.1. Site Description and Sediment Sampling Dongting Lake, which is the second largest freshwater lake in China, is located in Hunan Province (E 111˝ 40’–113˝ 10’, N 28˝ 38’–29˝ 45’). Dongting Lake is composed of a series of lakes and has three major lake districts, namely the eastern, southern, and western districts. The sample positions are shown in Figure 1. Sediment 1 (S1) and Sediment 3 (S3) were from East Lake. Sediment 4 (S4) and Sediment 7 (S7) were from south lake. Sediment 8 (S8) was from west lake. Sediment 2 (S2) was from the outlet of Dongting Lake and the estuary of the Yangtze River. Sediment 5, 6, 9, and 10 (S5, S6, S9, and S10) were from the river estuary into Dongting Lake. Ten composite surface sediment samples (each N = 5) were collected before (in July 2015, high water period,) and after (in October 2015, low water period) the impoundment of the Three Gorges Dam, and these samples were assigned as HS and LS, respectively. The weight of sample collected was sufficient for DNA extraction and analysis
plastic bags and stored in a portable ice box, then transferred to the lab as quickly as possible and stored at −80 °C before analysis. The sediment samples were divided into four groups. The samples of Group A (HS1, HS3, HS4, HS7 and HS8) and Group B (HS2, HS5, HS6, HS9 and HS10) were collected from the three lake Int. J. Environ. Res. Public Health 2016, 13, 617 3 of 15 districts of Dongting Lake and the river estuary into Dongting Lake during the high water period, respectively. The collection sites of the samples from Group C (LS1, LS3, LS4, LS7 and LS8) and Group D (LS2, LS5, LS6, LS9 andSediment LS10) were the same Groups A and B, respectively, and the of physicochemical parameters. samples wereas put into sealed plastic bags and stored in a samples collected during thetolow portablewere ice box, then transferred thewater lab asperiod. quickly as possible and stored at ´80 ˝ C before analysis.
Figure Figure1.1.Sampling Samplingsite siteatatthe thestudy studyarea. area.
2.2. Analysis of Physicochemical Parameters The sediment samples were divided into four groups. The samples of Group A (HS1, HS3, HS4, of HS5, the sediments using standardized methods and HS7The andtotal HS8)phosphorus and Group B(TP) (HS2, HS6, HS9 was and measured HS10) wereby collected from the three lake districts tests, and total nitrogen (TN) of the sediments was obtained as ammonium by colorimetry after the of Dongting Lake and the river estuary into Dongting Lake during the high water period, respectively. −1 sample was digested alkaline potassium persulfate 0.24 and mol·L K2S2LS5, O8 The collection sites of thewith samples from Group C (LS1, LS3, LS4, (NaOH LS7 and LS8) Groupand D (LS2, −1) [24,25]. Organic matter (OM) content was calculated according to the loss on ignition 0.074 LS6, mol·L LS9 and LS10) were the same as Groups A and B, respectively, and the samples were collected toduring constant (4 h) at 550 °C [26]. The pH of each sediment sample was measured in a 1:2.5 (w/v) themass low water period. mixture of sediment with deionized water [27]. The main properties of the collected sediments are 2.2. Analysis of Physicochemical Parameters shown in Table 1. The total phosphorus (TP) of the sediments was measured by using standardized methods and tests, and total nitrogen (TN) of the sediments was obtained as ammonium by colorimetry after the sample was digested with alkaline potassium persulfate (NaOH 0.24 mol¨ L´1 and K2 S2 O8 0.074 mol¨ L´1 ) [24,25]. Organic matter (OM) content was calculated according to the loss on ignition to constant mass (4 h) at 550 ˝ C [26]. The pH of each sediment sample was measured in a 1:2.5 (w/v) mixture of sediment with deionized water [27]. The main properties of the collected sediments are shown in Table 1.
Int. J. Environ. Res. Public Health 2016, 13, 617
4 of 15
Table 1. Physicochemical properties (mean value ˘ standard deviation) of the sediments. Sample
TP (mg¨ kg´1 )
TN (mg¨ kg´1 )
Water Content (%)
OM (%)
pH
HS1 HS2 HS3 HS4 HS5 HS6 HS7 HS8 HS9 HS10
892.3 ˘ 10.2 982.2 ˘ 9.2 722.4 ˘ 8.2 823.2 ˘ 8.5 892.8 ˘ 8.6 1003.7 ˘ 9.1 698.2 ˘ 7.3 782.3 ˘ 7.8 892.3 ˘ 7.7 602.3 ˘ 7.2
620.2 ˘ 6.1 1184.2 ˘ 8.2 705.5 ˘ 8.1 1004.6 ˘ 8.9 992.1 ˘ 8.5 1197.8 ˘ 12.4 821.2 ˘ 10.2 995.3 ˘ 8.3 1045.1 ˘ 10.3 611.9 ˘ 8.3
36.98 ˘ 2.13 44.55 ˘ 3.21 47.31 ˘ 3.76 63.02 ˘ 4.29 40.36 ˘ 5.75 43.51 ˘ 3.98 46.02 ˘ 3.57 48.84 ˘ 3.43 35.11 ˘ 3.01 30.76 ˘ 2.79
8.21 ˘ 0.65 8.1 ˘ 0.49 6.17 ˘ 0.46 7.62 ˘ 0.56 5.97 ˘ 0.48 7.07 ˘ 0.49 5.16 ˘ 0.51 7.03 ˘ 0.56 6.68 ˘ 0.41 6.41 ˘ 0.62
7.16 ˘ 0.44 7.35 ˘ 0.48 7.25 ˘ 0.53 7.17 ˘ 0.49 7.42 ˘ 0.61 7.29 ˘ 0.67 7.27 ˘ 0.62 7.36 ˘ 0.68 7.46 ˘ 0.61 7.37 ˘ 0.56
LS1 LS2 LS3 LS4 LS5 LS6 LS7 LS8 LS9 LS10
921.2 ˘ 8.2 1021.4 ˘ 9.2 823.1 ˘ 8.5 937.5 ˘ 9.3 983.3 ˘ 9.1 1193.1 ˘ 10.2 821.5 ˘ 7.8 842.1 ˘ 7.2 982.4 ˘ 8.7 701.2 ˘ 8.8
842.3 ˘ 7.3 1302.3 ˘ 8.1 923.1 ˘ 9.4 1198.5 ˘ 12.3 1123.2 ˘ 12.8 1423.2 ˘ 11.3 983.5 ˘ 11.7 1045.2 ˘ 10.8 1197.3 ˘ 11.5 801.6 ˘ 10.3
33.21 ˘ 2.76 40.12 ˘ 3.65 44.21 ˘ 3.96 52.13 ˘ 4.02 36.21 ˘ 4.23 38.97 ˘ 4.47 40.46 ˘ 4.21 42.36 ˘ 3.76 30.21 ˘ 3.28 27.98 ˘ 2.67
8.52 ˘ 0.69 8.32 ˘ 0.72 7.01 ˘ 0.67 7.34 ˘ 0.78 6.12 ˘ 0.51 7.56 ˘ 0.68 6.05 ˘ 0.59 7.12 ˘ 0.69 7.24 ˘ 0.66 6.89 ˘ 0.57
7.21 ˘ 0.49 7.43 ˘ 0.48 7.31 ˘ 0.42 7.21 ˘ 0.51 7.39 ˘ 0.63 7.33 ˘ 0.71 7.35 ˘ 0.58 7.36 ˘ 0.62 7.41 ˘ 0.51 7.51 ˘ 0.57
2.3. DNA Extraction Sediment samples were stored at ´80 ˝ C until DNA extraction. DNA was extracted from 1 g fresh sediment samples by using a PowerSoil DNA Isolation Kit (Mobio Laboratories Inc., San Diego, CA, USA), following manufacturer protocol. DNA concentration and purity were checked by running the samples on 1.2% agarose gels. All the extracted total DNA samples were stored in ´80 ˝ C before further analysis. 2.4. PCR Amplification of 16S rRNA Genes and Sequencing The V4-V5 regions of bacterial 16S rRNA genes were amplified using the universal primers 515F (GTGCCAGCMGCCGCGGTAA) and 926R (CCGTCAATTCMTTTRAGTTT), these primers were chosen because of their high coverage of almost all phyla in conventional and metagenomic studies [28–30]. The primers also contained the Illumina 5’ overhang adapter sequences for two-step amplicon library building, following manufacturer protocol for the overhang sequence. The amplification of bacteria gene fragments was achieved after two PCR steps. PCR amplification was performed in a 25 µL reaction volume with 1 µL DNA template, 250 µM dNTPs, 0.25 µM of each primer, 1X reaction buffer, and 0.5 U Phusion DNA Polymerase (New England Biolabs, Ipswich, MA, USA). PCR cycling was carried out in a thermocycler under the following conditions: an initial denaturation at 94 ˝ C for 2 min, followed by 25 cycles of denaturation at 94 ˝ C for 30 s, annealing at 56 ˝ C for 30 s and extension at 72 ˝ C for 30 s, with a final extension of 72 ˝ C for 5 min. The Illumina Nextera XT Index Kit (Illumina Inc., San Diego, CA, USA) with dual eight-base barcodes was used for multiplexing. Eight cycles of PCR reactions were used to incorporate two unique barcodes on both ends of the 16S amplicons. Cycling conditions consisted of one cycle at 94 ˝ C for 3 min, followed by eight cycles of 94 ˝ C for 30 s, 56 ˝ C for 30 s, and 72 ˝ C for 30 s. The final extension cycle was at 72 ˝ C for 5 min. Prior to library pooling, the barcoded PCR products were purified by using a DNA gel extraction kit (Axygen, Shanghai, China) and quantified by using the Qubit dsDNA HS Assay Kit (Life Technologies, New York, NY, USA). The libraries were sequenced by 2 ˆ 300 bp paired-end sequencing on the MiSeq platform (Illumina, San Diego, CA, USA). Experiments were conducted at Tiny Gene Bio-Tech Co., Ltd. (Shanghai, China).
Int. J. Environ. Res. Public Health 2016, 13, 617
5 of 15
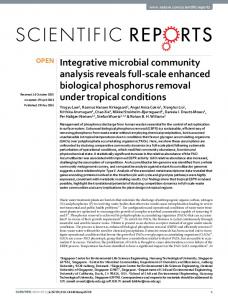
2.5. Statistical Analysis The overlap between the forward and reverse reads was 180–190 bp approximately. The minimum quality score was 25 when merge the Illumina reads and the minimum overlap was 10 bp. The preprocessing of sequences was performed mainly by using MOTHUR 1.35.1 (University of Michigan, Ann Arbor, MI, USA) and by following the MiSeq analysis pipeline outlined in http://www.mothur.org/wiki/MiSeq_SOP [31]. Operational taxonomic units (OTUs) are defined as groups among which sequence similarities were greater than 97%. The species richness estimators (the abundance-based coverage estimator ACE, Jackknife and Chao1), Shannon diversity index, and Simpson diversity index were calculated. In this study, data preprocessing and OTU-based analysis were performed by MOTHUR (University of Michigan, Ann Arbor, MI, USA). Canoco 4.5 (Microcomputer Power, Ithaca, NY, USA) was used with Monte Carlo permutation test to perform the redundancy analysis (RDA) based on population abundance and environment factors. LEfSe (University of Auckland, Auckland, New Zealand) was used to find indicator bacterial groups specific to the sediment samples [32]. The statistical analysis was performed using SPSS 20.0 (International Business Machines Corporation, Armonk, NY, USA). 2.6. Accession Numbers All of the sequencing data analyzed in the present study can be downloaded from the NCBI’s Sequence Read Archive using accession numbers SRR3354421 and SRR3354422. 3. Results and Discussion 3.1. Richness and Diversity of Microbial Community The bacterial 16S rRNA gene sequences were obtained from sediment samples in different locations during the high and low water periods. Diversity concerns both taxon richness and evenness, and the results demonstrated that both parameters in most of sediments (HS3–HS10) from high water period were higher than sediments (LS3–LS10) from low water period (Figure 2). Tags with 97% similarity (Needleman–Wunsch alignment) were grouped according to OTUs to calculate the richness and diversity indices. The number of bacterial 16S rRNA gene sequences obtained from samples varied from 19,691 (LS9) to 22,586 (HS6). Table 2 shows the community richness and diversity by using different types of statistical methods, including ACE, Chao1, Simpson, and Shannon, and the end point of the curve (Figure 2) was used to calculate these indices. In comparing the diversity indices (Simpson and Shannon), the Shannon index showed that the sediment samples during the high water period (HS3–HS10) had a higher diversity than during the low water period (LS3–LS10), and the analysis of variance results indicated there were significant differences (p < 0.05) among the samples before and after impoundment. HS1 and HS2 samples had lower Shannon indices (6.85 and 7.33) and higher Simpson values (0.0041 and 0.0056, respectively) than LS1 and LS2. These two sampling positions were located nearby the estuary of the Yangtze River, and where different types of sediments from other places came together. Therefore, the slow flow caused the sedimentation of a large amount of sediments, which caused high diversity of the bacterial community during the low water period. Furthermore, with the exception of samples from S1, the sediment samples during the high water period (HS2–HS10) had a higher richness (Chao1 and ACE estimator) than during the low water period, and there were significant differences between the samples from high and low water periods (p < 0.05), thereby presenting a similar trend to diversity indices. HS6 also had the highest value of Chao1 and ACE (17,351 and 27,279, respectively).
Int. J. Environ. Res. Public Health 2016, 13, 617 Int. J. Environ. Res. Public Health 2016, 13, 617
6 of 15 6 of 15
Figure 2. Rarefaction curves for (a) OTU (Operational taxonomic units); and (b) Shannon index were
Figure 2. Rarefaction forwith (a) OTU (Operational units);OTUs. and (b) Shannon index were calculated using curves MOTHUR reads for each sampletaxonomic using 0.03 distance calculated using MOTHUR with reads for each sample using 0.03 distance OTUs.
Int. J. Environ. Res. Public Health 2016, 13, 617
7 of 15
Table 2. Diversity of the 16S rRNA gene libraries from the sequencing analysis. Samples Total Reads HS1 LS1 HS2 LS2 HS3 LS3 HS4 LS4 HS5 LS5 HS6 LS6 HS7 LS7 HS8 LS8 HS9 LS9 HS10 LS10
20,903 21,231 20,323 20,777 21,389 20,475 22,239 20,546 20,118 20,668 22,586 20,328 21,547 21,042 21,271 19,989 20,751 19,691 22,367 20,452
OTU
Chao1
ACE
Simpson
Shannon
3836 4685 5968 5631 6977 5964 6569 6511 6509 6048 7534 7193 7000 5709 5047 5963 6670 5750 7233 6159
7863 9569 14,318 11,931 15,218 13,828 14,308 14,138 15,405 13,522 17,351 16,320 15,147 12,116 14,636 9953 16,138 12,903 16,542 13,562
10,727 13,925 24,153 17,402 22,448 21,097 22,036 21,108 23,734 20,455 27,279 25,817 22,413 18,138 23,396 14,672 25,942 20,436 25,599 20,807
0.0041 0.0027 0.0056 0.0025 0.0012 0.0021 0.0018 0.0017 0.0016 0.0021 0.0014 0.0011 0.0012 0.0021 0.0022 0.0031 0.0017 0.0016 0.0013 0.0020
6.85 7.19 7.33 7.45 7.92 7.55 7.75 7.69 7.77 7.56 8.12 8.01 7.93 7.47 7.48 7.32 7.74 7.63 7.90 7.64
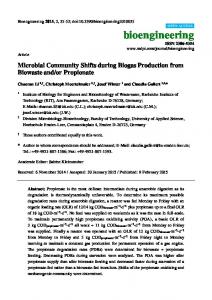
3.2. Phylum Level Taxonomic Distribution Among the filtered sequences, a total of 33 phyla were determined in the sediment samples. The dominant groups of each sample are displayed in Figure 3. Proteobacteria was the most abundant (36.4%–51.5%) phylum across all samples, and the sediment samples during the high water period had relatively higher abundance of Proteobacteria than those from the low water period. In additon, bacterial sequences were also affiliated with Acidobacteria (11.0% on average), Chloroflexi (10.9% on average), Bacteroidetes (6.7% on average), and Nitrospirae (5.1% on average). Sequences affiliated with Firmicutes, Cyanobacteria, Planctomycetes, and Actinobacteria were relatively abundant. The samples during the low water period had higher abundance of Firmicutes than the samples during the high water period, and the analysis of variance results indicated that there were significant differences (p < 0.01) among the samples before and after impoundment. HS1 and LS1 had higher abundance of Nitrospirae than samples from other points of collection. With the exception of samples from S1, S7, and S8, the abundance of Nitrospirae during the low water period was higher than during the high water period (p < 0.01). The relatively high abundance of Cyanobacteria (8.2% and 2.7%) was respectively observed in the samples of HS2 and HS6, and the samples of LS2 and LS6 had lower abundance (