Hindawi Publishing Corporation BioMed Research International Volume 2014, Article ID 924270, 8 pages http://dx.doi.org/10.1155/2014/924270
Research Article Prognostic Indices of Poor Nutritional Status and Their Impact on Prolonged Hospital Stay in a Greek University Hospital Georgia Tsaousi,1 Stavros Panidis,2 George Stavrou,2 John Tsouskas,2 Dimitrios Panagiotou,2 and Katerina Kotzampassi2 1 2
Department of Anesthesiology, Faculty of Medicine, Aristotle University of Thessaloniki, 54636 Thessaloniki, Greece Department of Surgery, Faculty of Medicine, Aristotle University of Thessaloniki, 54636 Thessaloniki, Greece
Correspondence should be addressed to Katerina Kotzampassi;
[email protected] Received 2 February 2014; Accepted 22 February 2014; Published 23 March 2014 Academic Editor: Salvatore Battaglia Copyright © 2014 Georgia Tsaousi et al. This is an open access article distributed under the Creative Commons Attribution License, which permits unrestricted use, distribution, and reproduction in any medium, provided the original work is properly cited. Background. To ascertain the potential contributors to nutritional risk manifestation and to disclose the factors exerting a negative impact on hospital length of stay (LOS), by means of poor nutritional status, in a nonselected hospitalized population. Materials and Methods. NutritionDay project questionnaires were applied to 295 adult patients. Study parameters included anthropometric data, demographics, medical history, dietary-related factors, and self-perception of health status. Body Mass Index (BMI) and Malnutrition Universal Screening Tool (MUST) were calculated for each participant. MUST score was applied for malnutrition assessment, while hospital LOS constituted the outcome of interest. Results. Of the total cohort, 42.3% were at nutritional risk and 21.4% malnourished. Age, gender, BMI, MUST score, autonomy, health quality, appetite, quantity of food intake, weight loss, arm or calf perimeter (𝑃 < 0.001, for all), and dietary type (𝑃 < 0.01) affected nutritional status. Poor nutrition status (𝑃 = 0.000), deteriorated appetite (𝑃 = 0.000) or food intake (𝑃 = 0.025), limited autonomy (𝑃 = 0.013), artificial nutrition (𝑃 = 0.012), weight loss (𝑃 = 0.010), and arm circumference 7 days. Conclusion. Nutritional status and nutrition-related parameters such as weight loss, quantity of food intake, appetite, arm circumference, dietary type, and extent of dependence confer considerable prognostic value regarding hospital LOS in acute care setting.
1. Introduction Malnutrition is an ordinary clinical feature, with a currently estimated incidence ranging from 10 to 60% in acute hospital care, depending on the definition, clinical setting, and screening tool applied [1–9]. A notable proportion of hospitalized patients are not only at nutritional risk upon hospital admission, but their nutritional status deteriorates during their hospital stay as well [1, 5, 7]. Nutritional status derangement has a multifactorial origin, typically occurring during a continuity involving deficiency in dietary intake and/or increased requirements due to a disease state, from complications of an underlying disorder such as impaired absorption, excessive nutrient losses, and altered nutrient utilization or a combination of the aforementioned factors [2, 8, 10]. A physician confronts the challenge of weight loss, at several points of this continuity [8].
Impaired nutrition status has been identified as an independent predictor of depressed immune response, impaired wound healing, more frequent cardiac complications, higher readmission rate, and hence prolonged hospitalization or increased mortality, which eventually have an adverse secondary impact on health care facilities [1, 2, 5, 6, 11, 12]. Despite the progress in collective development of knowledge and compelling evidence, contemporary malnutrition rates have not altered significantly, as malnutrition in most clinical settings tends to be undetected and inappropriately addressed because it is not regarded as a high-priority entity [2–4, 6, 7, 10]. This has evolved as a matter of clinical concern, which can only be encountered through special attention to nutritional care of patients. Identification of patients incurring notable risk of adverse events due to poor nutritional status is considered not only a core competency of nutrition practitioners, but is also
2 indicated by clinical practice guidelines [7, 13, 14]. When devising strategies to deal with undernutrition and subsequently integrating them into everyday clinical routines, many factors have to be considered. Among them the influence of the disease per se on food intake and energy/nutrient requirements and the application of the more suitable tools for detecting risk or presence of nutritional deficiency are regarded as the most critical. Medical, psychological, and social causes have also to be considered. An optimal clinical assessment of nutrition status necessitates a detailed medical history, anthropometric measurements, laboratory tests, and dietary interviews, thus being a complex and timeconsuming procedure [1, 3, 13]. Albeit, the screening of patients subjected to nutritional risk is considered as an essential initial step in the structured process of nutrition care, in order to identify those who will likely benefit from proper nutritional management, is usually overlooked, and is still away from being routinely implemented in hospitalized patients. On the occasion of the European NutritionDay project held in 2012 [15], we underwent a thorough nutritional status evaluation of nonselected adult patients in our university hospital, with a view to ascertain those at nutritional risk and the potential contributors to its manifestation. In addition, we got insight into factors, engendering negative outcomes such as prolongation of length of hospital stay (LOS), by means of poor nutritional status.
2. Experimental Methods 2.1. Study Population. This observational study evaluated the prospectively collected data of all heterogeneous adults hospitalized patients in different wards of a Greek university hospital upon the NutritionDay audit. Only patients of age 18 years and above were eligible for the study, as the criteria for defining malnutrition in patients younger than 18 years are complex and vary from the adult population [16]. Patients treated in an intensive care unit and those with deteriorated level of consciousness who had no caregivers or proxies to provide the necessary information were excluded. This study was conducted according to the guidelines laid down in the Declaration of Helsinki and all procedures involving human subjects/patients were approved by our hospital scientific council. Written informed consent was obtained from all subjects/patients, their families, or legal representatives. 2.2. Data Collection. Six groups of two designated healthcare professionals each (nurses dieticians or doctors, one of whom worked in the patient’s ward and the other independent) interviewed participants or their family members, where available, as well as reviewed consent patients’ medical charts to fill out a standardized questionnaire prepared by European Society of Parental and Enteral Nutrition (ESPEN) organization for NutritionDay in Europe [15]. In particular, the following factors were registered: (1) anthropometric data (age, gender, measured weight, height, midarm, and calf circumference), (2) demographics (participating specialties and presurvey and total hospital LOS), (3) past and present medical history mainly involving a detailed list of reported
BioMed Research International comorbidities and the number of prescriptions received per day (as a surrogate marker for disease severity), (4) quality of health status assessed by the extent of dependence in everyday activities and participants’ self-perceived adequacy of health status, and (5) dietary-related parameters (selfreported weight loss within the last 3 months, autonomy in everyday living, appetite status, and quantity and type of nutritional intake during hospitalization). Body Mass Index (BMI) was calculated for all patients by a dietician or an experienced physician. BMI scores were then classified into four categories: BMI less than 18.5 is considered as underweight, BMI 18.5–24.9 as normal, BMI 25–30 as overweight, BMI 30 or greater as severely elevated (obese), and BMI more than 40 as extremely elevated (morbidly obese) [17]. The Malnutrition Universal Screening Tool (MUST) was calculated for all participants and was considered as the target variable for determination of the overall risk of malnutrition [18]. MUST is a simple screening tool, based on BMI, unintentional weight loss in the past 3 to 6 months, and acute disease effect or being unable to receive food for more than 5 days, for classifying subjects into one of the basic nutritional status categories as follows: 0 = low risk (well nourished), 1 = moderate risk, and 2 or more = high risk for malnutrition (malnourished). Patients were considered to be at high risk if they had a BMI 10% unintentional weight loss in the previous 3–6 months or were nil by mouth for >5 days. Patients were considered to be at moderate risk if they had a BMI 18.5– 20.0 kg/m2 or experienced 5–10% weight loss in the previous 3–6 months. All other patients were classified as low risk [18]. Total hospital LOS was recorded for every participant and constituted the outcome of interest, which was dichotomized to ≤7 and to >7 days. A random check carried out by three experienced investigators was used to eliminate errors in the data collection on paper sheets and transferring processes before the data were entered into a computer database. 2.3. Statistical Analysis. One-way analysis of variance (ANOVA) was undertaken for comparison of means of continuous variables and normal distributed data, while a nonparametric rank test, the Kruskal-Wallis test, was used to compare means in the case of nonnormally and noncontinuously distributed data. Normality of data was assessed by Kolmogorov-Smirnov test. Categorical variables were assessed by a chi-square or Fisher’s exact test when the expected value of a cell was less than 5. Odds ratios with 95% confidence intervals were computed using a univariate and multivariate stepwise logistic regression model with hospital LOS as the response variable. For all statistical procedures, a 𝑃 value of less than 0.05 was considered significant. Data were analyzed using SPSS version 18.0 (SPSS Inc., Chicago, IL, USA).
3. Results A total of 295 hospitalized patients were enrolled in the study. Table 1 depicts the demographic characteristics,
BioMed Research International
3
100
General surgery
90 80
Neurosurgery
70
Cardiosurgery
60 Eye surgery
50 40
ENT
30
Pathology
20 Neurology
10 0
85
Well nourished Nutrition risk Malnourished
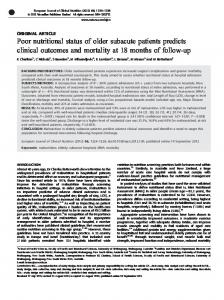
Figure 1: Nutrition status assessed by MUST classification related to age groups. Note. Data are expressed as percentage (%).
admission-related characteristics, and the studied parameters according to nutrition status of the participants. The mean age of our cohort was 63.6 (SD 17.2, range 18 to 100) years and the BMI was 26.7 (SD 5.1, range 14 to 42.6), while the male to female ratio was 1.5 : 1 (179/116). The age-dependent distribution of the MUST score differed significantly among the age subgroups (chi-square = 21.60, 𝑃 < 0.001) as it is shown in Figure 1. In particular, nutritional status deterioration was proportional to advanced age. According to BMI subcategories 2.8% of cases (𝑛 = 8) were underweight, 39% (𝑛 = 115) with a normal BMI, 32% (𝑛 = 95) overweight, 24.8% (𝑛 = 73) obese, and 1.4% (𝑛 = 4) morbidly obese. The total hospital LOS of the study population was 7.4 (SD 7.5, range 1 to 65) days. Almost two out of three patients of the cohort had a hospital LOS less than 8 days (63.3%, 𝑛 = 188). Comorbidities were present in 167 (56.6%) patients, with the most common being hypertension (31.9%, 𝑛 = 53), followed by diabetes mellitus (27.1%, 𝑛 = 45), stroke (26.3%, 𝑛 = 44), COPD (10.6%, 𝑛 = 18), and cardiovascular diseases (4.1%, 𝑛 = 7). Weight loss more than 5% during the last 3 months and loss of appetite were recorded in 41% (𝑛 = 121) and in 30.8% (𝑛 = 91) of the patients, respectively. These two parameters were found to be significantly interrelated (chisquare = 20.68, 𝑃 < 0.05). Quantity of received food less than normal during the last week was reported in 43.7% (𝑛 = 129) of the patients. Serious psychiatric disorders such as dementia or depression were observed in 8.1% (𝑛 = 24) of the study group and among them 95.8% (𝑛 = 23) were found to be at the risk of malnutrition or malnourished (chi-square = 36.01, 𝑃 < 0.000). Furthermore, 36.3% (𝑛 = 107) of the patients reported that they were under stressful conditions during the last 3 months and the majority of them (90.6%, 𝑛 = 97) were in abnormal nutrition status (chi-square = 61.78, 𝑃 < 0.001). Nutritional status was also influenced by quantity of food received per day. Among the patients received hospital food
Cardiology 0
20
40
60
80
100
Malnourished At risk of malnutrition Well nourished
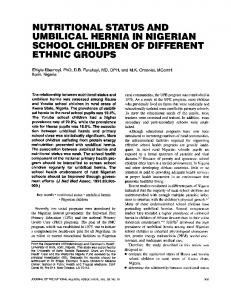
Figure 2: Distribution of all recruited patients per ward type stratified by nutritional status assessed by MUST classification. Note. Data are expressed as percentage (%). ENT: Eye-Nose-Throat.
in the well-nourished (𝑛 = 104) and malnourished (𝑛 = 54) group, the majority in the first group (80%, 𝑛 = 87) consumed two to three whole meals per day, while in the latter group 74.6% (𝑛 = 40) of the subjects consumed just one whole meal per day (𝑃 < 0.001). Regular hospital food with no particular dietary plan was the source of nutrition for 58.6% (𝑛 = 173) of the patients; 34.6% (𝑛 = 102) of patients were given hospital food but modified for some form of special diet, and 6.8% (𝑛 = 20) were on enteral or total parenteral nutrition (TPN). The more adequate nutrition was recorded in patients receiving regular hospital food, while malnutrition was more frequent in patients under receiving artificial nutrition (enteral or TPN). According to the reason of admission, 42 (14.2%) patients had neurological problems, 99 (33.6%) pathological, and 113 (38.3%) surgical, while 41 (13.9%) patients presented with cardiac pathologies (chi-square = 25.61; 𝑃 < 0.001). Nutritional status of the study population differed significantly (chi-square = 58.17; 𝑃 = 0.000) according to the type of the ward being admitted (Figure 2). The best nutritional status presented the patients admitted to EyeNose-Throat (ENT) or to cardiology department (66.5% and 63.4%, resp.), followed by those admitted to general surgery department (52.3%). The higher prevalence of malnutrition risk was recorded in cardiosurgical and eye surgery cases (60% and 57.2%, resp.), while neurosurgery department had the higher incidence of severe malnourishment (45.8%). When the study population was classified into surgical and pathological subgroups, 27 (64.2%) of the malnourished subsets, 83 (63.8%) patients being at risk of malnutrition, and 72 (58.5%) of well-nourished patients involved pathological cases, but no significant difference in the nutritional status occurred in regard to surgical ones (chi-square = 0.89; 𝑃 = 0.640). The length of hospital stay was comparable among
4
BioMed Research International Table 1: Participants’ characteristics according to MUST categories.
Variable 𝑁 (%) Age (years) Females BMI Presurvey LOS (days) Hospital LOS (days) Comorbidities Hypertension Diabetes mellitus Stroke COPD Cardiovascular disease No comorbidity Autonomy Out of home Home only Bedridden Health status self-assessment Fine Very good Good Satisfactory Poor Appetite status Abnormal Normal Dietary type Regular diet Specific diet Enteral nutrition TPN Quantity of food last week§ Normal Less than normal Half normal Quarter normal Recent weight loss Yes No Gain weight Do not know Arm perimeter