Program Comprehension Techniques Improve Software Inspections: A Case Study Stan Rifkin Master Systems Inc. 2604B El Camino Real 244 Carlsbad, CA 92008 USA
[email protected] ABSTRACT Software inspections are widely regarded as a costeffective mechanism for removing defects in software, though performing them does not always reduce the number of customer-discovered defects. We present a case study in which an attempt was made to reduce such defects through inspection training that introduced program comprehension ideas. The training was designed to address the problem of understanding the artifact being reviewed, as well as other perceived deficiencies of the inspection process itself. Measures, both formal and informal, suggest that explicit training in program understanding may improve inspection effectiveness. Keywords Software inspections, formal technical reviews, peer reviews, program comprehension
1. INTRODUCTION The software technical review is a widely -recommended mechanism for software defect removal. Such reviews go by many names—inspections, Fagan-style inspections, code reviews, peer reviews, formal reviews—and exhibit significant variations among organizations [Fagan, Freedman, Gilb]. All such review methods rely on the selfevident notion that software professionals are likely to find defects in software if they actually look at the products they produce. A software technical review is a meeting—along with its preparation—in which a group of software professionals (peers) does exactly that. Types of reviews are distinguished from one another by the rules governing how that examination takes place and how it relates to the overall software development or maintenance process. Impressive claims are made for the
Lionel Deimel 1408 Navahoe Dr. Pittsburgh, PA 15228 USA
[email protected]
efficacy of reviews [Humphrey 1989]. What follows is a case study in which developers were given, along with traditional (and non-traditional) instruction, explicit instruction in program comprehension concepts and techniques. The case study suggests that software engineers often have poor strategies for understanding the artifacts they are called upon to review and that providing training in comprehension skills can improve their performance significantly.
A Training Opportunity One of the authors (Rifkin) was engaged by a manufacturing firm that we will call Widget, Inc.1 Widget management, having read the literature on software inspections, had expected the introduction of this practice to produce a significant decline in customer-discovered defects. The anticipated decline had not occurred, however, either in the number or percentage of defects identified by customers. Previous engagements had investigated the common experience that, while the percentage of defects discovered by testing prior to product release declines precipitously after the introduction of inspections, customer-discovered defects show no significant decrease. This is not to say that inspections are not useful or cost-effective. In large measure, however, they seem to identify defects that might otherwise be found using a more expensive method—testing—rather than reduce the overall number of defects in released software. We had hypothesized that introducing inspections often had had little effect on reducing customer-identified defects because, although reviewers were being thor-
1 The firm wishes to remain anonymous and does not want to divulge raw data on defects, which it considers proprietary. The data in this paper are presented in a manner intended to respect those wishes.
oughly trained in the group aspects of the inspection process, they were being given little guidance as to how to precisely carry out their preparatory study of work products in the privacy of their own offices. It was generally assumed that reviewers knew how to look for defects, any data to the contrary notwithstanding. This hypothesis had led to the development of a training program on those previous engagements that was intended to be more comprehensive, and this enhanced training was brought to Widget. It incorporated an introduction to program comprehension based on the Deimel and Naveda report from the Software Engineering Institute, “Reading Computer Programs: Instructor’s Guide and Exercises” [Deimel 1990].
Widget, Inc. Widget is a large-scale manufacturing company. One particular section produces software for engineering computations. There used to be two groups in this section, which we will call Group 2 and Group 3. Each group employed about 30-35 software professionals, all of whom were trained in and regularly performed inspections. Group 2 had been trained in performing inspections by one of the pioneers in the field and Group 3 had received training from the other [Fagan, Gilb]. Group 2 had received training about five years prior to our engagement, and Group 3 had received training about three years prior. The two groups had developed a number of large FORTRAN programs, and their current duties predominantly involved maintaining and enhancing those programs. Another unit, which we will call Group 1, was about 18 months old. It, too, comprised 30-35 professionals, nearly all of whom had worked previously in one of the two other groups. Group 1 maintained and enhanced a suite of computer-aided design and computeraided manufacturing programs written in FORTRAN, C, and several script languages. The source code of some of the programs had been purchased. Staff turnover in all three groups was very low, less than 5% over five years. The customers (users) of the software for which the section was responsible were Widget engineers. Although these engineers were organized into a number of separate units, they constituted a substantially homogeneous customer base for all three development groups. Each major customer unit has one or two representatives responsible for collecting issues (including bugs and desired features) and negotiating their resolution with the developers. Some Group 1 members had received inspections training from each of the software inspections pioneers when they had been members of Groups 2 and 3, respectively. This difference in backgrounds and the perceived incompatibility of the pioneers’ methods had inhibited their use of inspections. Group 1 management sought to routinize inspections through training that fostered a common
understanding of inspections. After some discussion with that management, however, reduction of customerdiscovered defects became the dominant goal of the proposed engagement. It was necessary to define a single inspection process for Group 1, of course; moreover the members of Group 1 were already “sold” on inspections and did not need specific encouragement to perform them.
The Training Workshop The normal Master Systems 1½ day inspections training workshop was presented at Widget for the members of Group 1, with half the group attending each of two offerings. The workshop followed this syllabus: Day 1 (full -day) • DEFINITION OF INSPECTIONS, EXPECTED BENEFITS: Description of the “common” software inspection process and its documented benefits. • INTRODUCTION TO THE INSPECTION PROCESS: Details of the usual steps before, during, and after an inspection defect collection meeting. • INTRODUCTION TO READING COMPREHENSION: Discussion of how we come to understand what we read and how that process can be made more effective. • DEVELOPMENT OF THE INSPECTION PROCESS: What are the requirements for inspections? What is a process that will fulfill those requirements? Two types of work products are chosen to be inspected. In Between (outside work done by participants) • CONTINUED DEVELOPMENT OF THE INSPECTION PROCESS: Participants, having each been assigned to one of three groups, meet either to complete a full description of the inspection process or to develop checklists for each of the two work product types. • SELECTION AND STUDY OF ARTIFACTS: The groups responsible for composing checklists select existing artifacts for practice inspections. Each workshop participant reviews one of these privately, in preparation for the inspections on Day 2.
Day 2 (half day) • PRACTICE INSPECTIONS: Inspections of the selected artifacts allow participants to practice taking the four rôles of producer, moderator, recorder, and reviewer using the selected artifact. • DEBRIEF: Discussion of what has been learned and how it can be applied on the job. Days 1 and 2 were a week apart. Approximately two hours of the instruction time on Day 1 were devoted to understanding programs. This material was to be applied during the In Between time, when the artifacts selected were studied privately by each participant for approximately two hours. Much of the material on program comprehension was taken from or suggested by the report by Deimel and Naveda. (The report makes a case for the importance of teaching program reading skills, reviews the relevant literature, discusses how program reading can be taught, and illustrates teaching suggestions using a substantial Ada program. It contains an extensive, annotated bibliography.) The workshop introduced a simple model of program comprehension, discussed comprehension goals for reading, and gave participants both general and specific strategies for understanding programs. Instead of using Deimel’s and Naveda’s case study, actual artifacts from Widget were used to illustrate comprehension issues, concerns, and principles. An example of the material in the comprehension unit is a brief discussion of how we come to understand what we read. We assume there exists an independent reality, the real world. We are interested in a small portion of that reality that is our particular application area. We think of the application as an abstraction of the real world. Our job as systems developers is to translate the features of that abstraction into the computer domain. There are thus two translations to be dealt with, the first from the real world into application terms, and the second from the application domain into computer terms. We come to understand these different domains (real world, application, and computer) by constructing models of them, and then we test those models by having a dialogue [Schön 1983] with them in light of what we seek to accomplish (that is, compute). Reading and understanding a program is a complex process of translating, interpreting, and hypothesis testing among these (and possibly intermediate) domains. In addition to the introduction of program comprehension material, there are three aspects of our form of inspection instruction that are distinctive that differ from “traditional” instruction, and may therefore have had some influence on the effectiveness of instruction and the
conduct of inspections. First, we develop the process of inspection during the course, from the requirements and design elicited there. We do not arrive with a prepared process. Second, the participants develop their own checklists based on ones available in the public domain that we supply. The participants usually develop two sets of checklists, one for each type of artifact they decide is most important for them to inspect. Code and requirements are the typical choices. Again, we do not arrive with the final, “best” checklists. Third, the workshop participants select the artifacts to be inspected, one artifact of each type. Our advice is to select the oldest, most reliable artifacts that can be found. That way, finding defects using the new inspections process impresses even the most skeptical participants.
1. RESULTS Case studies are, by their nature, not generalizable. If one recalls Thorngate’s clock [Thorngate 1976], there is a “G” for generalizable at 12 o’clock, an “S” for simple at 4 o’clock, and an “A” for accurate at 8 o’clock. Thorngate’s dictum is that any one study is like a one-armed clock: it cannot be simultaneously general, accurate, and simple. Our study is accurate at the expense of the other two factors. Because the training of Group 1 grew, in part, out of dissatisfaction with the number of defects still found by customers, it was natural to examine customer defect reports for evidence of improvement. This was easily done, as written defect reports were received daily and were handled in the same, standard manner for all three groups. Reported defects were classified as “critical,” “serious,” or “other.” Critical defects were those that either crashed the system or prevented the application from proceeding. Serious defects resulted in the production of wrong answers. All less severe defects were classified as “other.”2 Of course, the software engineers trained in our two workshops took some time to begin applying the material presented. Moreover, only after inspected materials were released and in the field for a time did they begin to generate customer defect reports. From a detailed analysis of 2
Each of the groups also classified the type of error, though each used a different scheme. Groups 2 and 3 created their own, different defect categories, and Group 1 was trained in orthogonal defect classification [Chillarege]. The incompatibility of these defect taxonomies precluded drawing meaningful inferences about the differences in the types of defects detected.
defect reports, it was determined that reports applying to software released by Group 1 made the transition from being predominately about pre-workshop modules to referring to post-workshop-inspected modules approximately eight weeks after the training was completed. After this time, post-workshop-inspected modules continued to predominate in the defect report stream for Group 1. About 40 days after this time, defect reports were nearly exclusively about software inspected after the training. The transition between defect reports of pre- and postworkshop work products was short because most customer-discovered defects relate to fixes or enhancements requested by the customers themselves. Newly delivered code is checked immediately upon delivery by the customers or their representatives, who want to make sure it works correctly. In order to establish a baseline to characterize error reports before our training workshops could exert any influence on behavior, we examined defect reports before and after the last workshop, counting critical and serious defects only. According to our analysis, there was no change in the pattern of Group 1 defects until about 10 working days3 after the perceived inspection process changeover point referred to above. Groups 2 and 3 showed essentially steady-state behavior during this entire period, as one would expect. We therefore used the 10 days before the pattern of reported Group 1 defects began to change as our baseline period. Reports of critical and serious defects for which each of the three groups was responsible were counted during this period, and the average number of defects per day for each group was computed. Rather than presenting numbers of defects, we have expressed the data values as a percentage of the baseline average for each group. This seemed a fair way to measure pre-workshop (baseline) performance because (1) the groups were performing comparable tasks, (2) the groups had similar customer-identified defect rates, and (3) all groups inspected some of their work products, but not all. The actual number of critical and serious defect reports received daily for each of the three groups was plotted for
3 The data presented cover regular work days and exclude weekends and holidays, on which customer representatives do not normally work. Note that the modules most heavily used at any given time depend on the point in the product-development life cycle at which customers are working We did not try to account for effects that might have been attributable to changing usage patterns, in part because, across the three groups, there is considerable parallelism among the dozen or so products undergoing user development.
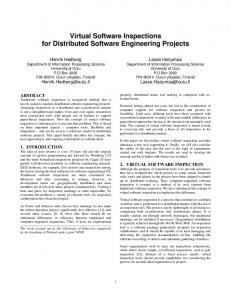
110 days, beginning on the first day of the 10-day baseline period. These data are shown in Figure 1. We could have gone back much further than 10 days, but there would have been no change in the patterns seen. Plots by defect type (critical, serious, other) reveal the same pattern as the plots shown. As might be expected, the data for Groups 2 and 3 vary around 100%, roughly between 0 and 2.5 times the average number of reports in the baseline period per day. The Group 1 data, on the other hand, are distinctive, after the first 10 days. The customer-reported defects come directly from reports submitted by customers. Figure 1 shows the (normalized to 100%) number of defects recorded on such reports each day. Although the data do include multiple reports of the same defects, there are, in fact, few such duplications. The users are closely-knit and generally decide together to submit defect reports. Group 3 disputed the validity of several reports (that is, its members believed that no defect was indicated), and these are not represented; on days on which all of the Group 3 defects were disputed there is a zero count.4 Group 1, on the other hand, decided, as a matter of policy, that any customerreported defect is a defect, ipso facto. It would have been useful to have been able to collect and compare defect densities, error injection rates, productivity, and other statistical measures of cross-group differences and similarities. No such measures were available, at least in part because none of the groups use an automated configuration management system, which could track easily the actual changes in code. Also, the lack of software configuration management made it impractical for us to ascertain the rate of errors introduced while trying to fix bugs, which can be quite large. We observe, though, that Groups 2 and 3 have been in existence longer than Group 1 and therefore may be more “mature” in some sense.
2. ANALYSIS Figure 1 suggests dramatic improvement in the postworkshop performance of Group 1. During the first 10 days, all three groups display the same up-and-down
4 A zero count occurs when the development group does
not agree that the user has found an error. In other words, there were no errors found for that day, even though some may have been reported.
300%
Fig. 1. N umber of post release critical and serious defect reports of Groups 1-3 by day, expressed as percentage of baseline average.
Grou p 1
250%
Grou p 2
Defects as percent of baseline
Grou p 3 200%
150%
100%
50%
0% 1
11
21
31
41
51
61
71
81
91
101
Work day number
behavior of the number of defects attributable to their work. (There is no reason to expect that the number of reports should be constant from day-to-day.) In terms of absolute numbers, Group 1 was in the middle of the pack, as it had been for the previous 18 months. Then, after the products that Group 1 produced and inspected using the workshop methods begin to be released, there is a clear decrease in the number of post-release defects, 300%
those discovered by users. As can be seen from the scale of Figure 1, the rate drops to about 10% of the baseline average. In other words, there was a 90% reduction in the number of post-release defects per day discovered by users. Figures 2-5 show individual curves for the three Groups. Figure 2 shows Group 1’s up-and-down behavior during the first 10 days of this study, more characteristic of Groups 2 and 3. Then there is a steady drop in the number of defects reported by users. Figure 3 illustrates this decrease more clearly because of a 60%
Fig. 2. N umber of post release critcial and serious defect reports by Group 1 by day, as expressed as percentage of baseline.
200%
50%
Defects as percent of baseline
Defects as percent of baseline
250%
150%
100%
50%
Fig. 3. N umber of post release critcial and serious defect reports by Group 1 by day, beginning w ith D ay 11, as expressed as percentage of baseline. (N ote change of Y-axis compared w ith Fig. 2)
40%
30%
20%
10%
0% 1
11
21
31
41
51
61
71
81
91
101
Work day number 0% 11
21
31
41
51
61
71
Work day number
81
91
101
300%
to program better in the first place. No special pattern is apparent in the data for Groups 2 and 3. Fig. 6. Repair time of defects by day, expressed as percentage of baseline. Groups 2 & 3 = 100%.
300%
Grou p s 2 & 3
250%
Grou p 1 Time to repair as percent of baseline
vertical scale change resulting from showing only the data from the eleventh day onward. Figure 4 shows Group 2’s post-release defect discovery history, and Figure 5, Group 3’s. Groups 2 and 3 serve as control groups here—they were doing nothing differently—so there is no reason to expect their defect rates to show changes. Group 3 has a larger variance than Group 2, and also has many more zero counts.
200%
150%
100%
50%
Fig. 4. N umber of post release critical and serious defect reports of Group 2 by day, expressed as percentage of baseline average.
250%
0% 1
11
21
31
41
51
61
71
81
91
101
Defects as percent of baseline
Work day number
200%
2. Does some other activity account for the difference in post-release defect discovery? We compared over time the relative effectiveness of testing, inspections, and postrelease discovery in Figures 7-9. Times 1, 2, and 3 in these figures represent times just before inspection training, a few months after training, and a year or two after training, respectively.
150%
100%
50%
0% 1
11
21
31
41
51
61
71
81
91
101
Fig. 7. Percentage of Group 1 defects detected by mechanism over time.
Work day number 100%
Fig. 5. N umber of post release critical and serious defect reports for Group 3, by day, expressed as percentage of baseline average.
250%
Defects as percent of baseline
%-age of all defects detected
300%
Test 50%
Inspections Post Release
200% 0% 1
150%
2
3
Time period (see text)
100%
50%
0% 1
11
21
31
41
51
61
71
81
91
101
Work day number
Using the data available, we investigated two questions: 1. How does the decrease in the number of defects discovered post-release by users relate to the cost to repair those defects? In other words, do users discover the really difficult and expensive-to-fix defects, or do inspections catch them? We used effort, that is, time, to indicate cost. Repair data came directly from the defect reports. All groups report the time they spend repairing each defect. Figure 6 shows our findings: there is a significant reduction in the per-defect cost to repair user-discovered, post-release defects from Group 1, but not from Groups 2 and 3. We infer from this that Group 1 is either identifying expensive-to-repair defects before release or learning
It is generally agreed that there are two ways to identify defects pre-release: reviews and testing. As noted at the beginning of this paper, inspection is a form of software review. The literature on the benefits of inspections commonly notes that the percentage of pre-release defects caught by inspections (and without testing) evolves from 0% before implementing inspections, to 70-80% after inspections are fully implemented; the remainder of prerelease defects being identified through testing [Gilb]. That was also Widget’s experience, as seen from the figures. The authors are unaware of any literature about the impact of inspections specifically on post-release defects.
tions, however, is that, in the past, we may have paid too much attention to the global software review process and too little attention to the conduct of an individual and perhaps weighty process, namely the actual review of the software product.
Fig. 8. Percentage of Group 2 defects detected by mechanism over time.
%-age of all defects detected
100%
Test 50%
Inspections Post Release
0% 1
2
3
Time period (see text)
Figures 8 and 9 indicate that Groups 2 and 3 did not experience a decrease in the percentage of defects discovered post-release by users, but, according to Figure 7, Group 1 did. In fact, according to the figures, the decrease in Group 1’s post-release defect discovery was due, in large part, to inspections. Fig 9. Percentage of Group 3 defects detected by mechanism over time.
%-age of all defects detected
100%
Test 50%
Inspections Post Release
0% 1
2
3
What became obvious from the Widget experience was that individual software professionals have widely differing, sometimes poorly conceived, comprehension strategies. We often heard orally in follow-up sessions from workshop participants that, for the first time ever, they were able to say with some certainty that they did or did not understand what they were reviewing. Comprehension skills can be improved with training. (Ideally, comprehension skills should be taught much earlier in their careers of software professionals [Deimel 1985].) Better comprehension skills among reviewers will likely facilitate development of a shared vision of what software products should look like in order to be understood, a vision that should feed back into the software process planning in a more effective way than merely following checklists. In fact, one author (Rifkin) uses this realization by clients as a milestone to assure that they understand the critical importance of comprehension: you cannot inspect what you cannot understand. Thus arises a new entry criterion for inspections: inspectability—can I comprehend what you have given me to review?
Time period (see text)
3. IMPLICATIONS Did Group 1 improve simply because we paid attention to it—the so-called Hawthorne effect? We cannot say, but we have reason to doubt it. Like Groups 2 and 3, Group 1 knew it was being trained. It did not know it was being studied, however, as all the data collection and analysis were done after the fact from routine paperwork. Moreover, the Hawthorne effect presumably wears off after a time, and we saw no such effect. Some authors even argue that there never was a Hawthorne effect, that it was an artifact of the underlying Hawthorne site experiment and analysis [Jones 1992]. The Widget experience suggests a number of inspectionsrelated lessons or, at the very least, some ideas to be further explored. To begin with, it suggests that we should not be complacent about having discovered the ultimate form of group software review. Some writings, on inspections particularly, suggest fixed necessary and sufficient conditions required for effective reviews [Fagan]. Yet the nature of the defect classification used and the degree to which reviewers “own” their own process— other distinctive features of the training given members of Group 1—may play a significant role in making reviews useful. The primary lesson to be learned about inspec-
The apparent effectiveness of the inspection workshop is remarkable in light of the relatively superficial treatment given to program comprehension ideas. We theorize, however, that the material presented gave attendees a new way to think about programs and about what it means to examine them. This re-orientation may have been sufficiently powerful in its own right that the lack of supporting details was not a serious impediment to the development of improved program comprehension skills. Along with the introduction to program comprehension, we make the point repeatedly during training that this is just the beginning of a lifelong process of learning of how to understand what you read. The extensive bibliography of Deimel and Naveda [1990] suggests as much. There could be many reasons for increased defect identification, as we have stated elsewhere and summarize here, as they are threats to our conclusions: 1. 2. 3. 4.
In some important ways Group 1 is different than Groups 2 and 3. The choice of an inspections process was determinative. The timing was ideal in that Group 1 was frustrated with comprehension and the training answered an immediate concern. The development of custom, tailored checklists was determinative.
Again, because this is a case study and not controlled in any way, we cannot directly address these alternative hypotheses. Aside from the quantitative results presented, we worked with the Group 1 members and learned about the differences through unstructured dialog. That dialog supported the effect of comprehension training and did not identify any of the factors above. This study points to the importance of comprehension research in stark financial terms, as the comprehension training seems to have led to the identification of significant software defects not caught using a more simpleminded approach to software inspection. This research should continue, and the effect of program comprehension training on the identification of software defects should be examined in greater detail. It would be interesting, for example, to see the effect of providing only comprehension training to a group already performing inspections. (What would happen if Group 2 or 3 were given a 2-3 hour comprehension workshop?) If indeed comprehension training improves performance during inspections, another interesting question is what material is most effective to present and what material can be used later to insure continuously improving inspection results. Acknowledgments A very early draft was presented at the 19th Annual NASA Software Engineering Workshop in Greenbelt, Maryland, 1994. We are indebted to our colleagues for their comments and feedback: Bill Brykczynski, Marilyn Bush, Bob Grady, Phillip Johnson, Frank McGarry, K. David Neal, Ron Radice, and Ed Weller. References [Chillarege 1992]
R. Chillarege, R., et al., “Orthogonal Defect Classification-A Concept for In-process Measurements,” IEEE Trans. Softw. Eng. 18, 11, (November 1992) 943-956.
[Deimel 1985]
Deimel, L. E. “The Uses of Program Reading,” ACM SIGCSE Bulletin 17, 2 (June 1985) 5-14.
[Deimel 1990]
Deimel, L. E., and J. F. Naveda. Reading Computer Programs: Instructor’s Guide and Exercises. Educational Materials CMU/SEI-90EM-3, Software Engineering Institute, Carnegie Mellon University, Pittsburgh, Pa., 1990. Available electronically from the SEI via anonymous ftp from ftp.sei.cmu.edu as files em-3.ps and em-3code.txt in /pub/education.
[Fagan 1976, 1986, 1994]
Fagan, M. E. “Design and Code Inspections to Reduce Errors in Program Development.” IBM Systems J. 15, 3 (1976), 182-211;. Also Fagan, M. E,. “Advances in Software Inspections.” IEEE Software SE-12, 7 (July 1986) 744-751;. Also Strauss, S., and R. Ebenau. Software Inspection Process,. New York: McGraw-Hill, 1994.
[Freedman 1982]
Freedman, D. P., and G. M. Weinberg. Handbook of Walkthroughs, Inspections, and Technical Reviews, 3rd Ed. New York: Little, Brown, 1982.
[Gilb 1993]
Gilb, T. Principles of Software Engineering Management. Wokingham, England: Addison-Wesley, 1988, Chapter 12;. Also Gilb, T., and Graham, D. Software Inspection. Reading, Mass.: Addison-Wesley, 1993.
1988,
[Humphrey 1989]
Humphrey, W. S. Managing the Software Process. Reading, Mass: Addison-Wesley, 1989, Section 15.4.3ff.
[Jones 1992]
Jones, S. R. G., “Was There a Hawthorne Effect?” American J. Sociology 98, 3 (November 1992) 451-468.
[Schön 1983]
Schön, D. A., The Reflective Practitioner: How Professionals Think in Action. New York: Basic Books, 1983.
[Thorngate 1976]
Thorngate, Warren., “’In general’ vs. ‘it depends’: some comments of the Gergen-Schlenker debate,” Personality & Social Psychology Bulletin, 2 (1976) 404-410.