Program Restructuring Using Agglomerative Clustering Technique Based on Binary Features Rashid Naseem1 , Adeel Ahmed2 , Sajid Ullah Khan3 , Muhammad Saqib4 , Masood Habib5 134
Dept. of Computer Science, City University of Science and Information Technology Peshawar, Pakistan 2 Dept. of Computer Science, Quaid-i-Azam University Islamabad, Pakistan 5 Dept. of Computer Science, Mohammad Ali Jinnah University Islamabad, Pakistan
[email protected],
[email protected], sajid
[email protected],
[email protected],
[email protected]
Abstract—Restructuring makes large programs highly cohesive and decomposes the statements into meaningful functions. These meaningful functions help the programmer to understand and maintain the code easily. In this paper, we apply agglomerative clustering technique to restructure the program using binary features. Our approach uses Jaccard similarity measure for binary features to assess the clustering process. We applied this approach to two non-cohesive structured programs available openly. We provide comparative evaluation in which clustering algorithms and similarity measures are used to validate our clustering results. Results indicate that this approach produces clustering that helps to translate a non-cohesive procedure into cohesive procedures. Index Terms—Re-engineering, Jaccard Measure, Binary Features, Resemblance Coefficient, Complete Linkage, UPGMA
I. I NTRODUCTION Legacy software systems are still operational in the organizations but difficult to maintain. Software systems require changes since user requirements and technology change with the passage of time. The structure of a software system deteriorates due to these changes [1]. As a result, a program may become large and complex. This poorly designed program becomes difficult to maintain. Restructuring a poorly designed program can reimplement and transform into a form that has better understandability and maintainability with less cost [2], [3], [4]. Restructuring is a useful step for Re-engineering [5], [6] and also enable Reversengineering to extract high level design [7], [8], [9]. Reengineering is an activity that improves the understandability of software, improves the software structure and reimplements the changes made to the software structure [2]. Reverse engineering is the process of analyzing a system to identify the main components of the system and to create an abstract view of the system [10], [4]. Restructuring structured programs achieve high cohesion and low coupling if the non-cohesive statements and interdependent statements keep separatley in a single procedure. Therefore, changes made to one procedure will have no or little impact on other procedures. 978-1-4673-4451-7/12/$31.00 ©2012 IEEE
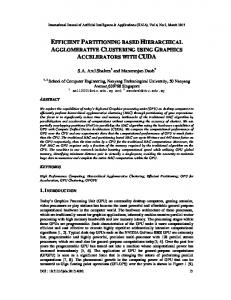
A number of clustering techniques have been used for software Re-engineering [11], [5], [12], [13], [14], [15]. Clustering have also been studied for restructuring [16]. An approach [16] used clustering technique Unweighted Pair Group Method using Arithmetic Averages (UPGMA) algorithm [17] while using a Resemblance Coefficient (RC) with weighted features. The work presented in this paper is to use the Complete Linkage (CL) algorithm with Jaccard similarity measure using binary features, to group the similar statements into a noncohesive structured program. Binary features just indicate the absence or presence of a feature. At this stage, it is important to point out that the work done in this paper does not attempt to automatically restructure the program. Our focus is on the correctly translation of a program into group of statements, to make cohesive procedures, because a program incorrectly translated may result in more problems as compared to original one [16]. This paper is organized as follows. In Section II we describe the process of clustering for selection of entities and features, and applying clustering technique. In Section III we present the closely related work in detail. A comparative analysis of CL using Jaccard similarity measure for binary features and UPGMA algorithm using Resemblance Coefficient is present in Section IV. Finally in Section V, we present the conclusions and future work. II. OVERVIEW OF C LUSTERING In the clustering process, statements are grouped together based on their features. In this section, we provide an overview of the steps in clustering. A. Selection of Entities and Features We are interested in restructuring the programs taken from source code written in structured languages. An existing approach [16] used a non-cohesive structured program for restructuring as given in Figure 1. Program-1 consists of number of statements and variables to execute two different tasks in one procedure. We consider statements as entities and
TABLE I EF MATRIX FOR A PROGRAM
variables as features. We have grouped the statements based on the dependency relationship exists among the statements. E1 E2 E3 E4
f1 1 1 1 1
f2 1 1 0 0
f3 0 0 0 0
f4 0 0 0 0
f5 1 0 0 1
f6 0 1 1 0
TABLE II S IMILARITY M EASURES FOR BINARY FEATURES S. No 1 2 3
Fig. 1.
Structured program-1: A non-cohesive procedure [16]
Different kinds of dependencies exist among the statements which help in recognized the associations. Figure 1 present a structured program. Preprocessing of the structured program involves the identification of the following dependencies [16]: 1) Direct data dependency (Variable Updated): Consider a statement in Figure 1, such as sum=sum + i; Here the statement uses the variable ’sum’ shows direct data dependency between a statement and a variable ’sum’, as ’sum’ is an updated variable. 2) Direct data dependency (Variable Used): Variable ’i’ in a statement sum=sum + i; as ’i’ is a variable that is only used in this statement. 3) Indirect control dependency: A statement depends upon the upper limit of the loop. For example statement sum=sum + i; is indirectly control by variable ’m’ in statement 7. 4) Control dependency: A statement which is under an if-else or loop block. Before applying a clustering algorithm, a program must be parsed to extract entities/statements and features/variables. The result is an EF (Data) matrix, where E is the number of entities and F is the number of features. Table I presents an EF matrix of a structured program containing 4 entities and 6 binary features. Feature f1 is present (1) in all entities while features f3 and f4 are absent (0) in all entities. Features f2, f5 and f6 are present or absent in entities. B. Selection of Similarity Metrics In the second step, a similarity measure is applied to compute similarity between every pair of entities, resulting in a similarity matrix. Some well known similarity measures for binary features are given in Table II.
Name
Mathematical representation
Jaccard Russell & Rao Simple Matching
a/(a + b + c) a/(a + b + c + d) (a + d)/(a + b + c + d)
In Table II a, b, c and d can be determined using Table III. For two entities E1 and E2, a is the number of features that are present in both entities E1 and E2 (1-1 match), b represents features that are present in E1 but absent in E2 (1-0 match), c represents features that are not present in E1 and present in E2 (0-1 match), and d represents the number of features that are absent in both entities (0-0 match). TABLE III C ONTINGENCY TABLE
E1
1 (Presence) 0 (Absence) Sum
E2 1 (Presence) a c a+c
0 (Absence) b d b+d
Sum a+b c+d n
C. Clustering Algorithm The next step is to apply a clustering algorithm, which may be hierarchical or non-hierarchical. Clustering techniques can be divided into two categories i.e. partitional and hierarchical. Hierarchical methods produce a nested series of partitions, while partitional methods produce only one [18], [19]. The hierarchical technique is further divided into two categories i.e. agglomerative and divisive. In divisive technique, all the entities are considered to be in single cluster. The cluster is then divided into sub clusters until the stopping criteria is met. In agglomerative technique all the entities are considered to be a separate cluster. Then two most similar clusters are merged together until the stopping criteria is met. The widely used agglomerative hierarchical algorithms is Complete Linkage (CL). As we are interested only in this algorithm, therefore main steps of CL algorithm is given in Algorithm 1. After applying clustering algorithm, hierarchy of results obtained and can be shown with the help of tree like structure known as dendrogram.
III. E XISTING A PPROACH In this section we discuss the work done by [16], which is closely related to our work. CH. Lung and M. Zaman have proposed a new similarity measure “Resemblance Coefficient” (RC), to compute the similarity among the statements (entities). The similarity matrix is constructed using the resemblance coefficient that is calculated by the following formula: RC =
W a ∗ a + W b ∗ b + W c ∗ c + Wd ∗ d + We ∗ e W a ∗ a + W b ∗ b + Wc ∗ c + Wd ∗ d + W e ∗ e + f
(1)
where a, b, c, d, e and f are different type of association, representing qualitative data such that: a= 4-4 match, b= 4-3 and 3-3 total number of matches, c=2-2 match, d=1-1 match, e=4-2, 2-4, 3-2, 2-3 and f =4-0, 0-4, 3-0, 0-3, 2-0, 0-2, 10, 0-1. 4 has assigned to direct data dependency (variable updated), 3 has assigned to direct data dependency (variable used), 2 has assigned to indirect control dependency and 1 has assigned to control dependency. The weights are assigned as Wa = 16, Wb =8, Wc =2, Wd =1, We =2. Here we can see that higher weights have been assigned to data dependencies and lower weights assigned to control dependencies. Higher weight indicate more importance. After calculating the resemblance coefficient among the statements, the UPGMA algorithm is used to group similar statements, which have high coefficient value. The main steps of UPGMA are given in Algorithm 2: IV. C LUSTER E VALUATION BASED O N C OMPARATIVE O BSERVATION B ETWEEN CLA AND UPGMA A LGORITHMS We perform cluster analysis on CL Algorithm using Jaccard similarity measure that is implemented in Java by giving different input files as a data matrix and compare our results with the results of UPGMA algorithm with RC measure. We have applied clustering technique on two programs. In this Algorithm 1 Complete Linkage Algorithm Input: An (n x p) matrix Output: Hierarchy of Clusters 1: 2: 3: 4:
5:
Create a similarity matrix by calculating similarity between each pair of entities using similarity measure. repeat Cluster the two most similar entities i.e. find the maximum similarity in Similarity matrix. Re-calculate the similarity between the new cluster and other entities i.e. suppose E1, E2, E3 are entities. The newly formed cluster is E23. Then the similarity between E1 and E23 is updated by the following formula. Similarity(E1, E23) = min(Similarity(E1, E2), Similarity(E1, E3)) until The required number of clusters are formed or all the entities are in single cluster
section, we provide the discussion on results obtained using these techniques. A. Cluster Analysis for Program-1 Program-1 is shown in Figure 1. This program can be easily divided into two cohesive procedures for communicational, logical, procedural and coincidental type of cohesion. Program-1 sum the m number if flag is true and find the product on n number if flag is off. The binary EF matrix for program-1 is shown in Table IV. The reserved keywords if, while1 , else, and while2 are introduced due to the control dependencies. For the statements S6 and S8, if is present ‘1’, while1 is only present for S8, else is present for S14 and S16 and while2 has entry present for S16. Same entires have done for control dependencies in non-binary EF matrix, as given in Table V. The user defined variables m, n, sum and prod are introduced due to data dependencies. In Table IV the variable m is present for S8 while variable n is present for S16, sum is present for S6 and S8, and prod has entry present for S14 and S16. For data dependencies, the presence of variables are shown in non-binary EF matrix in Table V as described in Section III. We have applied our technique using CL algorithm with Jaccard similarity measure on EF matrix IV and the result is shown in Figure 2 as a dendrogram. The result of UPGMA algorithm using RC can be seen in Figure 3. The dendrogram given in Figure 2 is compared with the existing approach’s dendrogram, as shown in Figure 3. Algorithm 2 UPGMA Algorithm Input: An (n x p) matrix Output: Hierarchy of Clusters 1: 2: 3: 4:
5:
Create a similarity matrix by calculating similarity between each pair of entities using similarity measure. repeat Cluster the two most similar entities i.e. find the maximum similarity in Similarity matrix. Re-calculate the similarity between the new cluster and other entities i.e. suppose E1, E2, E3 are entities. The newly formed cluster is E23. Then the similarity between E1 and E23 is updated by the following formula. Similarity(E1, E23) = (1/2)*(Similarity(E1, E2) + (1/2)*Similarity(E1, E3)) until The required number of clusters are formed or all the entities are in single cluster TABLE IV B INARY EF MATRIX FOR PROGRAM -1
S6 S8 S14 S16
if 1 1 0 0
Control Dependencies while1 else while2 0 0 0 1 0 0 0 1 0 0 1 1
Data Dependencies m n sum prod 0 0 1 0 1 0 1 0 0 0 0 1 0 1 0 1
TABLE VI B INARY EF MATRIX FOR P ROGRAM -2
S6 S7 S10 S11 S13 S14 S16 S18 S19
Control Dependencies while if1 if2 for 1 0 0 0 1 0 0 0 0 1 0 0 0 1 0 0 0 1 0 1 0 1 0 1 0 1 1 1 0 1 0 0 0 1 0 0
days 1 1 0 0 1 1 1 1 0
i 1 0 0 0 0 0 0 0 0
sale 0 1 0 0 1 1 0 0 0
Data Dependencies total sale total pay 0 0 0 0 1 0 0 1 1 0 0 1 0 1 0 1 1 0
pay 0 0 0 0 0 0 0 1 0
profit 0 0 0 0 0 0 0 0 1
cost 0 0 0 0 0 0 0 0 1
pay 0 0 0 0 0 0 0 4 0
profit 0 0 0 0 0 0 0 0 4
cost 0 0 0 0 0 0 0 0 3
TABLE VII N ON - BINARY EF MATRIX FOR P ROGRAM -2
S6 S7 S10 S11 S13 S14 S16 S18 S19
Control Dependencies while if1 if2 for 1 0 0 0 1 0 0 0 0 1 0 0 0 1 0 0 0 1 0 1 0 1 0 1 0 1 1 1 0 1 0 0 0 1 0 0
days 2 2 0 0 2 2 2 2 0
i 4 0 0 0 0 0 0 0 0
sale 0 3 0 0 3 3 0 0 0
It is shown in both the results that pair of statements (S6, S8) and (S14, S16) have high similarity/cohesion values. These two clusters have ‘0’ similarity value in both the dendrogram, so these clusters are not related. We also analyzed during clustering that S6 or S8 show no resemblance or similarity with S14 or S16. It is observed that our simple method of binary features using Jaccard measure is also able to cluster the highly related statements in a program.
TABLE V N ON - BINARY EF MATRIX FOR P ROGRAM -1
S6 S8 S14 S16
Fig. 2.
if 1 1 0 0
Control Dependencies while1 else while2 0 0 0 1 0 0 0 1 0 0 1 1
Data Dependencies m n sum prod 0 0 4 0 2 0 4 0 0 0 0 4 0 2 0 4
Dendrogram for the result of binary EF matrix of program-1
Data Dependencies total sale total pay 0 0 0 0 4 0 0 4 4 0 0 4 0 4 0 3 3 0
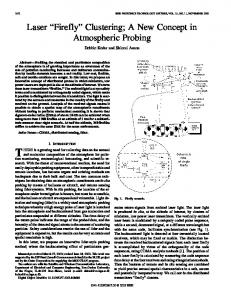
B. Cluster Analysis for Program-2 We also analyze our cluster results by giving different input files that is Program-2, in the form of EF matrix to CL algorithm. Program-2 is a non cohesive structured procedure to calculate two different outputs using same input values, as shown in Figure 4. This procedure also depends on a flag to begin the calculation. The procedure first read input from the user and if flag is true then calculate the total pay and total sale to find the pay and profit. The binary and nonbinary EF matrix with 9 entities and 12 features, are shown in Table VI and Table VII, respectively. Both the tables contain control dependencies (i.e. while, if1, if2 and for) and data dependencies (i.e. days, i, sale, total sale, total pay, pay, profit and cost). The results are shown in Figure 5 and Figure 6, as the results of CL algorithm with Jaccard similarity measure and UPGMA algorithm with RC measure, respectively. One can see from the dendrograms that both the techniques have made three clusters
Fig. 3.
Dendrogram for the result of non-binary EF matrix of program-1
Fig. 6.
Fig. 4.
Dendrogram: Result for UPGMA algorithm using RC measure
Structured Program-2: A non-cohesive procedure [16]
Fig. 7.
Fig. 5.
Dendrogram: Result for CL algorithm using Jaccard measure
i.e. (S6, S7), (S10, S13, S19) and (S11, S14, S16, S18). It means that program-2 can be divided into three procedures. Figure 7 shows these three procedures [16], with the help of an expert. We observed that our technique using binary features can achieve better results as compare to other. Our technique is simple to understand and implement, while the existing approach [16], needs weighted measure with different weighted features. V. C ONCLUSIONS AND F UTURE W ORK Various techniques have been used to restructured the noncohesive programs. Clustering technique is the simple technique to find the cohesive statements in a program using similarity measures. In this paper, we presented an agglomerative clustering technique to restructure non-cohesive procedure into cohesive procedures with out changing the behavior of procedures. Our approach of clustering process consists of
Restructured Program-2 with the help of an expert [16]
preprocessing of source code to get the EF matrix, clustering using Complete Linkage algorithm with Jaccard measure and the evaluation of clustering results based on some experimental observations. Our approach is the added benefit that it is very simple to understand and implement. It uses binary features, just to indicate the presence and absence of features. The similarity can find through Jaccard similarity measure. In this paper, we analyzed the performance of the Complete linkage algorithm using Jaccard measure for binary features. The experimental results revealed that this approach can produce better results to restructure a non-cohesive program. In the future, it will be interesting to evaluate the performance of Complete Linkage algorithm and Jaccard measure on other large non-cohesive systems. We also plan to investigate other clustering algorithms and similarity measures with binary features, as well for non-binary features in the context of program restructuring. R EFERENCES [1] M. Lehman and L. Belady, Program Evolution - Processes of Software Change. Academic Press Professional, Inc., 1985. [2] B. B. Agarwal, S. Tayal, and M. Gupta, Software Engineering and Testing: An Introduction. Jones and Bartlett, 2003.
[3] R. S. Arnold, “Software restructuring,” Proc. IEEE, vol. 77, no. 4, pp. 607 – 617, 1989. [4] E. J. Chikofsky and J. H. C. II, “Reverse engineering and design recovery: A taxonomy,” IEEE Software, vol. 7, no. 1, pp. 13 – 17, 1990. [5] H. M. Sneed and G. Jandrasics, “Software recycling,” Proc. of the 8th Working Conference on Reverse Engineering, pp. 103 – 114, 2001. [6] R. C. Waters, “Program translation via abstraction and reimplementation,” IEEE Transactions on Software Engineering, vol. 14, no. 8, pp. 1207 – 1228, August 1988. [7] P. T., Breuer, and K. Lano, “Creating specifications from code; reverseengineering techniques,” Journal of Software Maintenance: Research and Practice, vol. 3, pp. 145 – 162, 1991. [8] P. A. Hausler, M. G. Pleszkoch, R. C. Linger, and A. R. Hevner, “Using function abstraction to understand program behaviour,” Journal of IEEE Software, vol. 7, no. 1, pp. 55 – 65, 1990. [9] M. Ward, “Abstracting a specification from code,” Journal of Software Maintenance: Research and Practice, vol. 5, pp. 101 – 122, 1993. [10] P. Grubb and A. Armstrong, Software maintenance: concepts and practice. River Edge, N.J. : World Scientific, 2003. [11] R. Naseem, O. Maqbool, and S. Muhammad, “Improved similarity measures for software clustering,” 15th European Conference on Software Maintenance and Reengineering, pp. 45 – 54, March 2011. [12] P. Andritsos and V. Tzerpos, “Information theoretic software clustering,” IEEE Trans. Software Eng., vol. 31, no. 2, pp. 150 – 165, February 2005. [13] O. Maqbool and H. A. Babri, “Hierarchical clustering for software architecture recovery,” IEEE Trans. Software Eng., vol. 33, no. 11, pp. 759 – 780, November 2007. [14] R. Naseem, O. Maqbool, and S. Muhammad, “An improved similarity measure for binary features in software clustering,” Proc. of the Int’l. Conference on Computational Intelligence, Modelling and Simulation(CIMSim), pp. 111–116, September 2010. [15] A. Lakhotia and J. Deprez, “Restructuring programs by tucking statements into functions,” Journal of Information and Softwar Technology, vol. 40, no. 11-12, pp. 677 – 689, 1998. [16] Chung-Horng and M. Zaman, “Using clustering technique to restructure programs,” Int. Source Code Analysis and Manipulation Workshop, 2004. [17] H. C. Romesburg, “Cluster analysis for researchers,” Krieger, Malabar, Florida, 1990. [18] L. Rokach, “A survey of Clustering Algorithms,” Data Mining and Knowledge Discovery Handbook, pp. 269–298, 2010. [19] R. Xu and D. Wunsch, “Survey of clustering algorithms,” IEEE Transactions on neural networks, vol. 16, no. 3, pp. 645–678, 2005.