Programming in a Data Factory Steven L. Tanimoto University of Washington, Seattle, WA USA
[email protected] Abstract Among the advantages of visual dataflow programming is that it can give the user a sense of location for the data in a computation. This can help novices build a mental picture of a program and its execution. This paper presents an experimental programming system called the Data Factory that uses a manufacturing metaphor to give data an even stronger sense of place. A key affordance for learners is the explicit display of every data object as it moves through a factory. The system provides facilities for handling streams of data and parallel operations, as well as basic operations on numerical values. The Data Factory supports low-level computations that might be studied by novices, but it also offers novel constructs that might invite the attention of others.
1. Introduction Dataflow programming has many attractions. These include taking advantage of metaphors to help learners, making associations and data paths among components explicit, and reducing dependency on verbal and textual expressions. An important aspect of dataflow programming from a learning point of view is that it gives an explicit picture of where data can be in relation to the processing components of the program. That sense of place may support a learner in building a mental model of a computation. This paper presents a somewhat new kind of dataflow programming system in which data objects are treated like parts on conveyor belts in factories. This manufacturing metaphor offers several additional attractions, including not only the easy handling of streams and parallelism but making it clear at all times what data is involved in a computation and where the data is in relation to all the operations that have been done on it and the operations that have yet to be done on it. The Data Factory system described here is no doubt not the best way to introduce programming to all students. However, its factory model may resonate with some learners and point to way to filling a gap between systems such as “The Incredible Machine” or “Widget Workshop”
and regular programming languages like Java and Scheme.
2. Previous Related Programming Systems Visual dataflow languages have appeared in a substantial variety. Just a few of them are the following: HI-VISUAL, Prograph, Cantata, Viva, and FLOGO [4, 5, 10, 14]. To a certain extent, AgentSheets [11] and StageCast Creator [13] might be considered dataflow programming environments. However, they don’t explicitly provide dataflow constructs for conventional computing on numerical values. The Data Factory system presented here, could, in principle, be implemented within AgentSheets. However, it was implemented in Java to gain some flexibility in the implementation of the editor and runtime facilities. For one reason or another, most existing systems do not actually show data flowing along paths. Reasons may include not wanting to devote the computational resources needed to animate the data or not being able to provide enough screen real estate to render all the data. Algorithm animation systems typically present algorithms more so than programs. The ToonTalk system of Kahn employs a microworld metaphor that suggests to the user the s/he is creating a Lego toy world of city streets, houses, and robots. The system is programmed primarily by demonstration: a process is modeled by the user and a robot then imitates it. So while its metaphor is something like the factory metaphor described in this paper, it does not support programming process as one of arranging conveyors, etc. in a layout. In [6], Kahn shows how, at the “city” level, ToonTalk can be used to implement cellular-logic or “systolic” computations. It thus supports a sort of parallel processing as does the Data Factory described here. The OBPE system provides a visual language for prototyping factory simulations [12]. As such its intended users are primarily the designers of factory systems rather than students learning about simple forms of computation. It specifically avoids using data flow so that it can place emphasis on objects and alternative views of them for different kinds of users. While the factory metaphor is an important aspect of the Data Factory, one should not claim that this or any
metaphor necessarily increases the usability of the system; Blackwell and Green [2] performed an experiment strongly suggesting that user programming experience plays a much greater role in success with a programming task than the extent to which the programming language employs data flow. A recent system intended to introduce programming using a metaphor is HANDS by J. Pane [8]. In this system, a user works with a collection of cards, somewhat
like a poker hand. Each card contains information that can be accessed and manipulated using the language. Loops are avoided, and the language provides aggregate operations to compensate for this. The strategy used in HANDS of making the context of computation apparent to the user through transparency is also adopted in the Data Factory.
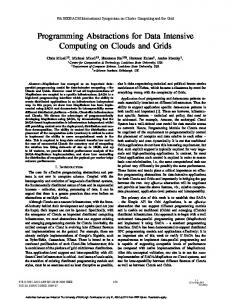
Figure 1. Screen shot of the Data Factory with a layout for computing successive factorials. The tool panel for editing layouts is shown in the lower pane of the window.
3. The Data Factory 3.1. Overview The Data Factory is an experimental visual programming environment with the following features: (1) uses a manufacturing metaphor for its key constructs; (2) supports “fully live” programming – editing the layout while the factory is operating to maximize user feedback; liveness appears to help some users in certain situations and get in the way of others [15]; the Data Factory liveness is optional and users are always able to stop the factory before editing, if they so desire; (3) doesn’t hide its data; (4) supports parallel processing and streams of data. As a language it is not particularly high-level. Also, it does not have any direct support for functional abstraction. It is intended for “programming in the small” and as a experimental context in which to pose and solve simple computational problems. For a screen shot of the program, see Figure 1. From this illustration, it is evident that the implementation of the prototype system is in Java. The window has an upper pane containing the factory and a lower pane containing the tool panel for controlling the factory and arranging its layout. The icons in the tool pane are intentionally simple in this implementation of the Data Factory; this paper is not about icon design. A sample layout is shown in the factory pane. This “program” computes a sequence of factorials: 2, 6, 24, 120, etc. It contains two loops. The first loop is located in the northwest corner of the factory and serves to produce an increasing sequence of factors: 2, 3, 4, etc. The second loop is in the southeast, and it serves to return a copy of the most recent factorial value to the multiplication station, where it can be multiplied by the next factor.
3.2. Devices Provided This section provides an explanation of devices provided in the Data Factory and of the operations of those devices. The icons that correspond to these devices begin at the left side of the bottom row of the tool pane. Constant source. Feeds a constant to its output port 1 whenever there is a vacancy there. Button-activated constant source. Feeds a constant to its output port 1 whenever both the output port is vacant and the button has been pressed. The button immediately resets itself and can be pressed again. Button operated gate. When pressed, it lets its input value move to its output. It immediately resets itself and can be pressed again. Random-number generator. Feeds a random number to its output port 1, whenever it is vacant. The number is
an integer in the range 0 to n-1. Initially n is set at 10, so the numbers are in the range 0 to 9. Using the flashlight tool it is possible to edit the value of n for any instance of a random-number generator. Kloner. Takes one input and propagates it to both outputs. Switched router. The value of input 2 controls which way input 1 goes. A 0 sends it to output 1, and 1 sends it to output 2. Sorter. Implements a compare-and-exchange module. When two inputs are available, they are propagated to the outputs, but the smaller one is always sent to output 1 and the greater one to output 2. Delay. An input arriving at input port 1 is held inside the device until another input arrives on the same port. Input port 2 is ignored. When the second input arrives, the data object being held is released on output 1, and the new input is then held, etc. Delta. Takes a single input stream. Keeps track of the last input value received. It only propagates the input to the output if the value is different from the last one. Also, the first input value that arrives does get passed through, unlike the case with the Delay device. Display and Destroy. Holds the last value received, and any new value overwrites the last one. A display serves as a data sink, allowing data to die and not clog up the conveyors. The icons corresponding to the following devices begin at the left side of the middle row of the tool pane. Conveyor. The user can draw a conveyor belt or a pair of conveyor belts with this tool. Conveyors always go either north, east, west, or south. They are automatically color-coded to show which way they transport data (red = east; light blue = west; dark blue = north; yellow = south). If the user tries to draw a diagonal conveyor belt, this tool will automatically create two separate conveyors in an ell shape to connect the same points. However, the tool uses its own layout method which sometimes, but doesn't always, do what one might want. However, it’s easy to undo any editing action, and the tool works consistently and is not difficult to control. A conveyor is a special kind of component and is not considered to be a processing device in the Data Factory. Crossover. Used to create a processing device that allows two to four data paths to effectively cross each other. Each conveyor that brings inputs to the crossover should have a corresponding conveyor that begins on the opposite side (180 degrees around) the crossover. Input data must arrive inside the device, and outputs are placed just outside the device. Arithmetic devices. These include the following: Add, Multiply, Subtract, Divide, and Mod. Arithmetic comparators. The first of these is Less Than. If its input 1 is less than its input 2, then a 1 is put
onto output 1. If not, a 0 is put out. The next of these is Equal To. The last of these is Greater Than. The icons for the following devices are found at the right end of the top row of icons in the tool pane. Stop Sign. When a data object reaches a stop sign, it stops the factory processing as if the user clicked on the red traffic light icon. Gate. An input arriving at input port 1 waits until any data object arrives at input port 2. Then the gate is momentarily opened and the first data value passes to output port 1. The remaining icons in the tool pane are for running and editing factories.
4. Example Programs To give some feel for the language, it’s helpful to show some examples. The ones given here are a straight conveyor belt with a producer and consumer of number data; a sequence splitter that puts evens on one line and odds on another; a Fibonacci sequence generator, and a sorting network. Each example is shown in a state of execution.
4.1. Conveyor with Random Numbers The simple example in Figure 2 shows a stream of data values moving on a left-to-right conveyor. They are produced by a random number generator and consumed by a display/destroy station.
Figure 2. A simple factory layout with one conveyor connecting a number generator to a display/destroy station. Red conveyors always move data to the east.
Figure 3. The Even-odd sequence sorter. was even or odd, respectively. This parity value moves to the control input port on the gate. There the number on input 1 is directed to either the even or odd output conveyor. It is interesting to note that at the inputs to the gate, the random number and its parity are always paired properly, even though the number might arrive long before its parity value arrives.
4.3. Fibonacci Sequence Producer Fibonacci numbers can provide a moderate challenge to programmers in the Data Factory. This solution makes use of a Delay device that is “primed” with the data value 1. When the user presses the button on the left, a new 1 value is released that moves to the right and is cloned. The original continues right, releasing the 1 stored there in advance. That 1 is then cloned. The original makes its way to the lower right and represents the first Fibonacci number. The new copy moves to input port 1 of the adder and gets added to the copy of 1 made earlier. The resulting value 2 travels back to the left and falls on the upper conveyor to be cloned and release the 1 in the Delay unit that was recently trapped there. That 1 follows the same path as its predecessor, indicating the second number in the Fibonacci sequence. Successive iterations of this process produce as many elements of the sequence as will fit on the output stream conveyors. If they are lengthened or if a Display and Destroy device is placed to consume the sequence, arbitrarily many sequence
4.2. Even-odd Sequence Sorter The example in Figure 3 shows the use of a controlled gate. The factory generates a stream of random numbers at the upper left and sorts them into separate streams of even numbers (upper right) and odd numbers (lower right). This factory works by taking each random number generated at the left and cloning it, feeding the original to the controlled gate and feeding the copy to the MOD unit. The MOD unit will receive its divisor from the buttonactivated constant source; when the user presses this button, a 2 is released. The output of the MOD unit is either 0 or 1, depending upon whether the random number
Figure 4. Fibonacci sequence generator.
elements can be created by the single initial button press. If the user presses the button multiple times, multiple values will propagate simultaneously around the loop and various alternative, non-Fibonacci sequences can be generated depending upon the number and timing of the extra button presses.
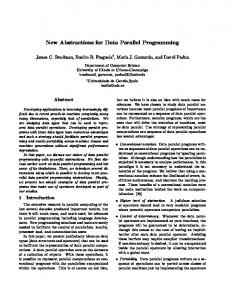
4.4 Parallel Sorting Network Figure 5 shows a factory that sorts random numbers. It makes use of a parallel sorting network constructed with Sort devices and Crossovers.
5. Programming Construct Issues 5.1 Data, Memory, and Data Structures A conventional programming language provides constructs for building complex data objects, including means to create arrays, lists, and tuples. The current version of the Data Factory provides none of these, although it works with sequences of data objects. Only a few notions of memory are supported: data on conveyors that are moving are “stored” on the conveyor for as long as it takes for the conveyor to carry the data to its next destination. If data is backed up on a conveyor because of some data ahead of it waiting to be processed, this data is effectively being stored. Data being held in a Delay
device is temporarily stored there. Data waiting at a Gate is effectively stored until the gate is opened.
5.2 Cloning Data The Klone device that copies data may seem to experienced programmers as a construct that makes a simple operation more cumbersome. After all, a program in a language like Java need only repeatedly reference a variable x to use it multiple times. The Data Factory’s model of computation calls for objects to be consumed when they are used in most cases. (Another system that does this is Linear Lisp [1]). To use one data object for multiple purposes, it is usually necessary to clone copies of it. In traditional manufacturing, copying a part is not typically performed (because it is usually impractical), and if it were performed, it would probably be a costly operation. The Klone device doesn’t cost anything but a little real estate on the screen. Yet its presence seems to make the manufacturing metaphor a little more convincing than if copying were as automatic and “inexpensive” as it is in a traditional programming language. We should note that in object-oriented languages such as Java, it is sometimes necessary to explicitly clone objects in spite of the fact that one object can be referenced multiple times. For example, a single Java “Button” object cannot be placed in multiple panels at the same time.
Figure 5. Sorting factory, based on a parallel sorting network. The button on the left releases a data object with value 1 that opens four gates for random numbers to make their way through the compare-exchange modules and crossovers. On the right are four vertical columns of sorted numbers.
5.3 Loops In the Data Factory there are two ways to obtain automatically repeated computation. One is to use a data generator that continually supplies data to the rest of the factory. The other is to create a “loop” or means for a downstream data object or another object derived from it to propagate back to the beginning of what is effectively a closed, cyclic data path. A loop of this sort is potentially different from a loop in an imperative language program, in part because there is a possibility of multiple data objects circulating simultaneously in the loop. Some computations use a loop as a form of temporary storage to buffer copies of a previously generated data value for later reuse. If all the values in a given loop are always identical, then the timing of loop transits and phase differences among the transiting values may not affect the resulting computation. However, the possibility of timing effects complicates the analysis of some factory programs having loops.
5.4 Generators versus Functions Conventional languages usually support the definition and calling of functions. The Data Factory does not offer an explicit function construct, though it is possible to create factory arrangements with function-like behavior. For example, the Fibonacci sequence may be considered either as a stream or as a function mapping the integers into other integers: f(i). Streams are more natural in the Data Factory, while “callable” functions for specific elements of the same sequence are more difficult to construct but possible. A function in the Data Factory is a portion of the factory where values come in and values go out, and the outputs depend on the inputs. A factory subsystem for a referentially transparent function should contain no buttons or random number generators. Special types of functions can be defined that may help formalize designs for larger systems. For example, we may define a “clean” function in the Data Factory to be a function that obeys this constraint: it takes only one input on each of its input conveyors at a time and produces its output before accepting any new inputs. It may achieve this either via an internal control or by being used in a way that ensures new inputs will not be presented until the last output is ready.
6. Challenges and Opportunities for Learners 6.1 Puzzles and Patterns for Problem Solving Nontraditional programming environments have an important use aside from the teaching of programming itself. It is to support the learning of problem solving.
Many students have been effectively engaged in problem solving activities through the use of The Incredible Machine [9] and ToonTalk [7]. In the case of ToonTalk, for example, Kahn poses a variety of puzzles such as constructing a box containing a given set of data objects. Numerous puzzles can be made up for Data Factory solutions. Some examples are variations on the example programs given here. These include (a) an assembly line that generates random even numbers; (b) a generator for pseudo-Fibonacci numbers following the sequence 1, 1, 1, 3, 5, 9, 17 and the recurrence f(n) = f(n-3)+f(n-2)+f(n-1); (c) a sequence sorter that distributes random numbers k to one of three output conveyors depending on the value of k mod 3; (d) a sorting network for 5 numbers at a time instead of 4. Significantly more difficult challenges are building a factory that produces prime numbers, building a shift register, or simulating a pushdown stack.
6.2 Experience in an Informal User Trial An informal user trial was performed with three highschool students. Two were age 15 and the other age 16. Each student met one-on-one with the author for 22 to 40 minutes. The following paragraphs describe the experience with the first student, and then some differences between the other students and the first are discussed. For the first student (age 15), approximately 5 minutes were spent introducing the Data Factory, and then a series of 4 challenges were posed. The first challenge was to produce random numbers in the range 0 to 9 and clone the stream. The second challenge was a version of (a) above -- to produce a stream of random even numbers in the range 0 to 98. The third challenge was to create a stream of random multiples of 10 in the range 0 to 100. The fourth challenge was to create a factory that takes a stream of random numbers in the range 0 to 299, representing times given in numbers of minutes, and convert the stream into two new streams, giving the corresponding numbers of hours and remaining minutes. For example, an input of 75 would produce outputs 1 and 15. The student took 5 minutes to complete each of the first two challenges, including time for help with the tools. The third challenge took only 2 minutes, since its solution is so similar to that of the second challenge. The fourth challenge, on the other hand, required 20 minutes to complete, including time for help. This problem posed several conceptual difficulties, including the need to create a second copy of the input stream, the need to compute remainders, and the need to provide not only a stream of input data but two streams of the constant 60 for use in the separate quotient and mod devices. The final solution by the student for this challenge is shown in Figures 6a and 6b. In 6a, we see the first input data objects just before arrival at the
copying unit. The first number on the input conveyor is 214. In 6b, the factory has run a few seconds longer, and the first few results have reached the ends of the output conveyors. The first input has been converted into 3 hours and 34 minutes. Other solutions to the challenge might use fewer bends in the conveyors or only one constant generator rather than two. However, the user session was planned to have a 30-minute duration. The experience with this user suggest that the time to learn to begin working effectively with the Data Factory is very short – on the order of 5 to 10 minutes for the basics of number generators and conveyors and the use of the Add and Klone devices. The greater amount of time required by the fourth challenge can be explained in terms of the cognitive complexity of the task, and the need to confront several issues simultaneously. Thus the Data Factory seems to provide the elements of an effective environment for posing and solving problems that require design, planning, logical, and mathematical skills.
This student did not have prior programming experience but did have experience with construction games including The Incredible Machine, Roller Coaster Tycoon, and SimCity. This student found the drawing, selecting, and erasing actions easy to learn. The most confusing aspects of the construction process were joining conveyors to prevent data from falling off, and learning where the input and output ports on the devices are located. The second and third students had similar backgrounds and worked the same four challenges as the first. However, they used a later version of the program (having pastel-colored conveyors for greater data visibility, data on rather than above conveyors, and several additional drawing affordances, such as location previewing), and they were given only a two-minute introduction to the program. Their experiences were similar to that of the first student. Student number 2 (age 15) took 3’50” for the first challenge including the time for the introduction, 5’30” for the second challenge, 6’10” for the third challenge, and 6’40” for the fourth challenge. This student exhibited a definite style for connecting constants to multipliers and dividers, butting the devices up against each other. This can be seen in this student’s solution (see Figure 7). The third student (age 16) took more time in each of the challenges, exploring the functioning of several of the devices prior to solving the problem. His total time to complete all four challenges was 40 minutes.
6.3 Layout and Style Issues (a)
Figure 7. The second student’s solution to the hours and minutes challenge. Here the constant generators (60) abut the division and mod devices that they feed. (b) Figure 6. One student’s solution to the challenge of creating a factory that converts numbers of minutes into hours and minutes. In (a) the first data element is approaching the Klone device, while in (b) the outputs for the first input have arrived at the ends of the output conveyors.
Most visual languages pose layout challenges that are quite different from the formatting of textual programs. The two dimensions of a factory workspace offer great flexibility for arranging devices and conveyors, and they also can lead to layout difficulties. The Data Factory offers a few easy-to-use facilities for layout. One is the semiautomatic routing of conveyors. The operating
direction of each conveyor is inferred from the vector drawn by the user, and conversion from diagonal to ellshaped N, E, S, W constrained conveyors is performed by the system. If the user runs out of space in the factory, the current layout can be copied into a new, larger work area. Copy and paste operations can be used to move or duplicate sections of the factory already arranged. Ultimately, layout can be a challenge in the Data Factory just as it is when performing two-dimensional layout in other domains such as poster design, electric circuit board design, flowchart layout, etc. Skills and habits developed with the Data Factory such as general planning of the use of space, estimating sizes of subsystems, and identifying key flows could be reasonably expected to transfer in part to other layout tasks. Two distinct styles of layout are (a) clear layout, and (b) compact layout. Clear layout strives to keep independent conveyors from touching each other, minimize turns and crossovers, and keep most flow leftto-right. Compact layout may butt devices together, run parallel conveyors directly adjacent to one another, and make extra turns and crossovers to reduce the factory area required for the layout. Clear layout is preferable for experimental arrangements and presentation, while compact layout is appropriate for tried-and-true components that may be needed as building blocks for more experimental programs.
7. Discussion The Data Factory is a new programming system. It takes advantage of the power and graphics of current technology by animating its program executions by default. While any visual diagrams for information processing may be prone to misinterpretation [4], the Data Factory offers a transparency during execution that can help dispel misunderstandings about the operations of its devices. Unlike some visual programming environments for children it offers facilities for computing with numbers rather than microworld characters or robots. However, future versions may support more general types of data such as text, lists, sounds and images.
8. Acknowledgements The author would like to thank D. Lawton and R. Rice for suggestions, H. Chen and J. Kinkead for implementing parts of another prototype visual language called VIVA2, the reviewers for their comments, and the users for their time and interest. Partial support under NSF Grant EIA0121345 is gratefully acknowledged.
9. References [1] H. G. Baker, “Lively Linear Lisp–‘Look Ma, No Garbage!’”. http://home.pipeline.com/~hbaker1/Linear Lisp.html, 1991. [2] A. F. Blackwell and T. R. G. Green, “Does Metaphor Increase Visual Language Usability?”, Proc. 1999 IEEE Symposium on Visual Languages VL'99, pp. 246-253. [3] E. P. Glinert, “Nontextual programming environments”. In S-K. Chang, (Ed.), Principles of Visual Programming Systems. Prentice-Hall, pp. 144-232, 1990. [4]. T. R. G. Green and A. F. Blackwell. “Thinking about Visual Programs”. Presented at Thinking with Diagrams. Colloquium of IEE Computing and Control Division, Digest No 96/010, 5/1-5/4. [5] C. Hancock, “FLOGO: A Robotics Programming Language For Learners”. Proc. IEEE Symposia on Human Centric Computing Languages and Environments HCC’01. Stresa, Italy, 2001 [6] K. Kahn, “Seeing systolic computations in a video game world”. Proc. IEEE Symposium on Visual Languages VL’96. pp. 95-101. Darmstadt, Germany, 1996. [7] K. Kahn, “A Computer Game to Teach Programming.” Proc. of NECC’99. [8] J. F. Pane. “Human-Centered Design of a Programming System for Children”. Proc. IEEE Symposia on Human Centric Computing Languages and Environments HCC’01. Stresa, Italy, 2001. [9] A. Parks. “Review of the Incredible Machine”. At the TERC web site: http://www.terc.edu/mathequity/gw/html/TIMReview.html [10] Pictorius, Inc. Prograph CPX User Guide. Halifax, Nova Scotia, 1996. [11] A. Repenning. “AgentSheets: An Interactive Simulation Environment with End-User Programmable Agents”. Proc. of Interaction 2000, Tokyo, 2000. [12] J. E. Robbins, D. J. Morley, D. F. Redmiles, V. Filatov, and D. Kononov. “Visual Language Features Supporting Human-Human and Human-Computer Communication”. Proc. IEEE Symposium on Visual Languages VL’96. Darmstadt, Germany, 1996. [13] D. C. Smith, and A. Cypher, “Making Programming Easier for Children”. In A. Druin, ed. The Design of Children’s Technology, Morgan Kaufmann, San Francisco, 1999, pp. 201-222. [14] S. L. Tanimoto, “VIVA: A Visual Language for Image Processing,” J. Visual Languages and Computing, Vol. 1, No. 2, June 1990. [15] E. M. Wilcox, J. W. Atwood, M. M. Burnett, J. J. Cadiz, and C. R. Cook. “Does Continuous Visual Feedback Aid Debugging in Direct-Manipulation Programming Systems?” Proc. of CHI'97, Atlanta, GA,1977.