Keywords: Parkinson's disease; motor programming; force control; movement context ..... and whether the degree of correlation between the movement.
braini0109
Brain (1997), 120, 91–102
Programming of a movement sequence in Parkinson’s disease P. Weiss,1,2 G. E. Stelmach1 and H. Hefter2 1Motor
Control Laboratory, Arizona State University, Tempe, USA and 2Department of Neurology, Heinrich Heine University, Du¨sseldorf, Germany
Correspondence to: Peter Weiss, Department of Neurology, Heinrich Heine University, Moorenstrasse 5, D–40225 Du¨sseldorf, Germany
Summary The execution of multiple-component movements has been shown to be impaired in Parkinson’s disease patients. To determine whether this deficit is attributed to faulty motor programming, a two-segment movement was examined by studying the kinematics of the first segment when the second segment contained variable accuracy requirements. The performance of 15 Parkinson’s disease patients was compared with an age-matched control group. Movement precision not only affected the kinematics of the final segment but also the kinematics of the first segment. This ‘context effect’ was observed in both groups. Since Parkinson’s disease patients revealed similar movement patterns to those of controls, their motor programming appears to be intact. Furthermore,
correlation analysis for the segment movement-times revealed subjects with high as well as low correlation indices in both groups. The correlation indices were related to the context effect only in the Parkinson’s disease patients. Independent of these phenomenon, Parkinson’s disease patients showed marked hesitations between the movement segments compared with controls, suggesting that they have difficulty in implementing and/or in switching between motor program steps. Impaired force control and a reduced capacity to terminate movements in Parkinson’s disease are discussed as possible explanations of the deficit in motor program implementation.
Keywords: Parkinson’s disease; motor programming; force control; movement context Abbreviations: DT 5 deceleration time; DMT 5 mean of the differences between MT in the conditions ‘small’ and ‘large’ for each corresponding trial; DPVA1/2 5 mean of the differences between the peak velocity in the first/second segment in the conditions ‘small’ and ‘large’ for each corresponding trial; DTS1/2 5 mean of the differences between TS1/2 in the conditions ‘small’ and ‘large’ for each corresponding trial; ID 5 index of difficulty; MT 5 total movement time; P 5 pause duration; PV 5 peak velocity amplitude; RT 5 reaction time; TPA 5 time to peak acceleration; TPD 5 time to peak deceleration; TPV 5 time to peak velocity; TS1/2 5 time for the first/ second sequence segment
Introduction Although bradykinesia is one of the main features in Parkinson’s disease, the underlying cause is poorly understood (Hallett and Khoshbin, 1980; Marsden and Obeso, 1994). Peripheral as well as central mechanisms are thought to contribute to the bradykinesia in Parkinson’s disease (Berardelli et al., 1986b; Stelmach et al., 1986; Jahanshahi et al., 1992). Clinical and experimental data suggest that slowness in Parkinson’s disease becomes even more pronounced when simultaneous or sequential movements are performed (Benecke et al., 1986, 1987; Agostino et al., 1992; Castiello et al., 1993a). In sequential tasks, for example, patients often produce prolonged movement durations for the components of a sequence, compared with separately executed components. In addition, hesitations between move© Oxford University Press 1997
ment segments are commonly reported in these patients (Berardelli et al., 1986a; Agostino et al., 1992; Bennett et al., 1995). Deficient programming of a sequence should prolong initiation as well as execution of movement segments. Support for a programming deficit in Parkinson’s disease is rather mixed (Bloxham et al., 1984; Stelmach et al., 1986; Benecke et al., 1987; Jahanshahi et al., 1992). For example, one index of programming integrity is the ‘length effect’; reaction time (RT) increases with the length of a sequence. Rafal et al. (1987) showed a normal length effect in Parkinson’s disease patients, suggesting that their programming processes are preserved. Harrington and Haaland (1991), in contrast, did not observe a normal length effect in Parkinson’s disease
92
P. Weiss et al.
patients. They reported pauses between the movement segments in Parkinson’s disease and interpreted these findings as evidence of faulty programming. Their interpretation is based on the assumption that Parkinson’s disease patients start the execution of the first segment before completing all programming processes; consequently, they are hesitating between the segments to complete the programming. Harrington and Haaland (1991) suggested that the generation of the motor plan, rather than its implementation is disturbed in Parkinson’s disease patients. The goal of this study was to examine the motorprogramming abilities of Parkinson’s disease patients during execution of a two-segment movement. For this purpose, our experiment was modelled after Marteniuk et al. (1987). These authors demonstrated that, for normal subjects, the kinematics associated with grasping an object were influenced by the functional requirements of either throwing the object or fitting the object into a preformed hole. These findings clearly established that in normal subjects motor programming of earlier movement segments take into account the accuracy requirements of subsequent movement segments. This experiment manipulates movement difficulty in the second segment of a two-segment movement to examine motor programming in normal and Parkinson’s disease subjects. At issue is whether the kinematics of the first segment are influenced by the difficulty of the second. Based on previous research, the index of difficulty of the second segment is predicted to influence the execution of the first segment. These findings are summarized under the description ‘context effect’ in Marteniuk et al. (1987). The experimental design employed permits a distinction between two possible problems in Parkinson’s disease. First, if a programming deficit is contributing to the disturbed sequential performance in Parkinson’s disease, the movement kinematics of the patients would be less sensitive to the accuracy demands in the second segment. Secondly, if motor-programming processes for the sequence are not impaired and the first segment is influenced by the accuracy requirements in the second segment, but there are hesitations in the intersegment-phase, a problem in implementing the motor programme is suggested. These hesitations should escalate as the accuracy requirements of the second segment increase.
Methods Subjects Fifteen parkinsonian (aged 59613 years; 9 female and 6 male) and 15 control subjects (aged 5767 years; 5 female and 10 male) took part in the study. The age difference was not significant (P 5 0.47, independent t test). The patients suffered from Parkinson’s disease in the stages II, III or IV (Hoehn and Yahr, 1967) (Table 1) and were tested 1 h after medication intake. The control subjects were free from neurological disorders. All subjects were right handed. Informed consent was given by all subjects and the University
Hospital of The Heinrich-Heine University ethical committee had approved the experimental design of the study.
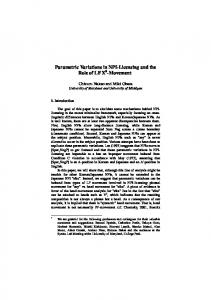
Apparatus and procedure The subjects were seated comfortably in a chair in front of a GTCO Digi-Pad digitizing board (100 Hz sampling frequency, 0.1 mm spatial accuracy). After an imperative auditory stimulus of 50 ms duration, arm drawing movements were executed as quickly as possible, without hesitations, from a starting point to a defined target location on the digitizer tablet using the stylus of the digitizer (Fig. 1). The relative importance of movement speed and smoothness over execution accuracy was repeatedly stressed during the experimental session. The target locations were organized so that subjects had full vision of the trace of the stylus during the entire movement. After reaching the final target, the subject waited until the end of the sampling period (2 s) before moving the stylus back to the starting position. Then, the next imperative auditory stimulus was given. The three different conditions used were as follows (see Fig. 1): (i) condition ‘simple’—drawing a 10 cm horizontal line from the starting point into a 232 cm2 square from right to left toward the body’s midline; (ii) condition ‘large’— drawing a 10 cm line as in the ‘simple’ condition and proceeding with a movement reversal away from the body midline to a second 232 cm2 square 10 cm from the first target [index of difficulty (ID) for the second segment: 3.32 (ID 5 log2 (2A/W), where A 5 movement amplitude and W 5 target width; Fitts, 1954)]; and (iii) condition ‘small’— same as condition ‘large’ except that the second square was 0.730.7 cm2 (ID for second segment 5 4.84). Two blocks of 25 trials per condition were presented in a semi-randomized order. The x- and y-position coordinates of the 50 trials in each condition were digitized for further off-line analysis. The duration of the experimental session was ~1 h.
Data processing and analysis Movement kinematics were analysed by using a software package supported by a 386 IBM-compatible personal computer. After filtering the sampled position data with a 10 Hz dual pass, second-order Butterworth filter, the first (velocity) and second (acceleration) derivatives of both position coordinates were calculated. Afterwards the tangential velocity and tangential acceleration were computed by determining the length of the velocity and acceleration vector, this resulted in only positive values, independent of direction. Analysis procedures determined the time and amplitude of the peak velocities, peak accelerations, and peak decelerations in both movement segments, as well as the lowest velocity value at the reversal point between the segments. Furthermore, an automated baseline-break detection algorithm was used to find the onset and the completion of each movement component. The algorithm used a relative threshold (10% of the peak velocity amplitude)
Sequencing in Parkinson’s disease
93
Table 1 Clinical data of the 15 Parkinson’s disease patients Patient
Sex
Age (years)
Disease stage*
Duration (years)
Medication
1 2 3 4 5 6 7 8 9 10 11 12 13 14 15
M F F F M F M F M M F M F F F
47 28 65 71 72 67 78 64 63 56 53 49 77 54 52
II II IV III III II IV III III III II II II III II
7 3 10 2 4 2 3 6 4 8 8 4 3 4 2
L-Dopa, L-Dopa, L-Dopa, L-Dopa, L-Dopa, L-Dopa, L-Dopa,
selegiline carbidopa, bromocriptine carbidopa, bromocriptine carbidopa, selegiline, lisurid selegiline propranolol carbidopa, selegiline Carbidopa, selegiline, biperiden Carbidopa, selegiline, lisurid L-Dopa, selegiline, lisurid, bornaprin L-Dopa, carbidopa L-Dopa, selegiline, trihexyphenidyl Carbidopa, lisurid L-Dopa, biperiden L-Dopa, selegiline, lisurid, biperiden
F 5 female; M 5 male. *The Hoehn and Yahr scale (1967).
Fig. 1 A drawing of the experimental set-up shows the position of the subject in relation to the template and the digitizing tablet. The templates for the three conditions (‘simple’, ‘large’ and ‘small’) display the target boxes and the movement direction.
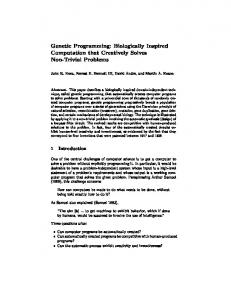
to determine the baseline break. This is a conservative criterion, since it underestimates movement duration, especially for trials with low velocity as occurred in the Parkinson’s disease patients (complete algorithm in Castiello et al., 1993b). The landmarks determined by the analysis software were verified by the experimenter with the help of interactive computer graphics. Using these kinematic landmarks, the following dependent parameters were computed: movement time (MT), time for the first segment (TS1), time for the second segment (TS2), pause duration (P), time to peak velocity (TPV), deceleration time (DT), time to peak acceleration (TPA) and time to peak deceleration (TPD), which are explained in the legend of Fig. 2. A hesitation was defined as a pause lasting .20 ms. Trials in which the turning point (only in conditions ‘large’
and ‘small’) and/ or the end-point of the movement did not pass through or end in the defined target areas were discarded at the time of the experiment. Statistical analysis of the occurrence of erroneous trials across conditions (ANOVA) did not yield any significant difference between controls and Parkinson’s disease patients [F(1,56) 5 0.73, P 5 0.396]. For both groups more trials had to be discarded in the condition ‘small’ (22.7% for the controls and 24.3% for the Parkinson’s disease subjects) as compared with the two other conditions [in condition ‘simple’ 6.5% and 4.3% and in condition ‘large’: 9.7% and 7.5% for controls and Parkinson’s disease patients, respectively; F(1,56) 5 8.75, P , 0.01]. Only accurate, valid trials were recorded and stored for the analysis. After the experiment, trials with reaction times ,100 ms (anticipation error) or .1 s (slow response) were excluded. The analysis is based on at least 127 trials per subject. In the majority of cases (88.9%) the valid data set consisted of .140 valid trials from the original 150. A mixed between- and within-subject design was used, with group as a between-subject factor and condition and block as within-subject factors. A priori orthogonal contrasts were used to determine the interaction effects between the factors.
Results An analysis at the group level was undertaken describing the kinematics of the movements. Kinematic changes in the second segment revealed the influence of changing target size, while kinematic changes in the first segment (due to modified accuracy requirements in the second segment) revealed the influence of the movement context. Subsequently, an analysis at the subject level tested whether the movement times of the first and second segments were correlated, whether the movement context (accuracy requirements) influenced the kinematics of the first segment significantly
94
P. Weiss et al. disease patients as compared with 204 ms in the controls). For controls, the entire movement time (MT) in the two complex conditions differed significantly with a longer MT in the more difficult condition ‘small’ in comparison with the condition ‘large’ (Table 2A). While for the patient group, a substantial lengthening of the MT was observed in the condition ‘small’ compared with the condition ‘large’; this difference in MT between the two complex conditions (184 ms) just failed to reach significance [F(1,14) 5 3.13, P 5 0.08]. Between-group comparisons showed that the movement times were longer in the Parkinson’s disease patients; the 30% increase in the MT in the patient group clearly showed the extent of their bradykinesia [F(1,28) 5 20.72, P , 0.001].
Kinematics of the second segment
Fig. 2 Example of velocity (A) and acceleration (B) curves from one trial within the condition ‘large’ with Patient 13. The rectangles indicate the duration of the temporal movement parameter. The definitions and abbreviations used for the kinematic landmarks are: Movement time (MT): the time from the onset until the completion of the movement; time for the first segment (TS1): movement time for the first part of the sequence; time for the second segment (TS2): movement time for the second part of the sequence; pause duration (P): time spent between the completion of the first and the onset of the second movement components (If the pause duration was .20 ms, it was a called hesitation.); time to peak velocity (TPV): time from onset of a movement component to the corresponding peak velocity; deceleration time (DT): time from the peak velocity until the completion of the movement component; time to peak acceleration (TPA): time from the onset of a movement component to the corresponding peak acceleration; time to peak deceleration (TPD): time from the onset of a movement part to the corresponding peak deceleration
and whether the degree of correlation between the movement times of the first and second segments were influenced by the movement context, the target size, and/or hesitations.
Analysis at the group level Reaction time and movement time For the control group and the Parkinson’s disease patients, the reaction time did not differ significantly between the three conditions (Table 2A). However, there was a significant main effect of condition [F(1,56) 5 7.88, P , 0.01]. The mean RT for both conditions ‘large’ (230 ms) and ‘small’ (230 ms) were significantly larger than the mean RT for condition ‘simple’ (219 ms). The RT was not significantly different between the groups (248 ms in the Parkinson’s
In the conditions ‘large’ and ‘small’, target size was changed for the second segment while the distance moved was kept constant, resulting in IDs being greater in the condition ‘small’. Since the error distribution was comparable in both groups, a prolongation of the movement time and a decrease in velocity amplitude in the second segment (Table 2B) were expected for both groups in the condition ‘small’. For the control group, Table 2B summarizes the significant changes in the second movement segment under the two complex conditions ‘small’ and ‘large’. The significant prolongation of movement time observed in the second segment (TS2) in the condition ‘small’ [F(1,14) 5 6.59, P , 0.05] was due to a significant prolongation of the time to peak velocity (TPV2). In addition, the controls took slightly longer to reach peak acceleration (13 ms) and peak deceleration (48 ms) in the condition ‘small’. As summarized in Table 2B, the peak velocity was significantly smaller in the condition ‘small’ [F(1,14) 5 5.22, P , 0.05]. The decrease in peak acceleration as well as in peak deceleration just failed significance (P 5 0.07). Thus, in the control subjects, movement time, amplitude of peak velocity and peak acceleration in the second movement segment varied in relation to target size. For the Parkinson’s disease patients, a prolongation of movement time and a decrease in peak amplitude in the second segment was observed (Table 2B). The large difference in TS2 (130 ms) between condition ‘large’ and ‘small’ was due to a 95 ms prolongation of DT2 in the condition ‘small’ and a smaller increase of the TPV2 (35 ms). The higher accuracy demands in the second segment suppressed peak velocity [F(1,14) 5 5.45, P , 0.05], peak acceleration and peak deceleration. Between-group comparisons revealed that movement kinematics of both groups varied with target size, but Parkinson’s disease patients executed their movements significantly slower than controls, as indicated by significant group differences for TS2, TPV2 and DT2 (Table 2B). The increase of TS2 was more pronounced for the Parkinson’s disease patients than for controls due to the substantial
Sequencing in Parkinson’s disease
95
Table 2A Parameters of the first sequence segment Parameter
Controls
Parkinson’s disease patients
Condition ‘simple’ Reaction time (RT) (ms) 197620 Total movement time (MT) (ms) 302621 Duration of first segment (TS1) (ms) 302621 Segment as percentage of MT (%) 100 Time to peak velocity (TPV1) (ms) 147611 Deceleration time (DT1) (ms) 156611 DT as percentage of TS1 (%) 51.661.3 Time to peak acceleration (TPA1) (ms) 7267 Time to peak deceleration (TPD1) (ms) 221616 Peak velocity (PV1) (mm/s) 694654 Peak acceleration (mm/s2) 941661493 Peak deceleration (mm/s2) 887861260
Condition ‘large’
Condition ‘small’
Condition ‘simple’:
Condition ‘large’
Condition ‘small’
208623 681640* 352622 51.761.2 190615 162610 46.561.7 9269 280621 574640 63386876 65306843
207623 784640 372620** 47.661.2 200614* 17169* 46.661.7 95610 297619* 474629** 49226625** 50236501**
241618 552656 552656 100 265627 288637 51.362 156620 369636 421637 47256522 43346574
251619 1036681 492641 47.861.5 260624 232620 47.361.5 148619 366631 434634 45196515 43426507
252617 1220697 527640* 44.161.8 276626* 251618* 48.261.6 155618 392633* 365629* 37626461* 34606388*
Means6SEMs are shown. *P , 0.05, **P , 0.01 (comparing conditions ‘large’ and ‘small’).
Table 2B Parameters of the second sequence segment Parameter
Duration of second segment (TS2) (ms) Segment as percentage of MT (%) Time to peak velocity (TPV2) (ms) Deceleration time (DT2) (ms) DT as percentage of TS2 (%) Time to peak acceleration (TPA2) (ms) Time to peak deceleration (TPD2) (ms) Peak velocity (PV2) (mm/s) Peak acceleration (mm/s2) Peak deceleration (mm/s2) Pause duration (P) (ms) Reversal velocity (mm/s)
Controls
Parkinson’s disease patients
Condition ‘simple’
Condition ‘large’
Condition ‘small’
Condition ‘simple’
313621 45.861.4 151612 162612 51.961.8 6167 237619 667657 867561275 837861188 72612 76618
387626* 49.161.4 181613* 206617 52.762.0 7468 285621* 530641* 58046713* 57686744* 82613 51613
506641 49.061.4 237621 269630 52.262.4 111616 350628 428635 43526519 46656591 97618 2166
636657* 51.861.5 271622* 364648 55.062.7 126616 419634* 344629* 32046360* 35036455* 125619 1364
Means6SEMs are shown. *P , 0.05, **P , 0.01 (comparing conditions ‘large’ and ‘small’).
prolongation of DT2, but condition interactions for these parameters just failed to reach significance. However, the patients modulated their velocity and acceleration less than controls. The groups differed significantly [F(1,28) 5 4.45, P , 0.05] between conditions ‘large’ and ‘small’ for the amplitudes of peak velocity, peak acceleration and peak deceleration. In summary, the patients modified their movements similarly to the control subjects, but differences between conditions were less pronounced.
Kinematics of the first segment To assess the motor-programming capabilities of the two subject groups, the kinematics of the first segment were examined as a function of difficulty in the second segment. If the two segments are programmed together, the accuracy demands in the second segment should influence the execution characteristics of the first. This ‘context effect’ was qualitatively described by Marteniuk et al. (1987).
In general, the control subjects made slower movements in the first segment when the second segment was more difficult (Table 2A). There was a significant effect of the conditions ‘large’ and ‘small’ on movement time in the first segment (TS1) [F(1,14) 5 12.64, P , 0.01]. The time to peak velocity (TPV1), the deceleration time (DT1), as well as the time to peak deceleration (TPD1) increased significantly in the condition ‘small’. In addition, the amplitude of peak velocity, peak acceleration and peak deceleration decreased significantly in the condition ‘small’. In summary, several changes in the kinematics of the first segment were found in the controls, in parallel with the increased accuracy demands in the second segment, suggesting that movement context affected their performance. For Parkinson’s disease patients, increased accuracy demands for the second segment also influenced the kinematics of the first segment. The temporal changes consisted of a substantial prolongation of TS1 due to an increase in TPV1 and DT1, while the times to peak
96
P. Weiss et al. 2A). The patients also failed to exhibit faster speed in the condition ‘simple’. They executed the first segment with a higher peak velocity in the condition ‘large’ than in the condition ‘simple’ (Fig. 3B). The same was observed for the peak deceleration amplitude, while the peak acceleration amplitude decreased with the difficulty of the conditions.
Kinematics between the segments
Fig. 3 Comparing elderly controls (circles) and Parkinson’s disease patients (squares): Changes of (A) time for the first movement segment (TS1) in ms and (B) amplitude of first peak velocity (PV 1) in mm/s in all three conditions (‘simple’, ‘large’, and ‘small’). The means6SEM are displayed.
deceleration and peak acceleration increased to a lesser extent. Peak velocity, peak acceleration and peak deceleration all decreased (see Table 2A for details). When the two groups were compared, there were no significant group3condition interactions for any of the temporal parameters indicating that the temporal modifications in the patient group were similar to those of the controls. This suggests that Parkinson’s disease patients not only anticipate the forthcoming increase in difficulty, but also exhibit a temporal structure similar to that of the controls. Note, that this was not the case for the second part of the movement (see changes in e.g. TS2, DT2 and PV2).
Kinematics of conditions ‘simple’ versus ‘large’ and ‘small’ For the control group, Fig. 3A shows that the time for the first segment (TS1) increased as the task became more difficult. The TPV1 and DT1 showed a similar pattern (Table 2A). The amplitude of the first peak velocity decreased with increased task complexity (Fig. 3B). In addition, there was a reduction of the first peak acceleration and deceleration and of the reversal velocity in parallel with the increasing complexity (Table 2A and B). The Parkinson’s disease patients showed a different movement pattern. For them, the TS1 in the condition ‘simple’ was longer than in both complex tasks, with a substantial prolongation of DT1 in the condition ‘simple’ in contrast to the more complex conditions (Fig. 3A and Table
Although the patients exhibited contextual influences similar to those of the controls, their behaviour at the reversal point between the movement segments revealed a special execution problem. As was observed for the peak amplitudes in the second segment, less modulation was observed for the reversal velocity in the Parkinson’s disease patient group than in the controls (Table 2B); this resulted in a significant group3condition interaction [F(1,56) 5 4.45, P , 0.05]. In comparison with the controls, who showed hesitations between the movement segments in 24% of the trials, Parkinson’s disease subjects stopped more often in both sequential conditions (hesitations in 42% of the trials; P , 0.05, independent t test). In addition, the average hesitation duration was longer in the Parkinson’s disease patient group compared with controls, also the increase of duration from condition ‘large’ to condition ‘small’ was more prominent in the Parkinson’s disease group. Subjects who hesitated in the condition ‘large’ also tended to hesitate in the condition ‘small’ (the Pearson correlation coefficients between the number of hesitations in the conditions ‘large’ and ‘small’ for the six controls and the 12 Parkinson’s disease patients, who showed a significant number of hesitations, were r 5 0.76 with P 5 0.08 and r 5 0.71 with P , 0.01, respectively). To rule out the possibility that the occurrence of hesitations was a direct consequence of bradykinesia in the patients, the correlation between hesitation duration and the following peak velocity amplitude was calculated and found to be non-significant (r 5 –0.06, P 5 0.12). In addition, Spearman rank correlation analysis revealed that the hesitations were not related to age (r 5 0.28, P 5 0.375) or the stage (r 5 –0.16, P 5 0.63) or duration of the disease (r 5 0.65, P 5 0.84).
Analysis at the subject level Correlation between the first and second movement times As reported in the above section, different behaviours across subjects were observed, e.g. some showed many and others showed few or no hesitations between segments. To take into account these different behaviours, additional analyses were performed at the subject level. For this purpose, the Pearson correlation between the movement durations of the first and second segments was calculated for all trials within a subject (see Table 3). High correlation values would indicate that the subjects executed the two movement segments with a
Sequencing in Parkinson’s disease
97
Table 3 Segment movement time correlations and differences between conditions in individual patients Controls Subject no.
Parkinson’s disease patients Correlation (TS13TS2)
DTS1 (ms)
DPV1 (ms)
DMT (ms)
Patient no.
for ‘large’ for ‘small’ 9 1 13 2 3 10 6 11 15 7 14 5 4 8 12
0.92*** 0.84*** 0.68*** 0.48*** 0.62*** 0.27 0.54*** 0.49*** 0.52*** 0.38** 0.49*** 0.39** 0.45** 0.11 0.44** 0.23 0.33* 0.19 0.23 0.30* 0.11 0.04 0.11 0.19 0.04 0.00 20.01 0.204 20.00 20.068
Correlation (TS13TS2)
DTS1 (ms)
DPV1 (mm/s)
DMT (ms)
42*** 21 11 7 35** 97*** 112*** 241*** 65*** 95*** 221 98*** 1 225 6
111.1*** 475*** 70.2*** 337*** 120.2*** 255*** 38.0** 32** 76.0*** 340*** 136.4*** 185*** 84.5*** 182*** 11.4 49 122.7*** 125*** 6.4 32 18.0** 238 78.2*** 17 39.2*** 157*** 57.2*** 178*** 27.6** 360***
for ‘large’ for ‘small’ 43** 44*** 51*** 36*** 23 29 9 225* 50*** 33*** 13 0 4 1 49***
98.4*** 187.0*** 246.5*** 150.6*** 45.7* 23.5* 75.1*** 10.8 103.7*** 113.8*** 113.8*** 74.3*** 91.0*** 64.4*** 84.9***
172*** 186*** 133*** 103*** 94*** 76*** 83*** 65** 178*** 76*** 68*** 103*** 43*** 46*** 107***
7 5 3 1 10 15 2 14 9 8 11 6 13 12 4
0.82*** 0.68*** 0.64*** 0.61*** 0.58*** 0.56*** 0.54*** 0.50** 0.29* 0.27* 0.22 0.22 0.12 0.09 0.02
0.28* 0.60*** 0.71*** 0.19 0.73*** 0.41** 0.50*** 0.33 0.56*** 0.18 0.07 0.08 0.20 0.08 0.20
The first two columns for each group show the Pearson correlation coefficients between the first and second segment movement times (TS1 3 TS2) in the conditions ‘large’ and ‘small’. The following columns show means of differences, comparing the conditions ‘small’ and ‘large’: DTS1 5 difference in TS1 (time of first segment); DPV1 5 difference in PV1 (first peak velocity); DMT 5 difference in MT (total movement time). *P , 0.05; **P , 0.01; ***P , 0.001.
similar time structure, while low correlation values would indicate that the subjects executed both segments separately. Both execution patterns were observed in both groups of subjects (see Table 3). Therefore, the five subjects in each group who exhibited the five highest and significant Pearson correlation coefficients in the condition ‘large’ (r ù 0.52 for controls and r ù 0.56 for Parkinson’s disease patients, P , 0.01) were selected as special subgroups showing correlated segment movement-times. Consequently, the five subjects in each group who exhibited the five lowest and non-significant Pearson correlation coefficients (r ø 0.12 for controls and r ø 0.22 for Parkinson’s disease patients, P ù 0.16) were also selected for the special subgroups with low correlations between segment movement-times (see also Fig. 4 for position and velocity data for a subject from each subgroup). No separate analyses were run for the five subjects fitting in neither of these special subgroups. For the control subjects, Table 3 displays the Pearson correlation coefficients of the segment movement times ordered according to the correlation coefficient for the condition ‘large’. To demonstrate that the control subjects showed a consistent behaviour in both conditions, the Pearson correlation between the segment movement time correlation coefficients of all 15 subjects in the conditions ‘large’ and ‘small’ was calculated and found to be highly significant (r 5 0.84, P , 0.001). Then the movement kinematic differences between those subjects with low and those with high segment movement time correlation were analysed. The only trend noted was that controls with a high segment movement time correlation revealed a longer RT (237 ms) than those controls with a low correlation (174 ms).
For the Parkinson’s disease patients, the Pearson correlation between correlation coefficients in the condition ‘large’ and ‘small’ was also significant (r 5 0.6, P , 0.05). In those Parkinson’s disease patients with a higher correlation between the segment movement-times, movement parameters revealed higher and more strongly modulated reversal velocities (33 mm/s and 16 mm/s for the conditions ‘large’ and ‘small’, respectively), in contrast to those Parkinson’s disease patients with a low segment movement-time correlation (8 mm/s for both conditions). Furthermore, in the Parkinson’s disease patients with a high correlation between the segment movement-times, the increase in TS2 (161 ms) and DT2 (118 ms) in the condition ‘small’ compared with the condition ‘large’ was larger than that in the Parkinson’s disease patients with a low correlation between segment movement-times (103 ms and 84 ms for TS2 and DT2, respectively). These effects were also reflected in the total movement-duration parameter, which was less modulated and longer in the Parkinson’s disease patients with a low segment time correlation. Interestingly, there was a positive correlation between the disease stage as determined by the Hoehn and Yahr scale and the segment movement-time correlation coefficients (Spearman’s rank correlation: r 5 0.467, P 5 0.079 and r 5 0.526, P , 0.05 for conditions ‘large’ and ‘small’, respectively). Comparisons between the groups revealed that the Parkinson’s disease patients hesitated more often between the segments than controls (see ‘Analysis at the group level’, above), but the number of hesitations did not correlate with the degree of correlation between the movement segment times (see Table 4), indicating that these phenomena appear
98
P. Weiss et al.
Fig. 4 Position and velocity data from two control subjects (A and C) and two Parkinson’s disease patients (B, D) who produced movement segments that were highly correlated (A and B) or that were not correlated (C and D). The top graphs represent the trials for condition ‘large’ and the bottom graphs for the condition ‘small’. These graphs show a prolongation of the deceleration time in the Parkinson’s disease Patient 10 (B) and hesitations in the Parkinson’s disease Patient 12 (D). Please note the different time scale for the velocity graphs of the Parkinson’s disease patients (B and D).
Table 4 Pearson-correlation coefficients (r) and P-values relating the TS13TS2 correlations with DTS1, DPV1, DMT and hesitations Subjects and condition
DTS1
Controls and condition: ‘large’ r 5 0.26, ‘small’ r 5 0.20, Parkinson’s disease and condition: ‘large’ r 5 0.68, ‘small’ r 5 0.80,
DPV1
DMT
Hesitations
P 5 0.36 P 5 0.47
r 5 20.29, P 5 0.29 r 5 20.16, P 5 0.58
r 5 0.62, P , 0.05* r 5 0.53, P , 0.05*
r 5 0.35, P 5 0.45 r 5 0.19, P 5 0.65
P , 0.01* P , 0.001*
r 5 20.47, P 5 0.08 r 5 20.57, P , 0.05*
r 5 0.39, P 5 0.16 r 5 0.48, P 5 0.07
r 5 20.35, P 5 0.27 r 5 20.27, P 5 0.40
See Table 3 for the TS1 3 TS2 correlations for the individual subjects. *Significant relationship.
to be unrelated (see also Fig. 4). When comparing the control and Parkinson’s disease subgroups with high or low segment movement-time correlations, both Parkinson’s disease subgroups executed their movements significantly slower than controls. There was a significant prolongation of MT, TS1 and TS2, as well as a reduction of PV1 and PV2
(all P , 0.01) in both Parkinson’s disease subgroups. Moreover, there was a significant context effect (kinematic changes between the conditions ‘large’ and ‘small’ in the first segment) in all four subgroups. However, in the Parkinson’s disease patients with higher segment movementtime correlation, significant subgroup3condition interactions
Sequencing in Parkinson’s disease for TS2 and DT2 revealed more severe difficulties at the end of the sequence.
Relationship between context effect and movement time correlation To compare individual movement time correlation (see Table 3) with the ‘context effect’, the latter has to be described at the subject level as well. For this purpose, the difference between the first segment movement-time (TS1) in the nth trial in the condition ‘small’ and the nth trial in the condition ‘large’ was calculated with n in the range 1–50. Then, the mean of these 50 values was calculated for each subject (DTS1), leading to an estimate of the individual kinematic changes in the first segment due to the modified accuracy requirements in the second segment. The same procedure was used to calculate the mean difference of the first peak velocity amplitude between the conditions ‘large’ and ‘small’ for each subject (DPV1). Similarly, the mean difference of the total movement time (DMT) between the conditions ‘large’ and ‘small’ in each subject was calculated as a parameter of changes (especially in the second movement segment) due to target size changes. In all control subjects at least one of the two parameters, DTS1 and DPV1, was significantly changed when the difference between condition ‘large’ and ‘small’ was tested by a dependent t test (P , 0.01), with more pronounced changes for DPV1. There was no correlation between the individual ‘context effect’ parameters (DTS1 and DPV1) and the individual segment movement time correlation coefficients for the conditions ‘large’ and ‘small’ (see Table 4). However, a significant correlation between DMT and the segment movement-time correlation coefficients for the condition ‘large’ (r 5 0.62, P , 0.05) and ‘small’ (r 5 0.53, P , 0.05) was found. Therefore, the higher the correlation between the segment movement times the more pronounced was the effect of the target size on total movement duration. In the Parkinson’s disease patients, the ‘context effect’ between the conditions ‘large’ and ‘small’ was observed at the subject level as well (also more pronounced for DPV1) with the exception of Patients 8 and 14. In contrast to the controls, the Parkinson’s disease patients showed a significant correlation between the ‘context effect’ parameters (DTS1 and DPV1) and the segment movement-time correlation coefficients (see Table 4). The correlation was more pronounced for DTS1 than for DPV1 with the condition ‘small’ having more impact than condition ‘large’. However, calculating the Pearson correlation between the segment movement-time correlation coefficients for the conditions ‘large’ and ‘small’ and the parameter DMT (indicating the influence of target size) only revealed a trend in the condition ‘small’ (r 5 0.475, P 5 0.073).
Discussion The goal of our study was to examine deficits in the programming of sequential motor tasks in Parkinson’s disease
99
by kinematic analysis of arm movement trajectories recorded on a digitizer tablet. In agreement with previous studies (Evarts et al., 1981; Stelmach et al., 1986), overall MTs were more prolonged than RTs in the Parkinson’s disease patients. In addition, both groups showed a trend towards a RT ‘length effect’ (Rafal et al., 1987; Stelmach et al., 1987). Probably because only two movement segments were used, differences in RT for the different conditions were not substantial in either group. The patients’ bradykinetic behaviour was shown by their prolonged movement time, reduced peak velocities, and peak acceleration amplitudes for all movement components, and by the reduced speed in the movement reversal. To analyse the programming capability of the Parkinson’s disease patients, the encoding of the movement context (Jeannerod, 1995) was examined in the two movement segments. Analyses at the group and subject levels revealed that Parkinson’s disease patients as well as controls anticipated the increased difficulty in the second segment by altering the kinematics of the first segment. In both groups, the movement time of the first segment was prolonged in the more difficult condition ‘small’ compared with the condition ‘large’, due to a lengthening of time to peak velocity and peak deceleration. The amplitudes of peak velocity, peak acceleration and peak deceleration were reduced under increased accuracy requirements in both groups. Since the first segment was identical in all three conditions, the adjusted kinematics can be interpreted as correct encoding of the movement context in both groups indicating preserved motor programming in the Parkinson’s disease patients. To our knowledge, this is the first study which quantitatively measured the influence of the movement context on motor execution for control and Parkinson’s disease subjects with the help of kinematic analysis. A correlation analysis of the segment movement times at the subject level revealed different behavioural patterns across the control group as well as the Parkinson’s disease patient group; there was an equal number of subjects in each group who either showed a high or low correlation between segment movement times of the first and second segment. Some patients executed the segmented movement in a segment-by-segment fashion with a low correlation between movement segments and with lower velocities, presumably allowing more time for the control of their motor impairments, while others executed the segmented movement with a high correlation between movement segments and with higher velocities leading to an accumulation of problems in the termination phase of the movement. Note that in almost all Parkinson’s disease patients (and all control subjects) the kinematic changes indicated preserved programming capabilities in terms of the ‘context effect’ irrespective of whether they showed high or low segment movement-time correlations. However, the ‘context effect’ changes were more pronounced in the Parkinson’s disease and control subgroups who showed highly correlated segment movement times within each trial. The capability of implementing the motor programme
100
P. Weiss et al.
was evaluated by analysing within each trial the kinematic differences for the transition phase between the segments and at the end of the sequence. Parkinson’s disease patients modulated their reversal velocities less and showed longer and more frequent hesitations between the segments than controls. Since the ‘context effect’ demonstrated the integrity of motor programming of the two-segment sequence in the Parkinson’s disease patients, these hesitations may reflect a disturbance in executing the motor programme step by step. In addition, the lack of a relation between the number of hesitations and the segment movement-time correlations (Table 4) indicate that execution of the segmented movement can be interrupted without influencing the higher organization of the movement. Therefore, the use of extensive kinematic and correlation analysis allows to explore the organization of movement in its context and, thereby, helps to disentangle the various motor impairments in Parkinson’s disease patients, which are often not properly separated in the literature. Our findings are in agreement with those of Benecke et al. (1987), who also observed that ‘the overall timing mechanism was intact in patients with Parkinson’s disease’. Their patients also showed problems in implementing the programme, as indicated by a lengthening of pauses and intersegment latencies. Such implementation problems could also be responsible for the observed hesitations between movement segments (Agostino et al., 1992). The examination of finger tapping sequences, with and without an additional force component, in Parkinson’s disease patients and controls by Stelmach et al. (1989) supports this notion. When Parkinson’s disease patients were required to apply a stronger force on only one of the finger taps, i.e. to implement an additional component into the motor programme for the tapping sequence, they showed hesitations by breaking the tapping sequence into two distinct parts, before and after the special tap. In a recent study, Bennett et al. (1995) reported hesitations in a drinking action of Parkinson’s disease patients. They also found no correlation between the hesitations and other parameters, such as stage of disease, age, or speed of movement, and described an undisturbed ‘proportional organization of the action’. Therefore, the hesitations which are observed by many investigators seem to reflect a deficit of programme implementation in Parkinson’s disease patients. Our findings, as well as those just summarized, support Marsden and Obeso’s hypothesis (1994) that the normal function of the basal ganglia, which is disturbed in Parkinson’s disease, is the ‘routine automatic execution of sequences of movements generated in cortical motor areas’. The finding of preserved motor programming, but disturbed programme implementation in Parkinson’s disease is contrary to Harrington and Haaland’s (1991) interpretation of their study, in which the patients performed hand posture sequences of varying lengths. These consisted of either the same (repetitive sequences) or different postures (heterogeneous sequences). The comparison between the repetitive and heterogeneous sequences in their study revealed that Parkinson’s disease patients seemed to be impaired in
programming the heterogeneous sequences as indicated by a less prominent length effect, while the programming of the repetitive sequences was intact. These authors stated that programming still takes place during the longer interresponse times. In the present study, the occurrence of similar kinematic adjustments in the first segment of the sequence for both groups suggests that the subjects responded to the increased accuracy requirements in the second segment by a modified motor programme. It is, therefore, more likely that the hesitations are caused by the difficulty in selection and initiation of the next step in the motor programme (Bloxham et al., 1984) than to faulty generation of the motor programme itself. That the Parkinson’s disease patients in Harrington and Haaland’s (1991) study had more difficulties with the heterogeneous sequences in contrast to the repetitive sequences, also supports the hypothesis that it is the implementation of the next programme step which is defective. It can be assumed that the time necessary to implement the next part of the motor programme is dependent on the difference in complexity between the parts of the motor programme. With increasing difference in complexity, the disturbed implementation process in Parkinson’s disease should cause a more pronounced deficit and/or hesitation between the movement segments. While our study demonstrates that a deficit of motor programming itself is unlikely to be responsible for disturbed sequencing in Parkinson’s disease, further research is necessary to evaluate the nature of the implementation problem. Parkinson’s disease patients, like the controls, changed the organization of the second segment in relation to target size. These kinematic findings were supported by the number of wrongly executed trials, which were not further analysed. Both groups produced significantly more erroneous trials in the condition ‘small’ than in the other two conditions indicating that the task used was sufficiently demanding for both subject groups. The similarity of the distributions of erroneous trials across all three conditions for both groups proves that the reported kinematic findings cannot be explained by a biased trial selection. Both groups lengthened movement time and reduced velocity and acceleration during the second segment under the ‘small’ as compared with the ‘large’ condition. When analysing the relationship between segment movement time correlations, parameters representing the ‘context effect’, and the influence of target size at the subject level, the target size effects were more pronounced for control subjects with highly correlated segment movement times. The context effect changes were present in all control subjects, but not associated with the degree of segment movement time correlation. For Parkinson’s disease patients, however, the segment movement time correlations were not only related to parameters representing the target size effects, but also strongly related to those parameters representing the ‘context effect’. A possible interpretation of these results is that Parkinson’s disease patients and normal subjects with a high correlation of movement segments connect the motor programming and implementation processes more strongly
Sequencing in Parkinson’s disease and reduce the degrees of freedom in the motor system. The positive correlation of disease stage (Hoehn and Yahr, 1967) with the segment movement time correlation coefficients suggests that with progression of the disease the degrees of freedom in the motor programming processes become reduced. While the target size effects were present in both subject groups, the lengthening of deceleration time was more pronounced for Parkinson’s disease patients when the accuracy requirements in the second segment increased. Because of similar peak deceleration modulation in both groups (Table 2A), the prolongation of the second deceleration time in Parkinson’s disease patients is not so much a direct consequence of a reduced mean peak deceleration, but rather due to irregularities in the movement termination phase (as Fig. 4 B illustrates with the help of the velocity curves). The irregular movement termination suggests an influence of action tremor (Lance et al., 1963; Tera¨va¨inen and Calne, 1980) on the performance of Parkinson’s disease patients. This underlying action tremor possibly disturbs the smooth implementation of force in the patients and, consequently, produces bradykinesia. This phenomenon is more obvious under conditions of higher task difficulty. Problems of the Parkinson’s disease patients in the termination phase of the movements, similar to those in the second segment, were revealed through comparisons between the ‘simple’ and the two complex conditions. Movement and deceleration times in the first segment were significantly prolonged in the condition ‘simple’, and Parkinson’s disease patients did not show an increase in the peak velocity in the condition ‘simple’ compared with the two-segment movements, like the controls (Fig. 3). These findings suggest that Parkinson’s disease patients have a reduced capability to modulate force when the termination of a movement is required. The foregoing described deficits of the Parkinson’s disease patients may be explained by impaired force control in Parkinson’s disease (Teulings and Stelmach, 1991; Stelmach and Castiello, 1992). While Parkinson’s disease patients are able to generate required forces quite accurately when there are no time constraints (Stelmach and Worringham, 1988) the temporal characteristics of the force generation (Jordan et al., 1992), especially the rate of force development (Teasdale et al., 1990; Godeaux et al., 1992) and force release (Wing, 1988; Kunesch et al., 1995) is disturbed in comparison with controls. These deficits result in a slowed execution each time a force change has to be implemented. These findings also support Sheridan’s view (1987) that the correct motor programme is not translated properly into action by the ‘noisy’ motor system in Parkinson’s disease. Deceleration problems in both segments can be interpreted as support for such a ‘noisy’ motor system. By utilizing the ‘context effect’, this study presents evidence for preserved motor programming in Parkinson’s disease, indicated by the sensitivity of the patients’ performance to the accuracy requirements in a segmented movement. In contrast to control subjects, Parkinson’s disease
101
patients showed pronounced hesitations between the segments and problems in the termination phase of the movements, possibly due to programme implementation difficulties caused by an inability to rapidly modify force.
Acknowledgements The authors wish to thank Frank Hilperath for his help in setting up the experiment, Carl Waterman for programming expertise and provision of the analysis software and Dr William Stock for helpful advice in statistical questions. The authors would like to express their gratitude to the patients and control subjects, whose enthusiasm and patience made the realization of the study possible. We are indebted to the anonymous referees, whose thoughtful comments allowed us a better presentation of the data. This study was supported by grants from the Arizona Disease Control Research Commission (82–0377), National Institutes of Health for Neurological Diseases and Stroke (NS 17421), the Deutsche Forschungsgemeinschaft (SFB 194, A5) and the German Ministry for Research and Technology (BMFT 01 KL 9004).
References Agostino R, Berardelli A, Formica A, Accornero N, Manfredi M. Sequential arm movements in patients with Parkinson’s disease, Huntington’s disease and dystonia. Brain 1992; 115: 1481–95. Benecke R, Rothwell JC, Dick JPR, Day BL, Marsden CD. Performance of simultaneous movements in patients with Parkinson’s disease. Brain 1986; 109: 739–57. Benecke R, Rothwell JC, Dick JPR, Day BL, Marsden CD. Disturbance of sequential movements in patients with Parkinson’s disease. Brain 1987; 110: 361–79. Bennett KMB, Marchetti M, Iovine R, Castiello U. The drinking action of Parkinson’s disease subjects. Brain 1995; 118: 959–70. Berardelli A, Accornero N, Argenta M, Meco G, Manfredi M. Fast complex arm movements in Parkinson’s disease. J Neurol Neurosurg Psychiatry 1986a; 49: 1146–9. Berardelli A, Dick JPR, Rothwell JC, Day BL, Marsden CD. Scaling of the size of the first agonist EMG burst during rapid wrist movements in patients with Parkinson’s disease. J Neurol Neurosurg Psychiatry 1986b; 49: 1273–9. Bloxham CA, Mindel TA, Frith CD. Initiation and execution of predictable and unpredictable movements in Parkinson’s disease. Brain 1984; 107: 371–84. Castiello U, Stelmach GE, Lieberman AN. Temporal dissociation of the prehension pattern in Parkinson’s disease. Neuropsychologia 1993a; 31: 395–402. Castiello U, Bennett KMB, Stelmach GE. Reach-to-grasp: the natural response to perturbation of object size. Exp Brain Res 1993b; 94: 165–78. Evarts EV, Tera¨va¨inen H, Calne DB. Reaction time in Parkinson’s disease. Brain 1981; 104: 167–86. Fitts PM. The information capacity of the human motor system in
102
P. Weiss et al.
controlling the amplitude of movement. J Exp Psychol 1954; 47: 381–91.
execution of sequential movements in Parkinson’s disease. J Neurol Neurosurg Psychiatry 1987; 50: 1267–73.
Godeaux E, Koulischer D, Jacquy J. Parkinsonian bradykinesia is due to depression in the rate of rise of muscle activity. Ann Neurol 1992; 31: 93–100.
Sheridan MR, Flowers KA, Hurrell J. Programming and execution of movement in Parkinson’s disease. Brain 1987; 110: 1247–71.
Hallett M, Khoshbin S. A physiological mechanism of bradykinesia. Brain 1980; 103: 301–14. Harrington DL, Haaland KY. Sequencing in Parkinson’s disease. Brain 1991; 114: 99–115. Hoehn MM, Yahr MD. Parkinsonism: onset, progression and mortality. Neurology 1967; 17: 427–42. Jahanshahi M, Brown RG, Marsden CD. Simple and choice reaction time and the use of advance information for motor preparation in Parkinson’s disease. Brain 1992; 115: 539–64. Jeannerod M. Mental imagery in the motor context. [Review]. Neuropsychologia 1995; 33: 1419–32. Jordan N, Sagar HJ, Cooper JA. A component analysis of the generation and release of isometric force in Parkinson’s disease. J Neurol Neurosurg Psychiatry 1992; 55: 572–6. Kunesch E, Schnitzler A, Tyercha C, Knecht S, Stelmach G. Altered force release control in Parkinson’s disease. Behav Brain Res 1995; 67: 43–9. Lance JW, Schwab RS, Peterson EA. Action tremor and the cogwheel phenomenon in Parkinson’s disease. Brain 1963; 86: 95–110. Marsden CD, Obeso JA. The functions of the basal ganglia and the paradox of stereotaxic surgery in Parkinson’s disease [see comments]. [Revew]. Brain 1994; 117: 877–97. Comment in: Brain 1995; 118: 822. Marteniuk RG, MacKenzie CL, Jeannerod M, Athenes S, Dugas C. Constraints on human arm movement trajectories. Can J Psychol 1987; 41: 365–78. Rafal RD, Inhoff AW, Friedman JH, Bernstein E. Programming and
Stelmach GE, Worringham CJ. The preparation and production of isometric force in Parkinson’s disease. Neuropsychologia 1988; 26: 93–103. Stelmach GE, Castiello U. Functional force control in Parkinson’s disease patients. In: Stelmach GE, Requin J, editors. Tutorials in motor behavior II. Amsterdam: Elsevier, 1992: 401–23. Stelmach GE, Worringham CJ, Strand EA. Movement preparation in Parkinson’s disease. The use of advance information. Brain 1986; 109: 1179–94. Stelmach GE, Worringham CJ, Strand EA. The programming and execution of movement sequences in Parkinson’s disease. Int J Neurosci 1987; 36: 55–65. Stelmach GE, Garcia-Colera A, Martin ZE. Force transition control within a movement sequence in Parkinson’s disease. J Neurol 1989; 236: 406–10. Teasdale N, Phillips J, Stelmach GE. Temporal movement control in patients with Parkinson’s disease. J Neurol Neurosurg Psychiatry 1990; 53; 862–8. Tera¨va¨inen H, Calne DB. Action tremor in Parkinson’s disease. J Neurol Neurosurg Psychiatry 1980; 43: 257–63. Teulings HL, Stelmach GE. Control of stroke size, peak acceleration, and stroke duration in parkinsonian handwriting. Hum Mov Sci 1991; 10: 315–34. Wing AM. A comparison of the rate of pinch grip force increases and decreases in parkinsonian bradykinesia. Neuropsychologia 1988; 26: 479–82.
Received April 2, 1996. Revised July 19, 1996. Accepted September 24, 1996