Mar 2, 1994 - for feature extraction. Several have made use of shadow geometry for hypothesis generation and ... while individual objects cover a much smaller proportion of the image. Vertical lines in particular are less prominent, typically only a few pixels long. Edge contrast may be lessened due to illumination and.
Geometry Space and Object Projective Extraction Building for Monocular J. Chris McGlone Jefferey A. Shufelt"
March 2, 1994 CMU-CS-94-1 18 School ofComputer Science Carnegie Mellon University Pittsburgh, PA 15213-3891 This report is an extended version of a paper to appear in Proceedingsof the IEEE Conference on Computer Vision and Pattern Recognition, Seattle, WA, June 20-23, 1994.
"Abstract Knowledge about the imaging geometry and acquisition parameters provides usefui geometric constraints for the analysis and extraction of man-made features in aerial imagery, particularly in oblique views. In this paper, we discuss the identification of horizontal and vertical lines in the scene using image orientation information, vanishing point calculations, and the calculation of their dimensions. The vertical and horizontLi attributions are used to constrain the set of possible building hypotheses. Vertical lines are extracted at comers to estimate structure height and permit the generation of three-dimensional building models from monocular views. Results of these techniques are presented for nadir and oblique imagery and evaluated against manually generated 3D ground truth building models. *Supported by an Augmentation Award for Science and Engineering Research Training sponsored by the Army Research Office, Department of the Army, under Contract DAAH04-93-G-0092. This work was sponsored by the Defense Advanced Research Projects Agency under Contract DACA76-92-C-0036. The views and Conclusions contained in this document are those of the authors and should not be interpreted as representing the official policies, ei!her expressed or implied, of the Army Research Cff ice, the Department of the Army, Ahe Defense Advanced Research Projects Agency or the United States Government.
Best Available Copy
Keywords: cartography, building recognition, projective geometry, vanishing point
PROJECTIVE AND OBJECT SPACE GEOMETRY FOR MONOCULAR BUILDING EXTRACTION
Table of Contents
1. INTRODUCTION 2. IDENTIFICATION OF VERTICAL AND HORIZONTAL LINES 2.1. Vertical lines 2.1.1. Calculation of the vertical vanishing point 2.1.2. Identification of vertical lines 2.2. Horizontal edge extraction 3. HORIZONTAL AND VERTICAL LINE VERIFICATION 4. CORNER DETECTION WITH LINE ATTRIBUTIONS 5. IMAGi9 SPACE BUILDING HYPOTHESIS GENERATION 6. OBJECT SPACE BUILDING HYPOTHESIS GENERATION 6.1. Vertical line location 6.2. Height estimation 7. HYPOTHESIS EVALUATION 7.1. Evaluation methodology 7.2. Experimental results 8. CONCLUSIONS AND FUTURE WORK 9. ACKNOWLEDGMENTS 10. REFERENCES
1 1 1 2 3 4 4 5 7 9 10 11 12 13 14 22 23 23
Looessjon For
NTIS
9RAjfj
DTIC TAB Unannouncod JUstif ctrI on
AV
"llability
d
%oedeg
ad/or aý Dint
Speciled
I
PROJECTIVE AND OBJECT SPACE GEOMETRY FOR MONOCULAR BUILDING EXTRACTION
Figure 1: Figure 2: Figure 3: Figure 4: Figure 5: Figure 6: Figure 7: Figure 8: Figure 9: Figure 10:
List of Figures
Vertical vanishing point geometry. Fort Hood test area RADTvWO. Edges for test area RADT9WOB. Horizontal edges. Vertical edges. Simple building model. BABE hypotheses, RADT9WOB. Geometrically consistent hypotheses. Peaked roof projection. Original BABE results.
Figure 11: New BABE results.
Figure Figure Figure Figure Figure Figure Figure Figure
12: 13: 14: 15: 16: 17: 18: 19: Figure 20: Figure 21: Figure 22: Figure 23: Figure 24: Figure 25: Figure 26: Figure 27: Figure 28: Figure 29: Figure 30: Figure 31:
iii
All verticals. Vertical finding at one corner. Height estimation geometry. Object space results. Perspective view. RADTs results. RATrss results. RADTsOB results. RADTSWOB results. RADT6 results. RADT6S results. RADT6OB results. RADT6WOB results.
RADT9 results. RADTgS results.
2 3 3
4 4 6 7 7 8 9 9
11 11 11 13 13 15 15 15 15 16 16 16 16 17 17 17 17
Figure 32: Figure 33: Figure 34: Figure 35: Figure 36:
RADT90B results. RADiTWOB results. RADTIo results. RADTIoS results. RADTIOOB results. RADTIOWOB results. RADT11 results. RADTIIS results. RAlrlIOB results. RADT11WOB results.
Figure 37: Figure 38: Figure 39: Figure 40:
Initial box hypotheses. Verification failure. Fragmented edges. Line grouping errors.
21 21 22 22
18 18 18 18 19 19 19 19
PROJECTIVE AND OBJECT SPACE GEOMETRY FOR MONOCULAR BUILDING EXTRACTION
v
List of Tables Table 1: Table 2: Table 3: Table 4: Table 5:
Evaluation Evaluation Evaluation Evaluation Evaluation
statistics statistics statistics statistics statistics
for scene RADT5 for scene RADT6 for scene RAYr9 for scene RADTi0 for scene RADTII
15 16 17 18 19
PROJECTIVE AND OBJECT SPACE GEOMETRY FOR MONOCULAR BUILDING EXTRACTION
1. INTRODUCTION Building extraction is a fundamental problem in automated cartography" 2, 3. 4. 5. 6. 7.8. Systems implemented to date have had basic similarities: all have used vertical aerial imagery, assumed simplified imaging geometry in their calculations, and all have used intensity features as the basic cues for feature extraction. Several have made use of shadow geometry for hypothesis generation and verification. Low level boundary determination is usually region-based or based upon geometric analysis of lines found in the image. Many of these techniques exhibit poor performance when building structures are composed of complex shapes, when there is poor contrast between object and background, and when viewing geometry, building height, and building density cause occlusions and partial views or views of surfaces other than the building roof. As a result, even in the case of nominally nadir imagery, the three-dimensional nature of the world can not be ignored. In the case of non-traditional mapping photography, particularly oblique views used in aerial photo interpretation, there is a greater need to explicitly model the viewing geometry; such modeling needs to be performed within the context of a rigorous photogrammetric calculation in order to take advantage of all geometric information available 9 . Our current experiments have been focused on the modification of BABE (Builtup Area Building Extraction) 6 , a building detection system based on a line-corner analysis method. In brief, BABE proceeds through four major phases to incrementally generate building hypotheses. The first phase constructs corners from lines, under the assumption that buildings can be modeled by straight line segments linked by (nearly) right-angled corners. The second phase constructs chains of edges which are linked by corners, to serve as partial structural hypotheses. The third phase uses these line-corner structures to hypothesize boxes, parallelopipeds which may delineate man-made features in the scene. The fourth phase evaluates the boxes in terms of size and line intensity constraints, and the best boxes for each chain are kept, subject to shadow intensity constraints similar to those proposed inI and 2 . In addition, the boxes produced by the third phase of analysis are directly used as sources of building hypotheses for other modules that perform grouping, shadow analysis, and stereo matching. Our experiments have focused on the inclusion of geometric constraints derived from knowledge of the full camera position and orientation. Our initial modifications to the BABE system include the use of a rigorous photogrammetric camera model, the use of world and image geometry as an additional cue for the building hypothesis construction process, and the substitution of exact metric calculations for distances and angles instead of approximations based upon image scale and near-nadir orientation. This paper describes the current status of the BABE system, starting with an overview of vanishing point geometry as used for the extraction of horizontal and vertical edges and a brief description of the BABE system. The current integration of the line orientation information into BABE is outlined and quantitative performance evaluations against manually-generated ground truth are given, for both image space and object space. 2. IDENTIFICATION OF VERTICAL AND HORIZONTAL LINES Given the orientation of the image, we can make inferences about the geometry of the scene. In this section we discuss the identification of vertical and horizontal lines using projective geometry and photogrammetric techniques. These line attributions are exploited in later sections to constrain the search for corners and the generation of building hypotheses. 2.1. Vertical lines As is well known from projective geometry1 0 , parallel lines (in this case, vertical lines) in a scene meet at a common point in an image of the scene. This point is known as the vanishing point, since it is the image of a point at infinity on the parallel lines. In a standard nadir-looking aeri•', mapping image vertical lines in the scene meet at the vertical vanishing point, traditionally referred to as the nadir point because it is directly below the perspective center of the image. This apparent convergence of parallel lines gives important cues to the orientation of the image and to the structure of objects within the scene. Previous work has used vanishing points to determine imagle orientation 10 and to determine the structure of objects within the sceneI. 12.
PROJECTIVE AND OBJECT SPACE GEOMETRY FOR MONOCULAR BUILDING EXTRACTION
2
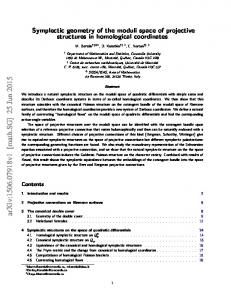
However, most previous work using vanishing point geometry has been done with robotics imagery from standard video cameras viewing objects at close range. The applicability of vanishing point analysis is obvious; perspective effects are strong due to the wide angle lenses, close objects, and often oblique viewing angles. Image !.dges corresponding to hallways, doors, and structures are numerous, long and usually have high contrast, allowing good solutions for vanishing points and image orientations. Aerial imagery presents different problems. The standard vertical viewpoint lessens perspective effects, while individual objects cover a much smaller proportion of the image. Vertical lines in particular are less prominent, typically only a few pixels long. Edge contrast may be lessened due to illumination and atmospheric conditions. It is well known that standard edge detectors have problems extracting such short, weak edges, often distorting their geometry or mistakenly combining them with intersecting edges. Further, in cartographic applications it is assumed that the aircra'f position and orientation in space is fairly well known, and camera properties such as focal length, distortion and sensor type, film, scanning array, etc., are quite well modeled. For these reasons, our approach starts with the assumption that the orientation of the aerial image is known beforehand. Instead of using the vanishing points to determine image orientation, we focus on using the vanishing point geometry to assist in extracting buildings. Given strong enough vanishing point information from the image the orientation can be refined, but in this work no refinement was attempted. 2.1.1. Calculation of the vertical vanishing point
image vertical vector
image of vertical line
".•vanishing pt
vertical line
Figure 1: Vertical vanishing point geometry. The image orientation is specified by a 3 by 3 matrix M which rotates the ground coordinate system into the image coordinate system. This matrix is determined by three independent orientation angles or parameters, e.g., roll, pitch, and yaw 13 . is [0, 0, 11 (Figure I); it is transformed into the image coordinate The vertical vector in object space ~Tý system by multiplication with the ground-to-image orientation matrix M. Vi = M Vo
3
PROJECTIVE AND OBJECT SPACE GEOMETRY FOR MONOCULAR BUILDING EXTRACTION
When the vector vi is placed at the perspective center of the image (coordinates 0,0,f, where f is the focal length), it pierces the image plane z = 0 at x=
m33
f
y=m23f m33
Since this vector is vertical it is parallel to all other vertical lines in the scene and its image must pass through the vertical vanishing point. However, its image, where the vector pierces the image plane, is only a point; its image must therefore be the vertical vanishing point. 2.1.2. Identification of vertical lines In order to find vertical lines in the scene each edge in the image is fit to a line constrained to pass through the vanishing point, leaving only the slope of the line to be determined. If the root-mean-square error of the residuals exceeds 2.0 pixels, the edge is eliminated. Since extremely short edges will have small residuals for any orientation of line fit, edges below a minimum length are eliminated. As a further test, a line not constrained to pass through the vanishing point is also fitted to accepted edges and the slope of that line compared to the direction from the centroid of the edge to the vanishing point. If the slopes do not agree within an angular tolerance of 0.2 radians, the line is eliminated.
'Vi
9-
Figure 2: Fort Hood test area RADT9WOB.
""
. -,.,,
,
"
Figure 3: Edges for test area RADT9WOB.
The same resection that produces the image orientation used to calculate the vertical vanishing point also calculates the precision of the orientation angles, from which the precision of the vanishing point location can be determined and used to set the acceptance criteria for slopes and lirn, fitting. For oblique imagery, where the vanishing point is usually outside the image area itself, the precision has a small effect. For vertical images, however, the vertical vanishing point is near the center of the frame and is close to the edges being tested. Error in its location can change the slope of the test line significantly and should be taken into account in the line fitting procedure.
PROJECTIVE AND OBJECT SPACE GEOMETRY FOR MONOCULAR Bt ILI)ING EXTRACTIN
~
Ii,.
7
Fi ur
4: H ri o t l d e .
4i
4
4f'I4% 5:
Ve t ca V;ur dg
.
2.2. Horizontal edge extraction In earlier versions of this work we applied a variant of the Gaussian sphere technique' t () 14 Co identify horizontal vanishing points within the image15 . By histogramming the intersection points of edges in the ima,,e= with the horizon on the Gaussiani sphere., we idfentified the vanishing points associated with the most common sets of perpendicular lines. For reasons economy we now directly calculate object-space azimuths of algorithmic simplicity and computational for each edge in the ima,;e. assuming that the edge is hiorizontal in the scene. These calculated azimuths are accumulated in a histoegram. Under the assumption that man-made structures are defined by perpendicular sets of parallel lines, we examine the azimuth histogram for mutually supportive the ,,ingle bin with the maximum score. we add the sets of perpendicular lines. Instead of selectingz score of each bin to the scores of the bins representing, directions perpendicular to it. The maximum of this sum indicates the directions of the strongest mutually perpendi"cular sets of parallel lines in the scene. In areas where buildin,,s and roads are all on a common grid. this is sufficient; in areas where buildings are oriented in several direction,,. secondary maxima can be examined or separate histograms done in subareas of the scene. Figure 2 shows an oblique image of a barracks area within military bases or. with some architectural modifications, Fort Hood. Texas. Such ,,cenes are typical ot houses in a suburban development. Figure 3 shows the ednes extracted by an implementation of the 1 horizontal and" vertical ed,,zes are shown in Figures 4 and Nevatia-Babu line finder lb. while candidate 5. Some edges are labeled as both horizontal and vertical due to the viewing angle of the image, which edges with the vertical vanishing point. In such ambiguous happened to align many of the horizontal cases. external information or other views must be used to decide between these labels. 3. HORIZONTAL AND VERTICAL LINE VERIFICATION Given a single view anQt only: geometric, information, the prevent an absolute determination of whether a ,.ziven inherent ambiguities• o fpers pective proiection. line is horizontal or vertical. False posit.ve identifications due to accidental alignments are unavoidable. Since these false positives increase the number of edges ["lagged for later analysis, and hence the computational effort required to address theni. we would like to eliminate as many as possible. A first step is filterin ga gainst a minimum leng.th•or height• threshold. H-ig.hlv• textured areas produce a
PROJECTIVE AND OBJECT SPACE GEOMETRY FOR MONOCULAR BUILDING EXTRACTION
5
large number of short, randomly oriented edges, some of which will align with the vanishing point of interest. Using the assumed horizontal or vertical orientation for the line, we can calculate an approximate length or height and compare it to the minimum values we would expect to see. For example, if we are looking for buildings, heights will typically be greater than 3 meters and lengths greater than 10 meters. Such constraints can be easily modified by world knowledge to search for a specific set of buildings within a range of heights or volumes. Currently we view this process as one of filtering rather than selection. Each edge segment that passes these filters is given an attribution as either horizontal or vertical. The entire collection of edges can then be used in a variety of ways to construct plausible building hypotheses. In the following section we describe the use of attributed edge segments to detect and construct possible building corners. If multiple views of the scene are available, we can use epipolar geometry to verify the consistency of edges across images. For each edge in the image, we calculate the epipolar plane through its midpoint and determine which edges, if any, are intersected by the epipolar line on the other image. We can also compare calculated dimensions, either length or height, and also calculated orientations in object space for horizontal lines. 4. CORNER DETECTION WITH LINE ATTRIBUTIONS The vanishing-point geometry of a scene can provide important additional cues for feature extraction. Under at theedges, assumption that man-made features in aerial photography can be modeled by parallelopipeds joined horizontal and vertical edge segment attributions are useful cues in assembling building hypotheses. We illustrate the utility of these attributions in the context of a building extraction system, BABE, originally designed for analysis of mapping photography having nadir and near-nadir acquisition geometries. begins processing by generating intensity edges for an image, using a Nevatia-Babu edge finder t 6 It next applies a range search to locate and connect collinear edges whose endpoints are in close proximity, to address the possibility of fragmented edges. These edges are then used as the basis for corner detection. BABE
performs another range search on the edges, to locate edges which meet at approximately right angles. The intersections of these edges represent the corner points. These comer points are then used to link sequences of edges such that the direction of rotation along a sequence is either clockwise or counterclockwise, but not both, since building structure is assumed to be well modeled by parallelopipeds. BABE
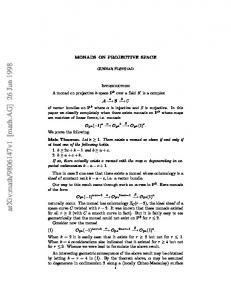
Even when a building can be modeled perfectly by a rectangle, the chain of edges representing it may not be a closed structure, due to extraneous or missing corners in the chain. BABE addresses this problem by generating building hypotheses, i.e., boxes, for every subchain of edges in a chain. This is accomplished by taking every subchain of at least two edges and completing them to four-sided boxes. Typically, only about 10% of the boxes generated for a scene correspond to buildings. BABE's verification phase selects building candidates from the boxes generated in the previous phase. It performs this task by examining the boxes for indications of a shadow region along the shadow casting edges. Under an oblique viewing geometry, BABE's model first breaks down in the corner detection phase where right-angled corners in the scene may not translate to right-angled comers in the ;m-1se. In fact, the actual angle depends not only on the obliquity of the viewing geometry, but on the r%.,.,, e position and orientation of the building in the scene. Using the horizontal and vertical line identification techniques described in Section 2. we can assign attributions to each edge prior to corner generation. We can then make use of a simple building model. outlined in Figure 6. This model presents two simple and common classes of buildings, those with tlat roofs and those with peaked roots. The two types of buildings are shown from various viewpoints (symmetric cases are omitted for brevity). Each distinct line segment in the diagram has been assigned a label, indicating whether it is a vertical or horizontal line in object space, or whether it is neither. In object space, we observe that for flat-roof
6
PROJECTIVE AND OBJECT SPACE GEOMETRY FOR MONOCULAR BUILDING EXTRACTION
peaked roof
fiat roof
h
nadir
h h
h
hh
v h
side
vhh
h
h
h V
vh
h
h
h
h vh
Vhh
v h h front
h
hT
h
hO
NN h
h
V
AVV
h h
h Vh
Nh
oblique
Vh
V h
ý
N V
h
L h
h - horizontal line v - vertical line N - unclassified line (neither horizontal nor vertical)
Figure 6: Simple building model. structures, side and front facets of buildings are instances of rectangles composed of alternating horizontal and vertical segments, and roof facets are instances of rectangles formed by four horizontal segments. For peaked-roof structures, each side facet is again represented by a rectangle of alternating horizontal and vertical segments; roof facets are now instances of rectangles of alternating horizontal and unlabeled segments. A front facet of a peaked-roof structure is a pentagon, composed of two unlabeled segments, two verticals, and a horizontal segment. It is worth noting that BABE does not explicitly use this simple model in its processing phases; there is nothing in principle that prohibits an extension to BABE tor constructing more complex shapes by joining these rectangular or pentagonal facets. The model is useful, however, for visualizing the relationships between horizontal, vertical, and unlabeled lines in typical man-made structures. These properties of building facets suggest the following set of heuristics for corner detection: "*Two intersecting verticals never form a valid corner in object space. "*A horizontal-vertical intersection is allowed to form a comer. "*Two intersecting horizontals are allowed to form a comer, if their intersection in object space forms a right angle. o An unlabeled line intersecting with a labeled line is allowed as a corner, since it is potentially part of a peaked roof. e Two intersecting unlabeled lines are allowed to form a comer, as they may be part of a pentagonal facet; it should be noted, however, that the current version of BABE will not generate pentagonal descriptions. We intend to pursue more general shape constructions in future work.
7
PROJECTIVE AND OBJECT SPACE GEOMETRY FOR MONOCULAR BUILDING EXTRACTION
These heuristics must take into account the fact that a given line may be labeled as both horizontal and vertical, if the imaging geometry is such that the direction of the horizontal vanishing point for some set of lines is the same as the vertical vanishing point. They do so by allowing such lines to be regarded as both horizontal and vertical lines during corner formation. 5. IMAGE SPACE BUILDING HYPOTHESIS GENERATION Given the ability to $enerate corners in oblique imagery, BABE can be used to generate structural hypotheses, boxes which delineate structure in the scene. In the original implementation of BABE, the only geometric constraint applied during line-corner linking and box formation was the right-angle constraint on corners. In the new implementation, we can apply our simple building model at this stage to prune geometrically inconsistent hypotheses. For each box generated by BABE, we examine the horizontal and vertical line attributions assigned to each line segment of the box. If the four attributions are consistent with the labelings of any building facet in the building model, the box is accepted. For example, a facet with alternating horizontal and vertical lines is consistent with a side facet of a building and would be accepted. If the four attributions do not match any of the allowable building facets, the box is rejected as being geometrically inconsistent, such as a box comprised of four vertical lines.
flpAi
4,7,i. •: so,
/1.
*56
W
N#ý
~4
44
......................... 44
44*4-
Figure 7: BABE hypotheses. RADT9WOB.
4
,
..
Figure 8: Geometrically consistent hypotheses.
Figure 7 shows the complete set of boxes generated by BABE prior to the application of ,.eometric labeling constraints; in this case, there are 3459 boxes. Figure 8 shows the set o' '746 boxes let~i after the labeling constraints have been exercised. As the figures show, the labeling constraints alone provide a strong constraint on the permissible hypothesis geometries. After the application of the labeling constraints, the boxes are passed through BABE's verification phase. which estimates shadow intensity and sun illumination direction and uses this knowledge to score each hypothesis based on its conformance with these parameters. At this time, the verification phase makes no use of the photogrammetric information, and hence theats all hypotheses as though they represented features in a nadir-acquisition geometry. We intend to address this shortcoming in future work. After verification, we are left with a set of hypotheses which are presumed to be geometrically consistent, in that they are composed of corners exhibiting valid angles in image space and that they possess valid labelings with respect to our simple building model, and which arc presumed to b
PROJECTIVE AND OBJECT SPACE GEOMETRY FOR MONOCULAR BUILDING EXTRACTION
8
photometrically consistent, in that they exhibit a combination of strong intensity gradient across edge oundaries and are adjacent to dark regions in the image which could plausibly be the shadows of the hypothesized structures. Given these presumptions, it is reasonable to regard these hypotheses as verified facets of threedimensional structure in the scene. Using the scene geometry in conjunction with our building model, it becomes possible to extrapolate these partial delineations of building structure into more complete building models. We consider one such extrapolation here, that of completing partially peaked roofs to cover the entire roof. Using our model, we know that facets with alternating unlabeled and horizontal lines must be peaked roof facets; we can detect these facets by examining the line labelings and applying geometric constraints to extrapolate the other peaked roof facet in the pair. hypothesized
facet
g
x
Figure 9: Peaked roof projection. Figure 9 illustrates the situation at hand. The hypothesized facet represents a BABE hypothesis which we wish to use as a guide for hypothesizing the other half of the rooftop. We begin by computing the line perpendicular to the horizontal line R in object space, and projecting this perpendicular into image space (line C). Next, we intersect that line with the line drawn through the roof peak point p and the vertical vanishing point vp, to obtain a point x. In object space, the distance between x and e is equal to the distance between x and n; we assume that these distances are equal in image space as well, and complete the new building facet by using the roof peak point p, points n andf, and the application of symmetry to generate g. Figure 10 shows the original BABE results for the scene; Figure II illustrates the final image space results generated by our current extensions. The major improvement apparent from the figures is due to the peak projection technique, which has improved the modeling of peaked structures, correctly hypothesizing roof facets that were either lost in the shadow evaluation phase of BABE, or were never generated due to a lack of edge information. There are still problems; our current extensions to BABE produce many more hypotheses than the basic BABE system, due to the necessity of considering all possible corners in image space. Combined with the current lack of true object-space verification techniques, more.false hypotheses remain in the final output, which can be seen in Figure 1i. The problems just described arise primarily from issues in modeling and hypothesis generation. In a full implementation of a general viewpoint BABE, it would be desirable to maintain the generate-and-test
9
PROJECTIVE AND OBJECT SPACE GEO)METRY FOR 1()NOCL(LAR BUILDING EXTRACTION
-
.
S•
A4
7
A
4
A
44
ft'
•9
Figure 10: Original BABE results.
•
o
L
Figure 11: New BABE results.
aradigm used in the original version of BABE. During the line-corner chain forming phase, one would ike to construct full three-dimensional structural models in object space. rather than two-dimensional models in image space. These models would then be subjected to a verification process similar in spirit to the shadow constraint algorithms BABE now employs. but with the added information provided by scene geometry and illumination constraints on adjacent planar surfaces of similar materials. This point will be discussed again in the final section. 6. OBJECT SPACE BUILDING HYPOTHESIS GENERATION In this section, we consider the problem of determining the height of 2D building hypotheses from a monocular view. Previous research in this area has typically involved some form of shadow mensuration, by associating dark regions in the image with building hypotheses and measuring their lengths in image space 4 . Such measurements have typically used approximations to the sun elevation anale in order to estimate structure height from shadow length. again producing a height estimate in terms of image space units. Image space-based shadow mensuration techniques encounter difficulties in the oblique domain. In nadir photography, shadows are adjacent to the structures casting them. making the association of shadow regions with building hypotheses a relatively casy task. Under widc angles of obliquity. however, it is difficult to correctly associate shadow regions with roof regions without a boundary' estimate of the wall to link the two, which is essentially what we seek when attempting to derive roof height. These techniques also encounter difficulties that are independent of the acquisition geometry. Approximations of the sun elevation anglc can introduce substantial error in height estimates. dependirng on sun location at the time of ima,,e acquisition. Difficulties also arise in measuring the len,,th of a shadow in image space: the dark shadow regions often have noisy boundaries, which could be due to noise in the image, occluding objects on the ground, or changes in ground elevation. An alternative approach is possible under photogrammetric control, using our simple huilding model. Given roof hypotheses, we can search for vcrtical lines in image space at roof corner points, and measure the heights of these verticals in obiect space to obtain heigtht estimates for the roof. In the next two sections, we discuss issues in reliable location of vertical lines a( corner points and methods for using these lines to measure heights for flat and peaked roof buildings.
PROJECTIVE AND OBJECT SPACE GEOMETRY FOR MONOCULAR BUILDING EXTRACTION
10
6.1. Vertical line location The goal of vertical line location is to find a vertical edge in image space which emanates from a specific point. In our case, we wish to find vertical lines at roof corner points, under the assumption that such lines must constitute the edges where building walls meet. A simple way to find such verticals would be to return to the original edge data and use the corner points as a basis for range search to find edges with vertical labels. This approach, however, is susceptible to the quality of the edge data, which can be poor for vertical edges. While template-based edge detectors perform reasonably well on long straight lines in aerial photography, they tend to round edges at corners, and often do not locate the vertical edges, which are typically much shorter. This means that potential vertical edges are often mislabeled as horizontals or neither" edges due to the rounding at corners, which can alter the computed orientation of the edge, or the potential vertical segments are not separated from other edges due to their shortness, instead being misinterpreted as noise at the end of an edge segment. To avoid these difficulties, we instead focus processing attention on the comer points, which are likely starting points for any vertical lines, and we use oriented edge-finding techniques to maximize the likelihood of finding short edges. We now outline the vertical line finding strategy we have developed, which performs well in finding short vertical edges. We utilize an imperfect sequence finding technique 17 to locate a line of pixels, beginning at a corner point and oriented in the direction of the vertical vanishing point, which have gradient higher than a certain threshold in the direction perpendicular to the line. Starting with the corner pixel, each pixel is tested to see if it has sufficient gradient support in the direction perpendicular to the line to be labeled an edge point. This labeling process produces a binary sequence of points, which are either labeled as edge points or non-edge points. The imperfect sequence finder is used to locate the terminating point of this sequence, which will be the other endpoint of the vertical line. The sequence finding technique is used tor two reasons; first, to tolerate noise along the potential vertical line, and second, to handle the potentially noisy gradient values in the immediate vicinity of corners, where many edges may meet. The edge/non-edge determination for each pixel is carried out by locating gradient extrema inside a window around the pixel, fitting a line to these extrema, and computing the residual error of this line with respect to the extrema points. A confidence score, weighting in the residual error of the fitted line and its slope with respect to the vertical vanishing point line is computed, and if this confidence score passes a threshold, the pixel is labeled an edge point; otherwise, it is labeled a non-edge pixel. This scheme allows correctly oriented lines with noisy gradient to be tolerated, since the slope of these lines will be close to that of the vanishing point line; it also allows for slight orientation errors to be tolerated if gradient support is high, when a line fits the gradient extrema well. In practice, given a corner point, the vertical line finding process is invoked from each pixel in a window around the corner point, to produce a set of possible verticals for each corner. This is done to alleviate the problem of corner localization; due to edge noise or line fitting errors, corners are not always well localized at the corner points. To select the best vertical from the set, a confidence score is computed for each vertical line in the same fashion as the confidence computation for pixels, except that the evaluation window covers the entire line. The vertical with the largest product of length and confidence is then selected as the most likely vertical for the corner point. Figure 12 shows the final set of verticals produced by the vertical line finding process for the RADT9WOB scene. Comparing this result with the original vertical line detection result in Figure 5, it is clear that guided edge extraction from seed comer points provides an improved method tor locating vertical lines. The area surrounded by the black square in this figure is shown in closer detail in Figure 13. This example shows the set of verticals grown from points in a I-pixel radius around the coner point of a peaked roof facet; roof facet line labelings are denoted by H for horizontal lines and N for neither" lines. The black vertical is the one ultimately selected from the set as the best vertical, based on the length and confidence scoring.
PROJECTIVE AND OBJECT SPACE GEONIETRN FORMNONOCULAR BLILDI)IN
-T
EXTRACTIO\
44
44 AA
Figure 13: Vertical findingz at one corner.
Figure 12: All verticals. 6.2. Height estimation
Pt,
D
P2
D)3
Figure 14: [leight estimation geometry. [f we assume that a given edge represents a vertical line in the scene and that the elevation at the bottom of the line isknown, we can calculate its heig-ht usinue similar trianglecs, as shown in Fiue14. We first calculate the coordinates of the hottomn point. P,, aind the top point as it'it were at the same elevation aN the bottom, P.. D) is then the distance hetween points P and P- and 1) is th ditnefom the image to P-. D, the ground distance between the P, and the point directly below the image. is then calculated using D, and H, the height of the image above the elevation ofP,.
PROJECTIVE AND OBJECT SPACE GEOMETRY FOR MONOCULAR BUILDING EXTRACTION
D
12
= &-
The height of the object h is then, from similar triangles, h=H 1 t
T3 After applying the vertical line finder to each corner point of every 2D building hypothesis, we measure each vertical line in object space to obtain a height value, producing height estimates at every corner of ever hypothesis. Corners with verticals contained within the 2D hypothesis boundary are not used for height estimation, since these vertical lines would not be visible in the image, and are hence artifacts of the vertical line finding process. Many of the verticals in Figure 12 fall into this category. Of the remaining verticals for each hypotheses, one is chosen with the largest product of length and confidence score, and the height associated with this vertical is used as the height for the entire structure. Since vertical edges are typically extracted shorter than they really are, the longest strong vertical is expected to be the most reliable. For flat roof buildings, this nearly completes the 3D hypothesis process; all that remains is to project the 2D hypothesis into object space using the height estimate, and to construct a 3D wireframe model by dropping points from the 2D boundary points. Ground elevation, of course, must be derived by some other means; for our experiments, we indexed into a DEM of the Fort Hood site to obtain the local ground elevation for each 3D structure. A similar process is used for peaked roof buildings to obtain the height of the flat portion of the peaked structure. It remains, however, to compute the height of the peak above the imaginary flat roof line. This can easily be performed by using information extracted during the peaked roof extrapolation phase. Returning to Figure 9, we note that p and x form a vertical line, which we measure in object space to obtain the height of the peaked portion of the structure. The absolute height of the peak is then computed by adding the flat height estimate to this peak height estimate. With object space measurements of each building structure, we perform a pruning step to weed away implausible buildings. Currently, any structure less than two meters in length, width, or height is pruned, but these can of course be modified to suit the typical buildings expected in the scene. In previous implementations, pruning mechanisms such as these were based on ad-hoc image space thresholds, which could be related to actual object space properties only through implicit assumptions about image scale and acquisition geometry. Figure 15 shows the object space models generated by this technique for RADT9WOB, projected back into image space. Figure 16 shows a perspective rendering of these models, and illustrates the threedimensional capabilities of this extraction system. The structures shown here have heights ranging from 2 meters, the pruning threshold, to 13.8 meters. These heights are qualitatively comparable to those measured manually. We discuss quantitative performance in the next section. We note that while shadow analysis was not used for height estimation in this work, it still constitutes a valuable source of information. In future work, we hope to integrate shadow analysis and vertical line finding to provide more reliable estimation of structure height; by using verticals to guide the search for shadows, the difficulties mentioned earlier can be alleviated. 7. HYPOTHESIS EVALUATION In the following sections, we discuss our strategy for quantitative evaluation of the performance of these building detection techniques. In Section 7.1, we describe our approach for generating ground truth models of the test scenes, for image space and object space comparisons; we also define evaluation metrics for capturing system performance. In Section 7.2, we present results for five test scenes in two nadir and two oblique images of the Fort Hood site, and analyze the results.
PROJECTIVE AND OBJECT SPACE GEOIETIX'
I4
.4
~,
FOR \i(NO(C
LAR BL ILI)IN( EXTRACTION
IS
.0
,*h
40
Figure 15: Object space results.
Figure 16: Perspective view.
7.1. Evaluation methodology Evaluation of the test results was done agzainst a manually-generated model of the building.,, in each test scene, using monocular measurements of building corner points in aill imagzes covering thc scene. A simultaneous photogrammetric bundle adjustment was done for each test scene which included the measured. p~oints, on. each. building., the original• control points., and ..all four ima,,cs.of the. scene. As\, Iart of the solution, building points were constrained to tit the specified type ot huildine model (flat or peaked roof-). The use of a simultaneous adjustment incorporating the building geome-tric constraints, insures that the most consistent and accurate buildingz estimates are obtained. The imagery, used was provided as part of the RADIUS program: a complication in the adjustment and in the later processing was the fact that it was geometrically processed to simulate an unspecified sensor. We approximated the unknown sensor using a frame camera model, which provided a rea.,onable fit across the image but had residual parallax in some of the test areas. To prevent this unusual situation from biasing the processing and evaluation we treated the bundle adjustment of each scene as, dealinz with separate images, and used the orientation information from the adjustment for each scene in processing that scene. In effect, this approximated the geometry of e; vh processed image with piecewise frame imag~es. For evaluation purposes. we use scene-wide metrics which analyze ihe degree of overlap between the automated results and the manually-gcneratcd models. These tnetrics allow. us to treat extraction errors of all types in a uniform way, and provide an unbiased measure of system performance. These, metrics also have the advantage of being applicable in both 2D and 3D. allowing quantitative comparisons of 2D building detection and delineation performance with the height estimation performance in 3D. In image space. we regard an automated extraction result as a classification of each pixel in the image as either building or non-building. An overlap comparison is then suimply a pixel-hv-pixcl comparison ot the 2D projections of the results of the automated system against thei 2D projcttion of the manuallygenerated building models. Measurements in image space allow us to i•ssess the delineation capabilities oft the system. In object space, we regard an extraction result as a classification of regions of space as either building or non-building. An overlap comparison in this domain can he implemented as a voxel-tv-voxel comparison of the 3D models generated by the automated system and the 3D manually-generated models. Measurements in object space allow us to assess the hei1ht es tieon capabilitis of the
system.
PROJECTIVE AND OBJECT SPACE GEOMETRY FOR MONOCULAR BUILDING EXTRACTION
14
Each overlap comparison produces a count of true positives (both manual and automated results detect building), false positives (the automated result shows a building, while the manual result does not), and true negatives (the manual result shows a building, while the automated result does not). We define four metrics from these pixel/voxel counts: * detection percentage = (IOOxTP)I(TP+TN). This metric measures the percentage of building pixels/voxels in the manual results which were actually detected by the automated system. * branch factor = FPITP. This metric, proposed in 7 , measures the degree to which the automated system "over-hypothesizes" building structure. 0 miss factor = TNITP. This metric, the counterpart of branch factor, measures the degree to which the automated system fails to hypothesize existing building structure. * quality percentage = (IOOxTP)I(TP+FP+TN). This metric summarizes overall system performance. Any false positives or true negatives are reflected in this score, and will lower the quality percentage. Before proceeding to the quantitative evaluations of the automated results, we note that all 3D overlap comparisons were done by first discretizing object space into voxels at 0.5m resolution, and then comparing the manual and automated results at each voxel in object space. This is approximately the ground sample distance of the Fort Hood imagery and was deemed sufficient to provide reliable quantitative evaluation. 7.2. Experimental results Our experimentation has been limited to five test areas visible in each of four images of Fort Hood. Two ot the images have near-nadir geometry, while two are oblique. The scenes contain a variety of building structures, ranging from simple flat roof and peaked roof buildings, to L-shaped structures and buildings composed of multiple rectangular volumes. The results of this experimentation are shown in the form of one test area per page, showing the four views of the test area (nadir views in the top row, oblique views in the bottom row), along with a table for each test area which gives the performance statistics described in the previous section for each of the four views. Each table is broken down into two sections; the first four numbers for each view are computed in image space using pixel overlap, and the second four numbers are computed in object space using voxel overlap. For brevity, we will only consider one test area in detail, the RADT5 scene. Figures 17 and 18 show RADT5 and RADT5S, two near-nadir views of barracks in Fort Hood. Figures 19 and 20 show two views of the same barracks at varying degrees of obliquity. Superimposed on all four images are the final results of the building extraction process, the 3D models generated in object space and projected back into image space. We first consider the image space overlap statistics in Table 1, presented in the first four columns of the table. The building detection percentages for RADT5 and RADT5OB are quite high. indicating that much of the building structure was detected. For the other two scenes, the percentages are much lower, due to failures in different processing phases. In RADT5S, the initial set of hypothesized boxes cover most buildings in the scene, but the scene is closer to the vertical vanishing point than RADT5. This fact combined with the lack of contrast leads to poor vertical finding, even with the application of the oriented line finding technique described in Section 6. 1. Hence, many of the boxes have very low computed heights, and are pruned away.
PROJECTIVE ANI) OBJECT SPACE GEOMIETRY FOR %IONOCLLAR Bt ILLIANG EXTRACTION
Figure 17: RADT5 results.
Figure 18: R\DT5S results.
M. 44/
~
tI*
47 "k
t
Figure 19: RADT50B results.
F~igure 20:
RADT5NNOi3 results.
Object space
Scee
%Bid
See
%Bd Detected
Br Factor
Miss Factor
Quality 'I
1` Bid Detected
Br Factor
Factor
[Quality c(
RADT5
84.4
0.621
0.184
55.4
41.5
2.628
1.410
19.8
RADT5S
43.3
0.446
1.312
36.3
18.4
1.632
4.445
14.1
RADT50B
84.6
0.748
0.182
-51.8
51.4
1.821
0.944
26. 2
RADT5WOB
26.4
0.621
2.793
22.7
10.9
1.835
8.7
9.
Image space
Table 1: Evaluauion statistics
I-or scene RAI)T5
MISS
____
IPROJECTIX EA IOBJECT D SP\(1- (EONIETR'
FOR MONOCUt1LAR HtUILDI)I
E\TRAC(TI(
\
1%
Figure 21:
Figure 22:
RADT60 results.
RADT6\V0 results.
______
2.825_ Q1.90t9
RADT6
26.1
RADT6S
17.5
1.809
4.718
13.3
4.5
18.962
21.256
RADT60B
31.0
2.859
2.228
16.4
9.9
8.857
0,088
R.\DT6WOB
5.7
1.425
16.401
5.3
2.4
2.254
4 0.93,7
Qu18.77t.68j.
1
Table 2: Evaluation statistics for scene Ri~m)r6
21.4 2.
PROJECTIVE AND OBJECT SPACE GEOMETRY FOR MIONOCULAR BL ILDING EXTRACTION
N4
%
'Ilk,
V
lo
n s-,-_
.,
A4
4-
&*
Nli
4: 1
It
Ajl
'
Ak
A
4
v.
1
14
.
4
tL
Figure 27:
Figure 28:
RADT90B results.
Image space
RADT9WOB reSUlts.
Object space
% Bid Detected
Br
Miss
Quality
% Bid
Br
Miss
Quality
Factor
Factor
%
Detected
Factor
Factor
c"
RADT9
64.3
0.750
0.555
43.4
41.4
3.908
1.418
15.8
RADT9S
47.8
0.701
1.093
35.8
29.7
4.877
2.370
12.1
RADT90B
53.7
0.648
0.863
39.8
26.1
1.691
.8()
8.
RADT9WOB
72.2
0.776
0.384
46.3
33.8
2.896
1.956
Scene
Table 3: Evaluation statistics for scene RADTt)
1.
Ilk~(JFCTI\I
E
/
3 ,
q~-Z
Figure 35: RADTI 1013 results.
Figure 36: RADTI IWOB results.
Image space
Object space
Scene
% Bid Detected
Br Factor
Miss Factor
Quality IT
% Bid Detected
Br Factor
M Iss FacLtor
RADTI11
3.4
16.979
28.258
2.2
2.6
46.041
36.846
1.2
RADTI IS RADT I10B
75.5 31.9
0.607 3.889
0.325 2.130
51.8 14.2
34.0 20.1
6.820 7.354
1.939 3.968
10.2 8.1
RADT1I IWOB
61.3
1.403
0.630
33.0
19.2
5.389
4.19)5
9.4
Qual ity
Table 5: Evaluation statistics for scene RADTI I In RADT5WOB, the few boxes that are correctly delineated in image space obtain good height estilniaes
PROJECTIVE AND OBJECT SPACE GEOMETRY FOR MONOCULAR BUILDING EXTRACTION
20
from the vertical line location process. In most cases, however, the boxes generated by BABE are either poorly delineated, due to missing edges along the road behind the barracks- or they are false hypotheses, formed by alignments with road horizontals and roof horizontals. The 2D verification process currently performed by BABE rejects many of the poorly delineated boxes, even though they do cover many peaked roof facets. The image space statistics reflect this performance; the miss factors for RADT5 and RADT5OB are low, indicating good performance in locating building structure. The branch factors for both of these scenes are higher, indicating that more false positive structures were hypothesized for these scenes as well. The miss factors for RADT5S and RADT5WOB show that much building structure is missed in these scenes, in the latter case, almost three times as much structure is missed than is detected. The object space overlap statistics present a similar performance picture, although the relative scores in the four metrics are noticeably worse. This is to be expected, since heights are derived from typically short vertical lines, and errors in vertical line extent on the order of a pixel can translate into height errors of a meter or more in object space. Nonetheless, the same performance trends can still be observed in object space; in RADT5 and RADT5OB, the miss factors are relatively low. The lowest miss factor is produced by RADT-OB, which illustrates the improvement in height estimation when strong verticals are present in the image at object comers. In both image space and object space evaluations, the quality scores are low, despite the good qualitative performance on RADT5 and RADT5OB. This is to be expected as well; the quality metric treats true negatives and false positives with the same weighting as true positives, and is thus very sensitive to error. From a pixel classification standpoint, such a metric may be regarded as overly harsh: in fact, if we count the number of correctly classified pixels in the image and divide by the total number of pixels in the image, we find that the four scenes have classification rates of 85% to 91%. We believe, however, that this type of classification metric is inadequate, due to its insensitivity to error. Many urban and suburban scenes are composed of small fractions of building pixels: a system that hypothesized no structure whatsoever in these scenes would receive a high classitication score, although its qualitative performance in building detection would be poor. The quality metric does not suffer from this flaw. Figures 21-36 show results for the remaining four test scenes, and Tables 2-5 present performance statistics for these scenes. Similar performance trends can be observed throughout these test areas; when vertical lines are prominent and boxes are reliably hypothesized in image space, building extraction performance is relatively good, as in RADT9WOB (Figure 28). In other cases, such as RADT6WOB (Figure 24), a combination of complex building shapes and poor contrast at building edges causes substantial difficulties for the box hypothesis mechanism, and final performance is very poor. Most of these difficulties, however, rest in the image space hypothesis generation and verification phases, which remain topics of current work. We conclude our analysis with a detailed discussion of two example buildings in the RADT5WOB and RADTII scenes, both of which exhibited poor quantitative and qualitative performance. The examples we present here show common causes of detection failures, and many of the failures seen in Figures 17-36 are due to the problems we describe below. In Section 5, we discussed the need for hypothesis verification in object space rather than in image space. The current system employs an image space shadow verification algorithm, which assumes only flat roof buildings and a nadir acquisition geometry. Although the algorithms we ha ie described often perform well when these assumptions are violated, in many situations the result is the rejection of many valid roof facet hypotheses. We turn to one such example from RADT5WOB, in which many peaked roof buildings were undetected. Figure 37 shows one of the peaked roof buildings in RADT5WOB, along with the boxes generated by BABE for this piece of image. These boxes passed the geometric consistency phase: i.e.. the labelings assigned to them by vertical and horizontal analysis were consistent with the allowable facets for building models. We will focus our analysis on boxes A and B in the picture. Figure 38 shows the boxes remaining after image space shadow verification; neither A nor B were verified.
PROJECTIVE AND OBJECT SPACE GEOMETRY FOR MONOCULAR BUILDING EXTRACTION
21
Box A failed verification because of a violation of the nadir-acquisition assumption. The image space verifier treated A as a flat roof, and examined the expected shadow casting edge for a transition from light to dark, indicating a possible shadow region. It found a lighter region on the expected shadow casting edge, and rejected A, when in fact this lighter region was a wall of the structure and was adjacent to the true shadow region. Box B failed verification in a more indirect fashion, but one which still highlights the need for true object space modeling and verification. The image space verifier computes a shadow threshold by sampling intensities near supposed shadow-casting edges for all boxes, histo~ramming these values, and adaptively selecting a threshold which cuts off at the darkest peak in the histogram. B does have the expected light to dark transition on its expected shadow-casting edge, but the intensity inside this region (which is really Box A) is not in the darkest peak of the histogram, which corresponded to shadows associated with structures which were correctly detected in RADT5WOB.
Figure 37: Initial box hypotheses.
Figure 38: Verification failure.
These examples clearly demonstrate the necessity of true three-dimensional object verification which takes into account scene geometry and illumination. In these cases, the low-level facet generation phases provided reasonable seeds for further processing, which were not exploited due to faulty assumptions in verification. In many other situations, however, the low-level facet generation algorithms are the root of detection failures. We now turn to an example in RADTI I which illustrates several low-level failures which must ultimately be addressed in future work. Figure 39 shows an L-shaped building in RADTI I, with the edges extracted for this portion of the scene. Figure-ground contrast is good for this building; however, the garage entrances on the vertical wall with upper edge C cause severe fragmentation in the edges extracted by the edge finder. Problems of this nature occur in images acquired at nadir, but they are worsened in oblique views since walls often have entrances, windows, and other textural features which can cause increased fragmentation effects. 9
Figure 40 shows the line-corner graph generated by BABE for this scene, with the only two boxes (D and E) actually generated for the underlying L-shaped structure. Other boxes generated outside the building were omitted for clarity. Given the lines seen here, BABE would be expected to generate two boxes, one for each wing of the building, since it is based on creating boxes from corners, and does not attempt to model composite shapes. Instead, even though some of the lines (notably the shadow-side lines) were extracted with little fragmentation, the box generation heuristics fail to generate boxes which comrietely
22
PROJECTIVE AND OBJECT SPACE GEOMETRY FOR MONOCULAR BUILDING EXTRACTION
cover both wings. These heuristics are designed to start at a comer in the graph and find the closest right angle in the graph to create a box. Both D and E are closed prematurely due to this heuristic. D is closed midway down the wing due to a dark feature on the ground which forms an accidental corner; E is closed immediately due to the extensive fragmentation along C, which produces many false comers. These problems, common in many test images, demand more robust heuristics and techniques for box generation, independently of the verification and object modeling problems outlined earlier.
V,
Figure 39: Fragmented edges.
'
Figure 40: Line grouping errors.
These examples illustrate the need for true three-dimensional modeling of object structure. Ideally, the generation and verification algorithms would work with three-dimensional models in object space, rather than 2D boxes in image space. This strategy would allow all feasible models to reach verification, where precise geometric information permits rigorous testing of illumination constraints across adjacent planar surfaces, prediction and verification of cast shadows 4 . and the application of stereoscopic information for consistency constraints across multiple views. Understanding these issues and the development of ligorous techniques to address these problems, as well as improving the performance of low-level hypothesis generation algorithms are the subjects of current research. 8. CONCLUSIONS AND FUTURE WORK Preliminary results from the inclusion of geometric and metric knowledge into the building extraction system have been promising, although the)y have highlighted the limitations of the current implicit building models within the BABE system. We believe that these limitations are typical of other building extraction research based upon nadir view assumptions. In the future, we expect to continue refining and validating our research on a wider set of imagery. Some specific observations regarding our work are as follows: * The height estimates for the candidate vertical lines are good refinement and information fusion cues, since the object-space measurements can be directly compared with other sources of height information. such as shadows. A next step is to incorporate precision information on the measurements into an information fusion framework to allow for relative weighting of the measurements. 9 A small catalog of structural formation constraints (Figure 6) can be a powerful tool for pruning hypotheses.
PROJECTIVE AND OBJECT SPACE GEOMETRY FOR MONOCULAR BUILDING EXTRACTION
23
o Verification of horizontal and vertical lines across multiple views can reduce the number of
hypotheses for later processing stages, thereby increasing efficiency. A future step is to perform multiple view verification of corners, which should also decrease the number of hypotheses and improve their quality. o Although BABE has been designed as a monoscopic system, the capability of precisely combining multiple views using the photogrammetric information allows the hypothesis generation and verification to take place completely in object space. These advantages derive from the ability to tie images together with rigorous camera models, especially required for oblique imagery. * The BABE model can also be extended to handle illumination constraints on the building facets (such as variation across peaked roofs of uniform material, given the sun angle), more rigorous shadow detection and verification, and stereo disparity. We note, however, that the techniques described in this work can estimate structure height in object space, without recourse to stereo analysis. Shadow information can provide another monocular estimate of structure height to refine the vertical line height estimates. We have described experiments in incorporating photogrammetric calculations in an existing building detection system, analyzed the results on a small set of nadir and oblique aerial images, and raised several issues of modeling, hypothesis generation, and hypothesis verification that must ultimately be addressed in a complete implementation of a photogrammetrically rigorous feature extractor. We have presented qualitative and quantitative results for nadir and oblique imagery which show that the combination of precise camera modeling and geometric information with existing feature extraction algorithms provides a powerful approach for increasing the performance of building detectors on complex aenal imagery. 9. ACKNOWLEDGMENTS We would like to acknowledge the efforts of Steven Cochran and Stephen Lacy in measuring the image coordinates for the resection, and Mark Stemm in particular for his perseverance in measuring resection points and all of the building points. We also wish to acknowledge Yuan Hsieh, for his efforts in developing the volumetric geometry routines used for evaluation and his suggestions for evaluation metrics, and Dave McKeown for his comments and encouragement during the course of this work. We would also like free pizza. 10. REFERENCES 1.
B. Nicolin and R. Gabler, "A knowledge-based system for the analysis of aerial images", IEEE Transactionson Geoscience and Remote Sensing, Vol. GE-25, No. 3, May 1987, pp. 317-329.
2.
A. Huertas and R. Nevatia, "Detecting buildings in aerial images", Computer Vision, Graphics, and Image Processing,Vol. 41, April 1988, pp. 131-152.
3.
R. Mohan and R. Nevatia, "Using perceptual organization to extract 3-d structures", IEEE Transactions on Pattern Analysis and Machine Intelligence, Vol. 11, No. 11, November 1989. pp. 1121-1139.
4.
R. B. Irvin and D. M. McKeown, "Methods for exploiting the relationship between buildings and their shadows in aerial imagery", IEEE Transactions on Systems. Man and Cybernetics, Vol. 19, No. 6, November 1989, pp. 1564-1575.
5.
Y.-T. Liow and T. Pavlidis, "Use of shadows for extracting buildings in aerial images". Computer Vision, Graphics,and Image Processing,Vol. 49, 1990, pp. 242-277.
6.
D. M. McKeown, "Toward automatic cartographic feature extraction", in Mapping and Spatial
Modellingfor Navigation, L. F. Pau, ed., Springer-Verlag, Berlin Heidelberg, NATO ASI Series, Vol. F 65, 1990, pp. 149-180.
PROJECTIVE AND OBJECT SPACE GEOMETRY FOR MONOCULAR BUILDING EXTRACTION
24
7.
J. Shufelt and D. M. McKeown, "Fusion of Monocular Cues to Detect Man-Made Structures in Computer Vision, Graphics and Image Processing: Image Aerial Imagery", Understanding,Vol. 57, No. 3, May 1993, pp. 307-330.
8.
A. Huertas, C. Lin, and R. Nevatia, "Detection of Buildings from Monocular Views of Aerial Scenes Using Perceptual Grouping and Shadows", Proceedings: DARPA Image Understanding Workshop, April 1993, pp. 253-260.
9.
D. M. McKeown and J. McGlone, "Integration of Photogrammetric Cues into Cartographic Feature Extraction", SPIE Conference on Integrating Photogrammetric Techniques with Scene Analysis and Machine Vision, Volume 1944, April 14-15 1993, pp. 2-15.
10.
S. Barnard, "Interpreting 435-462.
1I.
B. Brillault-O'Mahony, "High level 3D structures from a single view", Image and Vision Computing, Vol. 10, No. 7, September 1992, pp. 508-520.
12.
X. Lebegue and J. K. Aggarwal, "Detecting 3-D parallel lines for perceptual organization", Proceedingsof the European Conference on Computer Vision, 1992, pp. 720-724.
13.
C. Slama, editor, Manual of Photogrammetry,American Society of Photogrammetry, 1980.
14.
J. R. Kender, "The Gaussian Sphere: A Unifying Representation of Surface Orientation", Proceedings:DARPA Image Understanding Workshop, April 1980, pp. 157-160.
15.
J. McGlone and J. Shufelt, "Incorporating vanishing point geometry into a building extraction system", Proceedings:DARPA Image Understanding Workshop, April 1993, pp. 437-448.
16.
R. Nevatia and K. R. Babu, "Linear feature extraction and description", Computer Graphics and Image Processing,Vol. 13, July 1980, pp. 257-269.
17.
Aviad, Z., "Locating Comers in Noisy Curves by Delineating Imperfect Sequences", Tech. report CMU-CS-88-199, Carnegie-Mellon University, December 1988.
perspective images", Artificial Intelligence, Vol. 21, 1983, pp.
School of Computer Science Carnegie Mellon University Pittsburgh, PA 15213-3890
Car' .eqe Meloo' J' vie'l TVIoes "ot 0i1CrT e'aluC- a,10 Ca"'eq'e Meln or *ve5'sV :S'squired "ot to discr-nate 0)adr-Sm ss'o r e oy'onti or ad" rs:'a! on, ol ts ;'og'amns o,- the oasis o! 'ace co~o' rat-ora or' 9 ; sex 0, nantl~cao , v,.O of ittý.e v; of Toe C vý Rigots Act of 1964 Title IX of the Educa!tora: Ar-endments oil 1972 and Sectl'ý 50.1 of :'-e Retao ktat-on Act of 1973 or otiher fede'al stale or local laws. or exiciv orders in addition. Carmeqe Mellon Un~versity does not dl,scrirnnate in admlss~on erip~oyrrert or admoris1 tration of ts programs on the oasis of re'ion creed ancestry belto . age, veteran status sexual orientation or in vocation of federal, state or local !aws. or executive orders Inquiries concemrn g aop'tcat~oni of these statements should be directed to the Provost Carnegie Mellon University 5000 Forbes Avenue. Pittsburgh PA 15213 telephone (4 12) 268-6684 or the V-ce President for Enrollment. Carnegie Mellon University. 5000 Forbes Avenue. Pittsburgh. PA 15213. telephone (412) 268-2056