the behavior of two hepatic cell types involved in fibrogenesis: a liver stellate cell line (CFSC-2G) and primary ..... resembling liver sinusoids (Figure 1C).
P1: FYJ pp692-ddas-469552
DDAS.cls
June 11, 2003
10:38
C 2003) Digestive Diseases and Sciences, Vol. 48, No. 7 (July 2003), pp. 1406–1413 (°
Proliferation, Functionality, and Extracellular Matrix Production of Hepatocytes and a Liver Stellate Cell Line A Comparison Between Single Cultures and Cocultures ALEXANDRA ARNAUD, PhD,* LUIS FONTANA, PhD,† ANTONIO JOSE´ ANGULO, PhD,* ´ ´ ANGEL GIL, PhD,† and JOSE´ MAR´IA LOPEZ-PEDROSA, PhD*
Hepatic fibrosis is a common feature of many chronic liver diseases. Given the ethical considerations of studies with humans and the limited availability of liver biopsies, there is a need for in vitro models to understand the molecular events involved in hepatic fibrosis. The aim of this work was to compare the behavior of two hepatic cell types involved in fibrogenesis: a liver stellate cell line (CFSC-2G) and primary hepatocytes, both in single and mixed cultures. Cell proliferation was measured as DNA synthesis, protein content, and cell cycle study; functionality as adenylate charge, metabolic rate, and albumin content; and extracellular matrix production as type I collagen content, total collagen synthesis/degradation, metalloproteinase-13 content, and interstitial collagenase activity. Protein content and DNA synthesis were higher in CFSC-2G than in cocultures. Adenylate charge, metabolic rate, and albumin content were impaired in cocultures. Type I collagen content and total collagen synthesis were similar in CFSC-2G and cocultures. Metalloproteinase-13 content was higher in CFSC-2G and cocultures compared with hepatocytes, whereas collagenase activity was only detectable in cocultures. These results suggest that the presence of hepatocytes in the cocultures affects negatively the cell proliferation, functionality, and extracellular matrix production. Cocultures of activated CFSC-2G and healthy hepatocytes are a useful model to study fibrogenesis in vitro since various functional alterations found in this pathology are reproduced. KEY WORDS: liver stellate cells; hepatocytes; cocultures; fibrogenesis.
Hepatic fibrosis is a common feature of many chronic liver diseases. This disorder develops as a consequence of both an enhanced synthesis and a decreased degradation of extracellular matrix (ECM) components, such as collagens, fibronectin, laminin, and proteoglycans (1). It is now Manuscript received October 31, 2002; accepted March 22, 2003. From the *R&D Department, ABBOTT Laboratories, Granada, Spain; and †Department of Biochemistry and Molecular Biology, University of Granada, Granada, Spain. This work was supported by a research grant from the European Union (FEDER 1FD97-0410-ALI1) and by Abbott Laboratories. Address for reprint requests: Luis Fontana Gallego, Departamento Bioquimica y Biologia Molecular, Facultad de Farmacia, Campus de Cartuja s/n, 18071 Granada, Spain.
1406
known that the main source of ECM components are liver stellate cells (LSC) (2, 3). When the liver is injured, LSC undergo a process of activation and they differentiate into myofibroblasts. Activation of LSC is characterized mainly by the loss of lipid droplets and vitamin A, production of α-actin, and by enhanced proliferation and synthesis of ECM components (2, 3). Cooperation and signal exchange between hepatic cells are decisive factors in the fibrogenic process. Gressner and Lahme (4) proposed that the loss of cell-to-cell contacts between LSC and hepatocytes, as a result of liver cell damage, plays an important role in the proliferation and transformation of LSC. Digestive Diseases and Sciences, Vol. 48, No. 7 (July 2003)
C 2003 Plenum Publishing Corporation 0163-2116/03/0700-1406/0 °
P1: FYJ pp692-ddas-469552
DDAS.cls
June 11, 2003
10:38
LIVER CELL CULTURES AND FIBROGENESIS
Given the ethical considerations of studies with humans and the limited availability of human livers, there is a need for in vitro models of fibrogenesis. Liver cell cultures are a suitable tool for studying the metabolism of drugs and nutrients, carcinogenesis, and mechanisms of gene expression. They afford the ability to conduct long-term investigations on pure cell populations maintained in a simplified and controlled environment. However, certain specific functions of liver cells disappear after a few days in culture (5). This loss may be due to the adaptation of cells to culture conditions, which are different from those existing in vivo (e.g., interactions between cells, nutritional factors, hormones, and insoluble factors present in the ECM). For this reason, many authors have developed cocultures, in which various cell types are cultured together, in order to retain in vitro some of their physical and functional relationships observed in vivo (6, 7). In particular, Rojkind et al (8) developed a coculture system associating freshly isolated hepatocytes with an immortalized LSC line (CFSC-2G), which expresses a phenotype similar to that of freshly isolated LSC (9, 10). The characterization of this coculture included cell-to-cell contacts, the expression of liver-specific mRNAs, the production and secretion of liver-specific proteins, and ethanol-induced fibrogenesis (8, 11). However, the lack of published studies comparing the liver cell types that participate in fibrosis prompted us to design the present work, in which we compared single cultures of the cell line CFS-2G, primary cultures of hepatocytes, and cocultures of both CFSC-2G and hepatocytes. Our final goal was to ascertain whether one of these cultures could mimic the alterations in cell proliferation, cell functionality, and ECM production that are described in chronic liver disease accompanied by fibrosis. In order to achieve this goal, we studied cell viability, cell proliferation (DNA synthesis, protein content and cell cycle study), cell functionality (energy charge, metabolic rate, and albumin content), and ECM components [type I collagen content, total collagen synthesis and degradation, metalloproteinase-13 (MMP-13) content, and interstitial collagenase activity]. Our results show that the coculture of rat primary adult hepatocytes and the CFSC-2G cell line is a model that can reproduce early stages of fibrosis. MATERIALS AND METHODS Liver Stellate Cell Cultures. The rat liver stellate cell (LSC) line (CFSC-2G clone) was obtained from a carbon tetrachloridecirrhotic liver after spontaneous immortalization in culture (9). Frozen stocks of CFSC-2G were thawed and maintained in culture with minimum essential medium (MEM) supplemented with 10% fetal bovine serum (FBS) (Life-Technologies, Paisley, Scotland), 0.1% nonessential amino acids, and 1.1% penicillin/streptomycin. Confluent dishes were trypsinized as preDigestive Diseases and Sciences, Vol. 48, No. 7 (July 2003)
viously described (9), and CFSC-2G cells were seeded with a density of 1 × 10⁴ cells/cm2 . After 24 hr of plating, FBS was reduced to 0.5%, and cells were maintained in culture for 48 hr. Isolation and Culture of Hepatocytes. Hepatocytes were isolated from male Wistar rats (200–250 g) by a two-step collagenase-perfusion procedure described by Seglen (12). Hepatocytes with viability greater than 85%, determined by trypan blue exclusion, were seeded at a density of 2.7 × 10⁵ cells/cm2 in MEM supplemented with 10% FBS, 0.1% nonessential amino acids, 1.1% penicillin/streptomycin, and 5 mg/liter insulin (Sigma, St. Louis, Missouri, USA). After cell attachment (4 hr), medium was renewed with a serum-free hormonally defined medium (6), and cells were incubated for 24 hr. Cocultures of CFSC-2G and Hepatocytes. Cocultures were prepared with freshly isolated hepatocytes and the LSC clone CFSC-2G as previously described (8, 11). Briefly, 1 × 10⁴ LSC/cm2 were plated in MEM with 10% FBS, and 48 hr later, when the number of CFSC-2G had doubled, freshly isolated hepatocytes suspended in MEM containing 10% FBS and 5 mg/liter insulin were plated on top of CFSC-2G according to a 1:5 ratio (CFSC-2G:hepatocytes). Four hours after seeding, the culture medium was replaced by a serum-free hormonally defined medium (6). Cells were maintained in culture for 24 hr. Viability Assay. Cell viability was assessed by the crystal violet assay. Culture medium was discarded, and the remaining adhered cells were stained with crystal violet (0.2% in 2% ethanol) for 30 min. After this time, plates were rinsed with tap water, allowed to dry, and 1% sodium dodecyl sulfate was added to elute crystal violet. The absorbance values at 540 nm have been demonstrated to correlate to the number of remaining viable cells (13). DNA Content. Cell layers were incubated in aqueous Hoechst 33258 dissolved in 10 mM Tris, 2 M NaCl, and 1 mM EDTA, and fluorescence was measured using excitation and emission filters centered at 360 nm and 460 nm, respectively. The bisbenzimidazole derivative Hoechst 33258 exhibits fluorescence enhancement on binding to A-T-rich regions of double-stranded DNA (FluoReporter Blue Fluorometric dsDNA Quantitation Kit, Molecular Probes, Leiden, Holland). Protein Content. Cell layers were dissolved in 24.9 mM HEPES, 2.5 mM EDTA, and 0.01% Triton X-100, and total protein was determined with a dye-binding assay using an acidic solution of Coomassie Blue G-250 (BioRad, Hercules, California, USA) (14). DNA Synthesis. DNA synthesis was estimated by measuring 5-bromo-20 -deoxyuridine (BrdU) incorporation into the DNA of proliferating cells, using a colorimetric immunoassay (Roche-Molecular-Biochemicals, Indianapolis, Indiana, USA). Cells were labeled with 10 µM BrdU for 2 hr, fixed, and denatured before adding an anti-BrdU antibody conjugated with peroxidase. The immune complexes were detected by the tetramethylbenzidine reaction. The absorbance at 450 nm was directly correlated to the amount of DNA synthesis. Analysis of Cell Cycle. After trypsinization, cells were washed with PBS and resuspended in a permeabilization buffer containing 0.05% Triton X-100 and 0.1% bovine serum albumin, for 15 min at room temperature. Cell suspension was then treated with Vindelov’s solution (1.2 mg/ml Tris-base, 0.6 mg/ml sodium chloride, 0.01 mg/ml RNase, 0.05 mg/ml propidium iodide, 1 µl/ml Nonidet P-40; pH 8.0) for 15 min at room temperature and protected from light. Red
1407
P1: FYJ pp692-ddas-469552
DDAS.cls
June 11, 2003
10:38
ARNAUD ET AL fluorescence was measured in a FACSCalibur flow cytometer (Becton-Dickinson, Bedford, Massachusetts, USA) at 495 nm (excitation) and 639 nm (emission). Adenylate Charge. Intracellular nucleotide concentrations were measured by gradient RP-HPLC, following the method described by Perrett (15). Cell cultures were washed with cold phosphate-buffered saline (PBS), rapidly frozen by addition of liquid nitrogen, and scraped from the dishes into 0.1 mol/liter perchloric acid containing 0.05 mmol/liter cIMP (as an internal standard). Samples were sonicated for 30 sec and centrifuged at maximum speed for another 30 sec. Intracellular nucleotides were separated on an LC18 Supelcosyl column (3-µm particle size, 4.6 × 150 mm, Supelco). Samples were isocratically eluted at 1 ml/min with buffer A [0.2 mol/liter (NH4 )H2 PO4 in 0.1 mol/liter triethylamine, pH 6.0] for the first 6 min, at which time a 14-min linear gradient to 100% buffer B (7% acetonitrile in buffer A) was begun. Then, a linear gradient to 100% buffer A was continued until the end of the run at 25 min. Diode array detection was set at 254 nm. The amounts of intracellular nucleotides were calculated on the basis of relative response of pure nucleotide standards (AMP, ADP, ATP, Sigma) to the internal standard. The adenylate charge (Qe) was calculated using the following equation: Q e = (ATP + 1/2ADP)/(ATP + ADP + AMP) Cellular Metabolic Activity. A colorimetric assay based on the cleavage of the tetrazolium salt XTT by the mitochondrial succinate dehydrogenase (SDH) of the viable cells to a formazan dye was used (Roche-Molecular-Biochemicals). The XTT reagent was added to the cultures at a final concentration of 0.3 g/liter and incubated for 4 hr at 37◦ C. Culture medium absorbance was measured at 492 nm against a reference wavelength of 650 nm. Albumin Content. After two washes with PBS, cells were scraped off in lysis buffer (24.9 mM HEPES, 2.5 mM EDTA, 0.01% Triton X-100, 5 µg/ml leupeptin, 0.3 mM PMSF). Microtiter plates were coated with 25 ng of the cell lysate proteins in 50 mM carbonate–bicarbonate buffer, pH 9.6, overnight at 4◦ C. The unoccupied sites on the plates were blocked with a mixture of proteins obtained from the degradation of gelatin, for 1 hr at room temperature. The primary antibody, rabbit anti-rat Ig-AS albumin antibody (Biogenesis, Poole, UK) was added to each well, and incubated for 2 hr at room temperature. A secondary antibody, donkey anti-rabbit Ig horseradish peroxidase-labeled (Amersham Life Science, Buckinghamshire, UK), was added for 2 hr, followed by the substrate (o-phenylene-diamine). Three washing steps with PBS–Tween 20 were performed before each successive reagent addition. The optical densities were read at 450 nm in an iEMS Reader (Labsystems, Helsinki, Finland). Type I Collagen and Metalloproteinase-13 (MMP-13) Contents. Type I collagen and MMP-13 contents were determined in cell lysate and medium, respectively, by ELISA, as described above for albumin, using a rabbit anti-rat α1(I) collagen antibody (Dr. D. Schuppan, Free University of Berlin, Germany) and a rabbit anti-human MMP-1 antibody that cross-reacts with the MMP-13 of rat (Chemicon, Temecula, California, USA). Total Collagen Synthesis and Secretion. Collagen synthesis and secretion were assessed by the bacterial collagense digestion method of Peterkofsky et al (16). Briefly, cells were labeled with 10 µCi/ml [5-3 H] proline (100 µCi/µmol) for the last 4 hr of
1408
the culture, and free proline was removed by acid precipitation. Collagen molecules were then degraded by bacterial collagenase to acid-soluble peptides that can be separated from noncollagenous proteins (NCP). Finally, results were expressed as percentage of collagen relative to total proteins, according to the equation: %collagen = (dpm collagen) × 100/[(dpm collagen) +(dpm NCP)] Interstitial Collagenase Activity. This assay is based on the digestion of a substrate (type I collagen) labeled with fluorescein by interstitial collagenase secreted in cell medium, to yield highly fluorescent peptides. The DQ type I collagen-reagent was added to the cultures at a final concentration of 100 µg/ml) and incubated for 4 hr at room temperature, protected from light. Fluorescence intensity, proportional to proteolytic activity, was measured at 495 nm (excitation) and 515 nm (emission) (Molecular-Probes, Leiden, The Netherlands). Statistical Analysis. All results were expressed as mean ± SD. To evaluate the effect of culture type, a one-way ANOVA was performed and multiple mean comparisons were made a posteriori using the Bonferroni test. P < 0.05 was considered statistically significant.
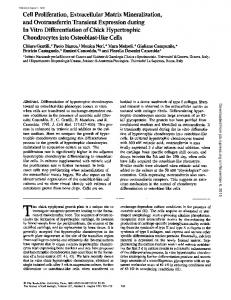
RESULTS Morphological Study. Isolated LSC continuously change their shape in culture. Two days after seeding on plastic dishes, their appearance gradually changes from dendritic to membranous, becoming fibroblast-like after 4 days (17). In the present study, we used the LSC clone CFSC-2G, obtained from the liver of a CCL4 -cirrhotic rat (10). Figure 1A shows the external morphology of these cells cultured under our experimental conditions. Figure 1B depicts the typical cuboidal morphology of primary cultures of parenchymal cells after 24 hr. In the coculture, the hepatocytes are smaller in size than those plated on plastic, maintain a cuboidal shape, and have a tendency to form cords. CFSC-2G cells, which are initially extended when plated alone, retract and leave spaces resembling liver sinusoids (Figure 1C). Cell Viability. The first step in the characterization of the three models was to determine the cell viability using the crystal violet assay (13) (Figure 2). The viability was expressed in optical density units normalized by the DNA content. The results show that the cell viability was similar in the three culture models. Cell Proliferation. Protein content of CFSC-2G cultures was 2-fold higher than those of hepatocyte cultures and cocultures (Figure 3). Moreover, the DNA synthesis of the CFSC-2G cultures was, respectively, 2.5- and 5.6-fold higher than those found in the hepatocyte cultures and the cocultures (Figure 3). Similarly, 16% of the CFSC-2G cells entered S phase, while around 98% of the Digestive Diseases and Sciences, Vol. 48, No. 7 (July 2003)
P1: FYJ pp692-ddas-469552
DDAS.cls
June 11, 2003
10:38
LIVER CELL CULTURES AND FIBROGENESIS
Fig 2. Viability of CFSC-2G, primary hepatocytes, and cocultures. Cell viability was determined by the crystal violet assay (13) (N = 10). Results are expressed in optical density units normalized by the DNA content, as mean ± SD.
exhibited the highest type I collagen content (13.47 ± 5.12 µg/mg protein), followed by the CFSC-2G cultures (8.03 ± 2.78 µg/mg protein), whereas type I collagen content was extremely low in the hepatocyte cultures (0.052 ± 0.010 µg/mg protein). These results agree with the collagen synthesis findings (Figure 6), which showed that the CFSC-2G cultures and the cocultures were the
Fig 1. Light micrographs of CFSC-2G (A), primary hepatocytes, (B) and cocultures (C). Magnification 10×.
adult hepatocytes were arrested in G0 /G1 phase after 24 hr of culture (Figure 4). Cell Functionality. The metabolic rate of CFSC-2G, measured as SDH activity, was 3-fold higher than that of both hepatocytes and cocultures (Figure 5). The energy charge, calculated using the intracellular concentrations of AMP, ADP and ATP, was about 0.8 for the hepatocyte and CFSC-2G cultures (Figure 5). However, this parameter was 0.44 in the cocultures. The hepatocyte albumin content was 2.1-fold higher than that of cocultures. ECM Production. Figure 6 shows the intracellular α1(I) collagen content of the three models. The coculture Digestive Diseases and Sciences, Vol. 48, No. 7 (July 2003)
Fig 3. Analysis of proliferation parameters in CFSC-2G, primary hepatocytes and cocultures. Protein content was measured by the Bradford method (14). Results are expressed in optical density units normalized by the DNA content, as mean ± SD (N = 10). DNA synthesis was measured as BrdU incorporation into cellular DNA. Results are expressed in optical density units normalized by the DNA content, as mean ± SD (N = 10). Means without a common letter are statistically different, P < 0.05.
1409
P1: FYJ pp692-ddas-469552
DDAS.cls
June 11, 2003
10:38
ARNAUD ET AL
Fig 4. Cell cycle study of CFSC-2G and primary hepatocytes by flow cytometry. Cell cycle was analyzed by propidium iodide (0.05 mg/ml) staining of cellular DNA (N = 5). Results are expressed as mean ± SD.
most active systems, whereas collagen synthesis in the hepatocyte cultures was very low. With regard to collagen secretion, we observed that almost all of the collagen synthesized by the CFSC-2G was secreted to the culture medium, whereas 40% of the collagen synthesized by the cocultures remained in the cell lysate (Figure 6). ECM Degradation. We found that the MMP-13 content of CFSC-2G, either cultured alone (26.11 ± 3.37 µg/mg protein) or together with hepatocytes (26.98 ± 8.37 µg/mg protein), was significantly higher than that of hepatocyte cultures (5.21 ± 1.56 µg/mg protein). However, the activity of this metalloproteinase was only detectable when CFSC-2G were co-cultured with hepatocytes (3.23 ± 0.26 mU/dish). DISCUSSION The growth of CFSC-2G is serum-dependent (10). We observed that the number of viable cells, the protein content, and the DNA synthesis of CFSC-2G were reduced 1.5-, 2.5-, and 2-fold, respectively, when cells were cultured in the presence of 0.5% FBS, in comparison with their culture in 10% FBS. Flow cytometry analysis of the cell cycle showed that the proportion of CFSC-2G in S phase was higher (27%) in the presence of 10% FBS than in 0.5% FBS (16%). These findings suggest that, under our experimental conditions, only a reduced number of these cells are able to proliferate. In the present study, CFSC2G proliferation, measured as protein content, DNA synthesis, and S-phase percentage, was higher in the single cultures than in the cocultures. Taking into account that hepatocytes are unable to undergo DNA synthesis without any stimulation from growth factors (18), these results suggest that only a very small percentage of CFSC-2G pro-
1410
liferate in the cocultures. The decreased DNA synthesis of CFSC-2G in the cocultures would be mediated by the parenchymal cells through interactions between both cell types and/or by the release of soluble factors. These results are in agreement with those of Gressner and Lahme (4), who described a reduced incorporation of [3 H] thymidine into the DNA of LSC when hepatocyte membranes were added to the culture. In this study, the metabolic rate of CFSC-2G was higher than that of both the hepatocytes and the cocultures. The mitochondrial activity of CFSC-2G could be induced in order to supply metabolic intermediates, mostly ATP, necessary for the proliferation and synthesis of ECM components. Although hepatocytes are the cells with the highest metabolic rate in the liver, they undergo a process of dedifferentiation when plated on a tissue culture plastic surface. They lose their ability to express various liverspecific genes (19), and their functional activity decreases (6, 20). However, the decreased succinate dehydrogenase activity of the hepatocytes was similar to that of the cocultures. This could be interpreted as a modulation of the mitochondrial metabolism of CFSC-2G by parenchymal cells and would be consistent with the inhibition of CFSC2G proliferation in the cocultures. In addition, the value of adenylate charge obtained in the cocultures points to an important alteration of mitochondrial functionality in this model, such as that observed in situations of hypoxia (21), anoxia (22), and malnutrition (23), where the adenylate charge has been reported to fall below 0.8. A potential cause of this low value in the cocultures is that the amount of nutrients supplied by the culture medium may not be enough to mainatin the adenylate charge throughout the 24 hr of culture, given the density of cells remaining in the dish. Accordingly, we measured the glucose and Digestive Diseases and Sciences, Vol. 48, No. 7 (July 2003)
P1: FYJ pp692-ddas-469552
DDAS.cls
June 11, 2003
10:38
LIVER CELL CULTURES AND FIBROGENESIS
Fig 5. Analysis of cell functionality of CFSC-2G, primary hepatocytes, and cocultures. Metabolic activity was determined as mitochondrial succinate dehydrogenase (SDH) activity. Results are expressed in optical density units normalized by the DNA content, as mean ± SD (N = 10). Means without a common letter are statistically different, P < 0.05. Adenylate charge was calculated according to the following formula: Q e = (ATP + 1/2ADP)/(ATP + ADP + AMP), where ATP, ADP and AMP are the intracellular concentrations of these nucleotides, measured by HPLC. Results are expressed as mean ± SD (N = 5). Means without a common letter are statistically different, P < 0.05. Albumin content was measured by ELISA. Results are expressed in namograms of albumin per 1 × 10⁶ of plated hepatocytes, as mean ± SD (N = 4). Means without a common letter are statistically different, P < 0.05.
amino acid concentrations remaining in the medium. We found the glucose concentration to be low (1/3 of initial concentration) but adequate to prevent the cells from a nutrient deficiency. It is noteworthy that concentrations of amino acids remaining in the coculture medium were Digestive Diseases and Sciences, Vol. 48, No. 7 (July 2003)
Fig 6. ECM study of CFSC-2G, primary hepatocytes, and co-cultures. Type I collagen content was measured by ELISA. Results are expressed in micrograms of type I collagen per milligram of protein, as mean ± SD (N = 4). Means without a common letter are statistically different, P < 0.05. Total collagen synthesis was quantitated in cell lysate by [5-3 H] proline (100 µCi/µmol) incorporation into collagenase-sensitive protein, for the last 4 hr of the culture. Results are expressed in percentage of collagen produced relative to total proteins per 1 × 10⁶ of cells, as mean ± SD (N = 5). Means without a common letter are statistically different, P < 0.05. Total collagen secretion was quantitated in the culture medium by [5-3 H]proline (100 µCi/µmol) incorporation into collagenase-sensitive protein, for the last 4 hr of the culture. Results are expressed in percentage of secreted collagen relative to total produced collagen, as mean ± SD (N = 5). Means without a common letter are statistically different, P < 0.05.
significantly higher than initial concentrations (data not shown). This increase could be related to the decrease of the adenylate charge in the coculture, given that transporters of amino acids are ATP-dependent (24). We suggest that the decrease in adenylate charge observed in the
1411
P1: FYJ pp692-ddas-469552
DDAS.cls
June 11, 2003
10:38
ARNAUD ET AL
cocultures is caused by alterations in the mitochondrial metabolism. The lower succinate dehydrogenase activity in the cocultures, a mitochondrial functionality marker, clearly supports this hypothesis. Krahenbuhl et al (25–27) reported a reduced oxygen consumption and a decrease in the oxidative phosphorylation in animals with experimental liver cirrhosis, related to a reduced activity of the electron transport chain. Matsui et al (28) also described that the lower energy status in the cirrhotic liver is caused by an impaired hepatocyte metabolism. Moreover, the concentration of cytochrome a(a3) in the liver increases with the severity of cirrhosis and is negatively correlated with the ATP synthesis (25–27, 29, 30). Jikko et al (31) showed that these alterations in oxidative and phosphorylative activities are associated with a decrease in the hepatic energy charge and hypothesized that this may be responsible for the decreased serum albumin level in the cirrhotic rat. Our results on the albumin content of parenchymal cells, which showed a net decrease of the albumin content in the cocultures, support this hypothesis and could also be interpreted as a modulation of parenchymal cell functionality caused by the presence of CFSC-2G in the cocultures. The excessive deposition of ECM components in fibrotic livers results from an imbalance between the synthesis and degradation of matrix proteins. Although all collagen types are increased during fibrotic processes, type I collagen is the main extracellular matrix protein that accumulates in fibrous septa (32). We observed that the highest type I collagen content was exhibited by the cocultures, followed by the CFSC-2G cultures, whereas type I collagen content was extremely low in the hepatocyte cultures. These results agree with our collagen synthesis findings, which showed that the single cultures of CFSC2G and their cocultures with hepatocytes were the most active systems, whereas the collagen synthesis in the hepatocyte cultures was very low. Even though parenchymal cells can produce collagen in vitro and in vivo (33), LSC far exceed hepatocytes in their ability to produce collagen (34, 35). In fact, it is well known that LSC are the main producers of type I collagen in normal and cirrhotic liver (3, 32). Moreover, the little collagen synthesis found in the primary cultures of hepatocytes could be from contamination by LSC (34). These findings were consistent with our results on the collagen secretion: almost all of the collagen synthesized by CFSC-2G was secreted to the culture medium, whereas 40% of the collagen synthesized by the cocultures remained in the cell lysate. This would explain why we found a greater content of α1(I) collagen in the cocultures than in CFSC-2G. In relation to these findings, Lor´eal et al (36) indicated that most of the secreted matrix proteins are present in soluble form in the
1412
conventional primary cultures of LSC and hepatocytes. In contrast, when these two cell types are co-cultured, an abundant and complex ECM is deposited around the hepatocyte cords. LSC are regarded as the major source of interstitial collagenase in the liver (37). Indeed, we observed that the MMP-13 content of CFSC-2G, either cultured alone or together with hepatocytes was higher than that of the primary cultures of hepatocytes. However, the activity of this metalloproteinase was only detectable when CFSC-2G were cocultured with hepatocytes. The MMP-13 activity would result from the production of soluble factors by the hepatocytes, which in turn would stimulate collagenase activation. This cell-to-cell interaction would play an important role in the regulation of collagen production (38). In addition, it is well documented that interstitial collagenase activity decreases as liver fibrosis progresses (39). Iredale et al (40) reported that interstitial collagenase mRNA is expressed in early cultures of LSC (