Jan 20, 2008 - In order to calculate the propagation of light with the model in equations (2.2) ..... Figure 3.4: Schematic of phase imprinting technique: (a) The desired phase ...... For a fundamental wavelength of 860 nm and 880 nm, the full external ...... [115] M. Horowitz, R. Daisy, O. Werner, and B. Fischer, âLarge thermal ...
Propagation of light in two-dimensional modulated nonlinear materials
A thesis submitted for the degree of Doctor of Philosophy of the Australian National University
Robert Fischer
January, 2008
Declaration
This thesis is an account of research undertaken in the Nonlinear Physics Centre within the Research School of Physical Sciences and Engineering at the Australian National University. Research is teamwork. None of research results presented in this thesis can be claimed as solely my own, but all projects reported on benefited from the ideas and suggestions of my supervisors and colleagues. However, unless specifically stated otherwise, the material presented within this thesis is my own and has never been previously submitted for a degree at any University or other institution of learning.
Robert Fischer January 20, 2008
Publications
Publications reporting results directly related to this thesis are typed in bold.
Journal publications 1. R. Fischer, D. Tr¨ager, D. N. Neshev, A. A. Sukhorukov, W. Krolikowski, C. Denz, and Yu. S. Kivshar, “Reduced-symmetry two-dimensional solitons in photonic lattices”; Phys. Rev. Lett. 96, 023905 (2006). Republished by Virtual Journal of Ultrafast Science, AIP (February 2006), and by Virtual Journal of Nanoscale Science & Technology, APS (January 30, 2006). 2. D. Tr¨ager, R. Fischer, D. N. Neshev, A. A. Sukhorukov, C. Denz, W. Krolikowski, and Yu. S. Kivshar, “Nonlinear Bloch modes in twodimensional photonic lattices”; Optics Express 14, 1913-1923 (2006). 3. R. Fischer, D. N. Neshev, S. Lopez-Aguayo, A. S. Desyatnikov, A. A. Sukhorukov, W. Krolikowski, and Yu. S. Kivshar “Observation of light localization in modulated Bessel optical lattices”; Optics Express 14, 2825-2830 (2006). 4. A. S. Desyatnikov, N. Sagemerten, R. Fischer, B. Terhalle, D. Tr¨ager, D. N. Neshev, A. Dreischuh, C. Denz, W. Krolikowski, and Yu. S. Kivshar, “Two-dimensional self-trapped nonlinear photonic lattices”; Optics Express 14, 2851-2863 (2006). 5. R. Fischer, D. N. Neshev, W. Krolikowski, Yu. S. Kivshar, D. Iturbe-Castillo, S. Chavez-Cerda, M. R. Meneghetti, D. P. Caetano, and J. M. Hickman, “Oblique interaction of spatial dark-soliton stripes in nonlocal media”; Optics Letters 31, 3010-3012 (2006). 6. R. Fischer, S. M. Saltiel, D. N. Neshev, W. Krolikowski, and Yu. S. Kivshar, “Broadband femtosecond frequency doubling in random media”; Appl. Phys. Lett. 89, 191105 (2006) Republished by Virtual Journal of Ultrafast Science, AIP (December 2006).
vi
7. A. A. Sukhorukov, D. N. Neshev, A. Dreischuh, R. Fischer, S. Ha, W. Krolikowski, J. Bolger, A. Mitchel, B. J. Eggleton, and Yu. S. Kivshar “Polychromatic nonlinear surface modes generated by supercontinuum light”; Optics Express 14, 11265-11270 (2006). 8. R. Fischer, D. N. Neshev, S. Lopez-Aguayo, A. S. Desyatnikov, A. A. Sukhorukov, W. Krolikowski, and Yu. S. Kivshar, “Light localization in azimuthally modulated Bessel photonic lattices”; J. Mater. Sci.-Mater. Electron. 18, S277-S283 (2007). 9. R. Fischer, D. N. Neshev, S. M. Saltiel, A. A. Sukhorukov, W. Krolikowski, and Yu. S. Kivshar, “Monitoring ultrashort pulses by transverse frequency doubling of counterpropagating pulses in random media”; Appl. Phys. Lett. 91, 031104 (2007). Republished by Virtual Journal of Ultrafast Science, AIP (August 2006). 10. B. Kibler, R. Fischer, P.-A. Lacourt, F. Courvoisier, R. Ferri`ere, L. Larger, D. N. Neshev and J. M. Dudley, “Optimised one-step compression of femtosecond fibre laser soliton pulses around 1550nm to below 30 fs in highly nonlinear fibre”; Electronics Letters 43, 20071726 (2007). 11. D. N. Neshev, A. A. Sukhorukov, A. Dreischuh, R. Fischer, S. Ha, J. Bolger, L. Bui, W. Krolikowski, B. J. Eggleton, A. Mitchell, M. W. Austin, and Yu. S. Kivshar, “Nonlinear Spectral-Spatial Control and Localization of Supercontinuum Radiation”; Phys. Rev. Lett. 99, 123901 (2007) 12. B. Kibler, R. Fischer, Go¨ery Genty, D. N. Neshev and J. M. Dudley, “Simultaneous femtosecond pulse spectral broadening and third harmonic generation in highly nonlinear fiber: experiments and numerical simulations”; submitted to App. Phys. B. 13. R. Fischer, S. M. Saltiel, D. N. Neshev, W. Krolikowski, and Yu. S. Kivshar, “Transverse second-harmonic generation from disordered nonlinear photonic structure”; submitted to Central European Journal of Physics 14. S. M. Saltiel, D. N. Neshev, R. Fischer, W. Krolikowski, A. Arie, and Yu. S. Kivshar, “Generation of the second-harmonic conical waves via nonlinear Bragg diffraction”; submitted to Phys. Rev. Lett. 15. S. M. Saltiel, D. N. Neshev, R. Fischer, W. Krolikowski, A. Arie, and Yu. S. Kivshar, “Spatiotemporal toroidal waves from transverse second-harmonic generation”; accepted for Optics Letters
Articles for the broader optics community 16. R. Fischer, D. Tr¨ager, D. N. Neshev, A. A. Sukhorukov, W. Krolikowski, C. Denz and Yu. S. Kivshar, “Molding Light in Two-Dimensional Photonic Lattices”; Optics and Photonics News, special issue “Optics in 2006”, 38 (2006).
vii
17. R. Fischer, D. Neshev, A. Sukhorukov, S. Saltiel, W. Krolikowski and Yu. Kivshar, “Managing Light in Nonlinear Disordered Media”; Optics and Photonics News, special issue “Optics in 2007”, 38 (2007). 18. A. A. Sukhorukov, D. N. Neshev, A. Dreischuh, R. Fischer, S. Ha, J. Bolger, L. Bui, W. Krolikowski, B. J. Eggleton, A. Mitchell, M. W. Austin and Yu. S. Kivshar “Trapped Supercontinuum and Multi-Color Gap Solitons”; Optics and Photonics News, special issue “Optics in 2007”, 41 (2007). 19. C. R. Rosberg, R. Fischer and A. Prasad “Optics in the Outback”; AOS News 21 (June), 11 (2007). 20. C. R. Rosberg, R. Fischer and A. Prasad “Long-Distance Learning: Teaching Optics in the Outback”; Optics and Photonics News, June, 22 (2007).
Conference proceedings 21. A. S. Desyatnikov, D. N. Neshev, R. Fischer, W. Krolikowski, N. Sagemerten, D. Tr¨ager, C. Denz, A. Dreischuh, and Yu. S. Kivshar, “Two-dimensional nonlinear optically induced photonic lattices in photorefractive crystals”; Proc. SPIE 6023, 60230H (2005) 22. R. Fischer, D. N. Neshev, W. Krolikowski, Yu. S. Kivshar, D. Iturbe-Castillo, S. Chavez-Cerda, M. R. Meneghetti, D. P. Caetano, and J. M. Hickman, “Observation of spatial phase shift in dark soliton crossing”; Proc. SPIE 6331, 633102 (2006) 23. B. Kibler, R. Fischer, P.-A. Lacourt, F. Courvoisier, R. Ferri`ere, C. Billet, D. Neshev, and J. M. Dudley, “Control and compression of extreme spectrallybroadened pulses in highly nonlinear fiber”; Proc. SPIE 6453, 64530W (2007) 24. D. N. Neshev, A. A. Sukhorukov, A. Mitchell, C. R. Rosberg, R. Fischer, A. Dreischuh, W. Z. Krolikowski, and Yu. S. Kivshar “Optical lattices as nonlinear photonic crystals”; Proc. SPIE 6604, 66041B-15 (2007). 25. R. Fischer, S. M. Saltiel, D. N. Neshev, W. Krolikowski, A. Dreischuh, and Yu. S. Kivshar, “Frequency doubling in SBN crystals with random ferroelectric domains in the thermal focusing regime”; Proc. SPIE 6604, 66041F-5 (2007). 26. R. Fischer, D. N. Neshev, S. M. Saltiel, A. A. Sukhorukov, W. Krolikowski, A. Arie, and Yu. S. Kivshar, “Pulse monitoring based on transverse SHG in periodic and disordered media”; Proc. SPIE 6801, 680110 (2008). 27. S. M. Saltiel, D. N. Neshev, W. Krolikowski, R. Fischer, A. Arie, and Yu. S. Kivshar, “Generation of conical second harmonic waves by nonlinear Bragg diffraction in two-dimensional nonlinear photonic structures”; Proc. SPIE 6801, 680113 (2008).
viii
Acknowledgments
The work presented in this thesis is the result of a team effort, and besides acknowledging their various contributions that were essential to the success of this PhD project, I want to thank and express my sincere appreciation to my supervisors and colleagues, namely Dr. Dragomir Neshev, Dr. Andrey Sukhorukov, Prof. Wieslaw Krolikowski, Prof. Solomon Saltiel, and Prof. Yuri Kivshar for sharing their knowledge, experience, ideas, and last but definitely not least their enthusiasm. Whenever practical or organisational support was needed, or questions required answers, I always found open doors and immediate help. I’m not less in debt for the support (in particular regarding the projects related to optically induced lattices) from Dr. Anton Desyatnikov, Dr. Servando L´opez-Aguayo, and Christian Romer Rosberg, and would like to express my gratitude to Prof. Alexander Dreischuh for his help in experiments as well as proof reading of this thesis. The spirit of working together as a group, where everyone brings in their own expertise for a common goal, makes the Nonlinear Physics Centre a truly unique place at which to work. For me personally, the success of my PhD project lies less in the published results than in the experience I gained and the fun I had while working with and learning from colleagues and friends in Australia and at various places around the world. I am very thankful to Prof. Yuri Kivshar for initiating these international collaborations and supporting my visits to other research groups. The warm hospitality I received from Prof. Jandir Hickmann and his group in Macei´o, in particular from my host and friend Itamar Vidal Silva de Lima and his family, remains a highlight of these years. Thanks to Dr. Bertrand Kibler and Prof. John Dudley I really enjoyed my stay in Besan¸con and benefited a lot from their experience. I am also thankful for the hospitality of Dr. Henrike Trompeter and Prof. Ulf Peschel that made Erlangen feel home for me. The excellent preparation of Prof. Ray-Kuang Lee, and the discussions with Yen-Chieh Huang made my visit at Hsin-chu a valuable experience. Another highlight of these years was to share the excitement of optics with schoolkids, including those in Australia’s remote areas, and I am grateful to Christian Romer Rosberg and Amrita Parsad for initiating and enthusiastically running this program. Thanks go also to Prof. Robert and Helen Crompton for their generous support of my travelling. Finally, I acknowledge the financial support provided by the Australian Government, the Australian National University, and the ARC Centre of Excellence Centre for Ultrahigh-bandwidth Devices for Optical Systems (CUDOS), without which I
x
would not have been able to carry out the research and obtain the results that are presented in this thesis.
Abstract
The interplay of spatial modulation and nonlinearity in an optical material provides a wealth of physical effects that shape the propagation of light as well as the result of the nonlinear processes. A clear understanding of this interaction enables us to control the involved dynamics and thus to progress in the design of systems where light signals are processed fully optically, that is at the speed of light. More specifically, in this thesis we discuss the impact of a two-dimensional modulation of optical properties in a nonlinear material on the propagation dynamics of light and related nonlinear effects. We analyse theoretically, study experimentally and then compare four nonlinear systems, each with a distinct two-dimensional modulation geometry: 1. A square lattice that is periodic in Cartesian coordinates; 2. A rotational periodic Bessel lattice; 3. An annular periodically pattern; and 4. An aperiodic, naturally disordered system. While the first two structures are based on an optically induced variation of the refractive index, the third and fourth system are based on crystalline materials where the modulation consists of a patterned (anti-parallel) orientation of the crystal domains and consequently an alternating sign of the nonlinear response. These systems feature primarily two types of nonlinearity, shaping either the profile of the light beam itself or that of the generated frequency converted light. In the case of the square and the Bessel lattice, propagating light beams experience nonlinear self-action due to a local photorefractive increase of the refractive index in regions of high optical fields. On the other hand, the latter two systems support quasi-phase-matched second-harmonic generation where the form and direction of the second-harmonic emission is determined by the phase-matching conditions that are mainly governed by structural properties.
Contents
1 Nonlinear optics in modulated materials 1.1 Scope and structure of this thesis . . . . . . . . . . . . . . . . . . . 2 Optically induced lattices 2.1 The photo-refractive effect in Strontium Barium Niobate 2.2 Waveguide coupling . . . . . . . . . . . . . . . . . . . . . 2.3 Theory and Modelling . . . . . . . . . . . . . . . . . . . 2.4 Numerical simulation of the beam propagation . . . . . . 2.5 Differences between optically induced lattices and photonic crystals . . . . . . . . . . . . . . . . . . . . 2.6 Summary . . . . . . . . . . . . . . . . . . . . . . . . . .
1 3
. . . .
6 7 10 11 13
. . . . . . . . . . . .
15 16
. . . .
. . . .
. . . .
. . . .
. . . .
3 Bloch-Floquet modes and gap solitons in an optically induced square lattice 3.1 Bloch-Floquet modes . . . . . . . . . . . . . . . . . . . . . . . . 3.2 Band structure and Bloch-Floquet modes in a square lattice . . 3.3 Experimental Bloch-Floquet mode probing . . . . . . . . . . . . 3.4 Excitation of the Bloch-Floquet modes from the first band . . . 3.4.1 Γ1 -point . . . . . . . . . . . . . . . . . . . . . . . . . . . 3.4.2 M1 -point . . . . . . . . . . . . . . . . . . . . . . . . . . . 3.4.3 X1 -point . . . . . . . . . . . . . . . . . . . . . . . . . . . 3.5 Excitation of the Bloch-Floquet modes from the second band . . 3.5.1 M2 -point . . . . . . . . . . . . . . . . . . . . . . . . . . . 3.5.2 X2 -point . . . . . . . . . . . . . . . . . . . . . . . . . . . 3.6 Reduced-symmetry gap-soliton with directed mobility properties 3.7 Conclusions from square lattices . . . . . . . . . . . . . . . . . .
. . . . . . . . . . . .
. . . . . . . . . . . .
17 18 21 24 27 27 28 29 30 31 32 34 37
4 Bessel optical lattices 4.1 Non-diffracting beams . . . . . . . . . . . . . . . 4.2 Experimental generation of Bessel lattices . . . . 4.3 Light localisation in a modulated Bessel potential 4.4 Vortices on modulated Bessel potential . . . . . . 4.5 Numerical results for the anisotropic model . . . . 4.6 Conclusion from Bessel lattices . . . . . . . . . .
. . . . . .
. . . . . .
39 41 42 43 46 47 49
. . . . . .
. . . . . .
. . . . . .
. . . . . .
. . . . . .
. . . . . .
. . . . . .
. . . . . .
Contents
xiii
5 Second-harmonic generation and phase-matching 5.1 Nonlinear polarisation of the dielectric . . . . . . . 5.2 Characteristics of the second-harmonic generation . 5.3 Birefringent phase-matching . . . . . . . . . . . . . 5.4 Phase-matching with modulated materials . . . . . 5.5 Summary . . . . . . . . . . . . . . . . . . . . . . . 6 Nonlinear Bragg diffraction and toroidal waves 6.1 Periodic poling . . . . . . . . . . . . . . . . . . . 6.2 Nonlinear Bragg diffraction . . . . . . . . . . . . 6.3 Polarisation and the χ(2) -tensor . . . . . . . . . . 6.4 Experimental observations . . . . . . . . . . . . . 6.5 Toroidal waves . . . . . . . . . . . . . . . . . . . 6.6 Conclusion from non-collinear SHG in periodically
. . . . .
51 51 52 56 57 58
. . . . . . . . . . . . . . . . . . . . . . . . . . . . . . . . . . . . . . . . . . . . . . . . . . poled structures
59 60 62 65 66 69 72
. . . . .
. . . . .
. . . . .
. . . . .
. . . . .
. . . . .
. . . . .
. . . . .
7 Second-harmonic generation in disordered nonlinear material 7.1 Domain Structure in Strontium Barium Niobate . . . . . . . . . . 7.2 SH emission in a plane, kω ⊥ z . . . . . . . . . . . . . . . . . . . . 7.3 Thermal lensing . . . . . . . . . . . . . . . . . . . . . . . . . . . . 7.4 Conical SH emission, kω k z . . . . . . . . . . . . . . . . . . . . . 7.5 A simple autocorrelator for pulse monitoring . . . . . . . . . . . . 7.6 Toroidal waves from disordered structure . . . . . . . . . . . . . . 7.7 Conclusion on phase-matching in a disordered domain structure .
. . . . . . .
8 Research summary and conclusions 8.1 Original contribution to research in this thesis . . . . . . . . . . . . 8.2 Conclusion on the interplay of two-dimensional modulation and nonlinearity . . . . . . . . . . . . . . . . . . . . . . Bibliography
74 74 80 83 86 89 93 95 97 97 98 100
xiv
Contents
CHAPTER 1
Nonlinear optics in modulated materials
Mathematically put, a nonlinear system is a system which does not satisfy the superposition principle. Expressed in a formula, the condition H(a) + H(b) = H(a + b)
(1.1)
is not fulfilled for the operator H describing the system. A bit less mathematical but therefore more intuitive might be an explanation based on a familiar example: Humans are highly nonlinear. Add one and one human entities in a closed dark room, and the result can vary from zero (tragedy) to one (usually outlawed) up to almost any finite integer number (reproduction). From this simple socio-biological analogue we can already draw two important conclusions for nonlinear systems: 1) The bases for nonlinear behaviour – not only of humans – is interaction. 2) Nonlinear systems are just more interesting than linear ones. Prior the 1960’th, the propagation of light was mostly regarded as a linear phenomena. The fact that light in free space fully satisfies the superposition principle was easily demonstrated by crossing two light beams: each beam emerges from the intersection without a trace of the encounter – they simply do not interact. Furthermore, all known experiments indicated that equally the transmission, reflection and refraction of light in transparent materials were neither affected by its intensity nor by the presence of other beams. This changed on the 16 May 1960, when T. H. Maiman presented a new light source [1] to the scientific community, named already years in advance of its first demonstration as ‘laser’. Not only was it much stronger than previously known sources, but the laser also emitted coherent photons. If two waves are stationary coherent, meaning they have the same wavelength and a fixed phase relation (relative delay between the waves), they can add up to a much stronger field, an aspect essential for nonlinear effects. The combination of power and coherence thus proved to be the key to a broad new realm of optical applications. Despite the interference, electromagnetic waves in free space would still not interact. But now due to the high field intensities available, they could change notably the properties of the material they pass through. These often very short-lived material modifications then in turn affected the propagation dynamics of the light like e.g. its speed or even could mediate between two photons so that their energy would be combined into one photon with the doubled frequency. Consequently it did not
2
Nonlinear optics in modulated materials
take long, actually not much more than a year, and the new-born field of nonlinear optics had its next major break-through: P. A. Franken and his team focused the light beam from a “commercially available ruby laser” into a quartz crystal. Out of the crystal came the original beam at the wavelength of 694 nm together with a small fraction of light at the doubled frequency. Unfortunately the world could only read about this discovery, but not see it. The “small but dense image produced by the second-harmonic” [2](figure caption) had been mistaken as a dirt spot and thoroughly removed by the diligent copy-editors of the journal. Besides this beginning, second-harmonic generation has rapidly become one of the most important application of nonlinear optics. Soon however (a few months later [3]), experiments with second-harmonic generation also had to acknowledge the ‘dark side’ of coherence. Depending on the phase of the two waves they can not only add up to stronger fields but also reduce the field intensity down to complete annihilation. In other words, the waves would either interfere constructively or destructively. Thus the same effect that provided the strong fields needed for nonlinear light-matter interaction as in second-harmonic generation, would also lead to a reduction of the generated signal when the secondharmonic waves originating from different positions along the beam path would interfere destructively – as they naturally do (see section 5.1). The fact that second-harmonic generation today is a standard tool in science and technology, gives evidence that this problem had successfully been overcome. One of the common solution resorts to an idea that had been employed in optics already for some decades before the invention of the laser, yet even millions of years by nature [4], and still today builds the base for many if not most optical devices: The effect of interference can often be controlled by a smart spatial modulation of the material properties. A simple example is the dielectric mirror consisting of alternating layers of two material with different refractive index. Depending on the angle θ to the incident ray, the layer thickness d, and the wavelength λ in the material, the reflections at the layer transitions will either interfere constructively or destructively. A complete reflection occurs if the so-called Bragg condition 2 d sin(θ) = m λ
(1.2)
is fulfilled. On the other hand, by the very same means reflection can be suppressed, as it is often done for eye glasses where a coating layer with a thickness of d = λ/4 and a refractive index which is just the square root of that of the glass enhances the contrast for the look through the glasses. This seemingly trivial example is meant to illustrate how a periodic modulation in conjunction with interference can control beam dynamics. However, in this work we will encounter the same basic mechanism at different occasions and see how it shapes the nonlinear interaction in very different optical systems. For instance, with a very similar approach it is possible to design modulation patterns that not only ensure constructive interference of generated second-harmonic waves to enhance the total frequency conversion efficiency, but also set the propagation direction of the emitted radiation and even enable us to craft its three-dimensional wave shape. If now an optical nonlinearity of the material allows the light to modify the structural
1.1 Scope and structure of this thesis
3
properties depending on the light intensity, and at the same time these structural properties determine the path light can take, we face a fascinating interplay of light, matter and modulation that builds the vivid scenery of this thesis. Besides this rather curiosity and play-instinct based motivation, there has been some more serious commercial interest in modulated nonlinear materials over the recent years. In a society that relies on the fast access to information, the desire to handle data at the speed of light is more than just an understandable wish. Where the times it takes to transmit and process an increasing amount of data determines the success of an undertaking, all-optical technologies promise to give the crucial advantage. Applications where light switches, steers, routes, regenerates, delays, or processes other optical signals all require a precisely controlled light-matter-light interaction. As the nonlinear material mediates the impact one light signal has on the other, it is usually the key element to tune the system behaviour. By designing its properties e.g. with a smart modulation geometry, many of the targeted mechanisms have already been demonstrated as a proof of concept. However, due to the currently needed high light intensities and other technical limitations, there is still a long way to go before these concepts develop to something near an optical equivalent to integrated electronic devices. Most of the research done in this field looks at planar one- or two-dimensional systems where the light propagates within the plane of modulation. One of the few exceptions are microstructured optical fibres where the light travels along a narrow waveguide surrounded by a periodically structured cladding, whereby it propagates normal to the modulation plane. However, light guided in such silicaairhole structures is usually bound to the core where the strict light confinement leads to high intensities and the associated nonlinear effects shape the light only in the temporal domain. Hence there is little to no nonlinear interaction with the spatial structure itself. In contrast, the studies and projects presented in this work focus on the spatial shaping of light propagating along two-dimensional modulated nonlinear materials. As we will see, this configuration has to offer a lot of new physical effects, some of them with a potential use in all-optical signal management.
1.1 Scope and structure of this thesis This thesis is build around one central question: How does a two-dimensional material modulation affect the nonlinear propagation of light? Certainly, a single thesis cannot give an all-encompassing answer to this question. The research presented in this work simply aims to contribute with a few specific examples to the general understanding of such systems. Each example highlights a certain aspect of the complex interplay between nonlinearity and material modulation. And the often unexpected new findings will naturally stand in the foreground of the presentation. Nonetheless, in this thesis I intend to make use of the different perspectives provided by several research projects, in order to extract some common properties and similarities of two-dimensional nonlinear systems. By pointing out such connections and relations between the observed effects, their presentation will hopefully
4
Nonlinear optics in modulated materials
chapter
ref.
2
*
3
[5,6]
4
[7]
5
*
6
[8,9]
7
[10,11]
type of nonlinearity
type of modulation
origin of modulation
geometry
photorefractive, self-focusing
refractive index
optically induced
square lattice rotational periodic
χ(2) (SHG)
* introductary chapters reviewing the nonlinear system
ferroelectric domain orientation refractive index
periodical poling grown thermally induced
annular periodic disorderd lens
Figure 1.1: Structural survey of this thesis.
mutually benefit from a broader context. It is, however, not the goal of this thesis to provide a general reference for the fundamental nonlinear effects or to reproduce what can be readily found in common textbooks. Rather, we will review the physics of the involved processes with the later discussed systems in mind and as far as necessary for a meaningful interpretation of the experimental observations. As a general guideline, the type and origin of the nonlinear effect will be introduced first, followed by the kind of material modulation and how this modulation is generated. Each structural geometry is then presented in a separate chapter where after a theoretical discussion and a definition of the experimental conditions the observations are compared to the predictions. To make the structure more transparent and to ease a fast recovery of information in the text, some keywords are highlighted in a bold font, indicating the topic of the surrounding text passage. Figure 1.1 provides a short graphical survey of the structural concept of this thesis: In the course of this work we will consider two very different types of nonlinearity, one a rather slow self-focusing nonlinearity in a photorefractive material and the other a second-order (χ(2) ) nonlinearity responsible for the already mentioned fast process of second-harmonic generation in ferroelectric crystals. While for the first type we will concentrate on the spatial development of the beam profile, in the case of the second type we will focus on the frequency conversion properties and the emission profile of the generated double frequency radiation. After an introduction to the photorefractive effect and the way it can be employed to optically write a refractive index modulation into adequate crystals, chapter 2 will discuss the theoretical and numerical tools needed to understand and
1.1 Scope and structure of this thesis
5
interpret the propagation of light in such optically induced lattices. Chapter 3 then focuses on a square lattice and shows how the propagation of photons in such a periodic index potential is related to the propagation of electrons in crystalline structures. By studying the eigenmodes of this system [5], we find an optical selftrapped state that features directed mobility properties which are particular to this two-dimensional geometry [6]. In chapter 4 we generate an optically induced lattice with rotational periodicity and study the light self-action and localisation is this geometry [7]. Since this structure is notably affected by the inherit anisotropy of the photorefractive effect, we are given the opportunity to study also the effect of anisotropy on the nonlinear propagation of light. Chapter 5 reviews briefly the origin and properties of the second-harmonic generation. As already discussed above, the effectiveness of this process depends critically on the constructive interference of the generated second-harmonic waves, a condition usually referred to as phase-matching. This chapter shows how a constructive interference can be ensured by modulating the nonlinear properties of the employed crystal. Chapter 6 presents periodical poling as a technique to achieve the required material modulation and reports on our experiments with a sample generated by this method. The annular periodic geometry leads to a conical emission of second-harmonic radiation that is governed by the nonlinear analgogue to the Bragg condition discussed earlier [8]. On the other hand, if two counterpropagating pulses meet inside this annular structure, the emitted second-harmonic wave takes the form of an expanding toroid [9]. Interestingly, the same behaviour can be observed in naturally grown crystals with disordered domain structure. Chapter 7 discusses the phase-matching in such disordered geometries and points out their benefits compared to a strictly periodic modulation [10]. Furthermore it suggest some practical application of the two-dimensional disordered mudulation for monitoring ultrashort pulses [11]. In chapter 7 we will also encounter a more complex interplay of different nonlinear effects in the context of an additional thermally induced refractive index modulation. In chapter 8 we will then close this work by drawing some common conclusion from these studies and summarising the findings and contribution of this research.
CHAPTER 2
Optically induced lattices
For many, the first interest into physics has been raised by one of these experimental kits that are specially designed for kids. It is amazing how many different effects can be demonstrated and experiments conducted with such a small set of rather simple and cheap means. Basically, with optically induced lattices we try to apply the same idea to photonic nonlinear periodical materials: They provide a simple and flexible mean to study a variety of nonlinear effects that then can be applied to other systems. Such other systems can either be experimental more challenging research subjects like e.g. Bose-Einstein condensates, or of more technical interest such as for instance micro structured highly nonlinear fibres. Optically induced lattices are based on the ability of photorefractive crystals to change locally their refractive index depending on the light intensity at that spot. Any light pattern will thus be ‘translated’ by the crystal to an index pattern. By sending two or more coherent plane waves into the crystal, the interference fringes of these beams will generate a perfectly periodic intensity distribution that in turn induces a corresponding periodic modulation of the refractive index, thus forming a periodic optical potential or lattice. The index change is not permanent, and can easily be erased by illuminating the crystal with a homogeneous light source. Afterwards, a new interference and hence index pattern can be ‘written’ into the material with the possibility to adjust the period simply by changing the angle between the beams. Many other properties of the lattice, like the depth of the index modulation or the strength of the nonlinear response can be equally conveniently controlled, e.g. by setting the light intensity or the voltage that is applied to bias the crystal. The flexibility of such a simple and fast reconfigurable lattice explains the attractiveness of this approach as an ‘experimental kit’. It builds an excellent test-bed for studies of fundamental physical phenomena in nonlinear optics. Optically induced lattices have been proposed by Efremides and his co-workers in a theoretical work [12], where the authors suggested to make use of the strong electro-optic anisotropy of the crystal: The intensity pattern predominately changes the refractive index for extraordinarily polarised light. By choosing the polarisation of the broad interfering beams ordinarily, these beams will not be affected by the index change. At the same time the light pattern induces a periodic optical potential for any extraordinarily polarised probe beam. Additionally, the extraordinarily probe beam will experience strong nonlinear self-action. The laser powers required
2.1 The photo-refractive effect in Strontium Barium Niobate
7
to observe such nonlinear effects are in the range of micro, sometimes even just nano Watts. For the experiments on optically induced lattices that are subject of this thesis, we used a Cerium doped Strontium Barium Niobate crystal (SBN:60) as the nonlinear medium. To better understand the origin, properties and limitations of the nonlinear effects and the system itself, it is essential to have a brief look at the photorefractive effect in this material.
2.1 The photo-refractive effect in Strontium Barium Niobate The photorefractive effect has been discovered in 1966 by Arthur Ashkin and his colleagues while they were trying to achieve second-harmonic generation in Lithium Niobate [13]. At first, a laser beam sent through the crystal would pass the material without any noticeable change. But after a few minutes the beam profile started to be strongly distorted – the laser light obviously had altered the optical properties of the material and produced an inhomogeneity “highly detrimental to the optics of nonlinear devices based on these crystals.” [14]. However, it turned out that the changes in the crystal could be undone by illuminating it homogeneously with a regular light source. It was known that the ability of photorefractive materials to reversibly alter the refractive index is based on the electro-optic effect: an electric field E changes the permeability of the dielectric so that the speed of light and hence the refractive index n varies depending on the strength and direction of the applied field and the material specific electro-optic coefficient r according to ∆n = −0.5n3 rE .
(2.1)
What caused Ashkins astonishment and makes this type of material especially interesting for optical applications is the fact that the light itself could induce the electric field∗ . At small distortions of the crystal, namely where a dopant atom stresses the structure, the energy of a photon can be absorbed and elevate an electron into the conduction band. This means that the electron is no longer bound to a specific location in the structure but can move freely through the crystal in any direction. This situation is schematically depicted in figure 2.1(b, left). Since more electrons are excited in the brighter parts of the crystal than in the darker, but the probability to recombine is more or less equal everywhere in the crystal, electrons will tend statistically to diffuse to the darker regions and slowly accumulate there. This diffusion process leads to space-charge fields inside the crystal between the now positive charged origin of the electrons and the consequently negative charged darker regions bordering the higher intensity [Fig. 2.1(c)]. Already A. Ashkin observed that in most birefringent crystals (including SBN) the extraordinary refractive index is much stronger affected by the electro-optic ∗
Ashkin and his colleagues where not certain about the origin of the material modification and named the electro-optic effect as the most probable source among others [14].
8
Optically induced lattices
not biased (a)
E
I
(b)
I e-
e-
e-
e-
e-
e-
(d)
e-
e-
ee-
eeee e e eee- e eeeeee-
e-
e-
e- e- eee+ e e + + e e e e- e- ee + e- e- + + e- ee e e e- e- e+
e- eee- eee e-
e- - + eee e + e + e - + e+ e e- + e+ e - + e ee
e-
e-
(c)
ee-
ee-
E
E
Δn
Δn
eee-
e-
ee-
e-
e-
e-
ee-
e-
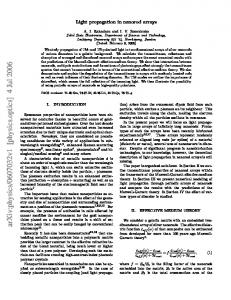
Figure 2.1: Photorefractive index modulation (left column) without and (right column) with applied external electric field E. Rows from top to bottom: (a) Light intensity distribution I(x); (b) redistribution of electrons by (left) diffusion and (right) drift; (c) optically induced space charge field; (d) refractive index modulation ∆n(x).
effect than the ordinary one, so that electromagnetic waves with the electric field orientated along the crystal c-axis, that is extraordinarily polarised light, will experience the index change significantly stronger than light with orthogonal polarisation [14]. Since the excitation of the electrons solely depends on the energy of the photons but not on their polarisation, this leads to an interesting discrimination of the propagating light: While ordinarily polarised light changes the refractive index yet is not very much affected by the change itself, extraordinarily polarised light will be influenced by the refractive index change of both the ordinary and its own
2.1 The photo-refractive effect in Strontium Barium Niobate
9
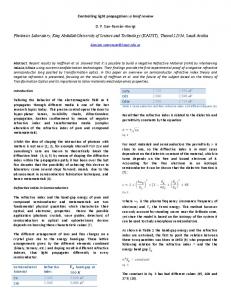
contribution to the light intensity. This distinction is of great benefit when writing a periodic pattern into the crystal. For closely situated intensity maxima of a nonlinear propagating lattice structure, the interaction forces will deform or even destroy the original pattern after a short propagation length. The parameters of the lattice and the nonlinearity have to be chosen very carefully to balance all these forces and enable a stable nonlinear propagation [15]. For ordinarily polarised lattice beams on the other hand, these forces are minimised, making it much easier to write any lattice structures into the crystal, for which the interaction has not to be taken into account in the design considerations. As long as the electrons in their new locations do not get excited back into the conductance band, the space-charge field and hence also the index modulation remains recorded in the crystal – up to days or even months. For this reason photorefractive crystals have been extensively studied as ‘re-writable’ holographic memories for all-optical data storage. This also explains why a homogeneous illumination erases the index pattern: under this condition the diffusion process will redistribute the electrons evenly so that all internal space-charge fields vanish. If the photorefractive nonlinearity is based on a statistical relocation of the electrons via diffusion, the effect will be rather slow. Things change if an external electric field is applied to the crystal [Fig. 2.1(right column)], giving the excited electrons a direction where to drift. Not only does the effect take place significantly faster and stronger, but also all the electrons will drift in the same direction – attracted by the anode [Fig. 2.1(a, right)]. As a result the inner space-charge field will shield the externally applied field for the illuminated zone and reduce the effective strength of the electric field [Fig. 2.1(b, right)]. A comparison of the index modulation ∆n(x) from the photorefractive effect with and without an external field in figure 2.1(d) makes clear that the drift dominated effect results in a more symmetric index profile. The beam in the diffusion generated index modulation will tend to the region of higher refractive index, and therefore bend away from the straight forward direction. With an external field on the other hand, the space charge field has its maxima coinciding with the intensity maxima, hence not deflecting the beam path. It has to be said, though, that figure 2.1 depicts only the one-dimensional case. For two-dimensional intensity pattern the unidirectional electron redistribution and the associated space-charge fields lead to an anisotropy in the optical induced refractive index change. Figure 2.2∗ shows how the index modulation from four incoherent collinear propagating beams build waveguides that despite equal distances in horizontal and vertical direction possess different coupling strength in these two directions. In order to make use of the largest electro-optic coefficient r33 (= 420pm/V in SBN [16]), the external field E is usually applied along the crystal c-axis. A homogeneous background illumination helps further to excite free charges and to speed up the reaction of the material. However, since there is only a finite number of electrons that can be excited from crystal impurities, the effect goes at some point ∗
Calculation done with the extended model (see section 4.5) by Bernd Terhalle and Anton S. Desyatnikov.
10
Optically induced lattices
(a)
(b)
c
Figure 2.2: Anisotropy of optical induced refractive index modulation in twodimensional systems. (a) Intensity distribution of four mutually incoherent beams (ordinarily polarised) with identical horizontal and vertical distances; (b) Induced refractive index modulation with clearly visible anisotropy and consequently different coupling strength along and perpendicular to the external field E, applied along the crystal c-axis.
into saturation for high light intensities. In general, the optically induced change of the refractive index is therefore limited to a rather small value, in SBN usually around 2 × 10⁻⁴ . Depending on the orientation of E, the refractive index in the shielded bright area will either be larger or smaller than the surrounding area. Thus a light beam can either induce an index modulation that acts like a focusing or defocusing lens, respectively, refereed to as either self-focusing (∆n > 0) or self-defocusing (∆n < 0) nonlinearity. While therefore the defocusing nonlinearity will lead to an increased beam spreading at increased intensity, the focusing nonlinearity can counteract the effect of beam diffraction. For the right combination of beam shape, light intensity and external bias it is even possible to exactly balance the diffraction with the self-focusing nonlinearity. The beam will then propagate with a constant intensity profile through the crystal and form a so-called bright spatial soliton.
2.2 Waveguide coupling Besides the nonlinear self-action of the beam, the profile development in an optically induced lattice is also strongly affected by a linear phenomenon: the coupling of light between lattice sites. The interference pattern that induces the optical potential in the crystal is aligned in such a way that the modulation profile remains stationary in one direction. In our chosen configuration, where the light travels along this structure, the lattice can therefore also be interpreted as a two-dimensional array of closely spaced adjacent waveguides. Such waveguides all have eigenmodes, each a distinct solution of the wave equation governing the system, that define the shape and speed for light waves propagating in the waveguide. If two waveguides are closely adjacent, the exponentially decaying field (the evanescent wave) of the light propagating
2.3 Theory and Modelling
11
in one waveguide can extend into its neighbouring waveguide, where it gives rise to another propagating mode. Similar to two coupled oscillators, the mode in one waveguide will transfer more and more of its energy into the other mode until finally after the so-called coupling-length the light is situated entirely on the neighbouring waveguide, or in our case lattice site. From there the light will couple again into the neighbouring sites, including the one of its origin. This power transfer between two optical waveguides has been studied in great detail and is explained by the so-called coupled-mode-theory [17]. For the scope of this thesis, however, it is sufficient to say how the coupling strength is controlled by the lattice parameters. Obviously, the process depends primarily on how far the field of a mode reaches into the next lattice site. This is determined by two factors: 1) the confinement of light on one lattice site that depends on the modulation depth of the refractive index as well as the waveguide profile, and 2) the distances between the lattice sites. The modulation depth can be set by adjusting the intensity of the lattice beam and the applied voltage on the crystal. Furthermore, due to the previously mentioned saturation it is also possible to influence the waveguide profile to a certain degree – for high light intensities the lattice site becomes more flat. The distance between the lattice sites is determined by the interference pattern and can be controlled by changing the angle between the lattice generating beams. With these factors it is possible in optically induced lattices to fine tune the spreading of a beam over the lattice sites, a behaviour often referred to as discreet diffraction. However, since the anisotropy of the photorefractive effect leads to a different index change along and perpendicular to the crystal c-axis, the coupling strength also varies for a waveguide pair depending on its orientation to the c-axis.
2.3 Theory and Modelling Although the anisotropy described above is always present, it can often be neglected for an appropriate choice of the lattice geometry [18]. Later in the context of radial symmetries we will encounter the situation where this approximation is not valid any more and the formation of the optically induced space-charge field has to be included in the model (see section 4.5). However, ignoring the anisotropy simplifies calculations drastically and since this is applicable to most geometries we consider it here a bit more in detail. Assuming an isotropic nonlinear response, the propagation of an extraordinary polarised probe beam in the presence of an optically induced lattice can be described with the well-known nonlinear Schr¨ odinger equation for the slowly varying amplitude of the electric field � 2 � ∂ E ∂ 2E ∂E +D + + F(x, y, |E|2 )E = 0, (2.2) i 2 2 ∂z ∂x ∂y where (x, y) and z are the transverse and propagation coordinates, respectively, measured in units of xs = ys = 1 µm and zs = 1 mm. For a more intuitive understanding, the equation can be broken into three parts:
12
Optically induced lattices
1. The propagation term i(∂E/∂z) describes the phase accumulation during the propagation along the z-axis. 2. The linear diffraction term covers the spreading of the probe beam, where D is the diffraction coefficient D = zs λ/(4πne xs ys ) that depends on the wavelength λ in vacuum and the linear refractive index ne of the medium for extraordinary polarised light. 3. The nonlinear term where the function F describes the refractive index modulation by the lattice and through the beam self-action depending on its intensity |E|2 . The choice of the function F determines the model of the index change for which several aspects have to be taken into account. The general type of the nonlinearity – either self-focusing or self-defocusing – and its strength is expressed in the sign and value of the nonlinear coefficient γ, respectively. The simplest (Kerr-type) model thus is F = γ|E|2 /Ib , where the background illumination Ib represents a weak homogeneous illumination of the crystal, e.g. with incoherent white light. It implies that the refractive index change increases linearly with the intensity. Although this might be a sufficiently good model for low intensities, a short look at the physical origin of the nonlinearity makes it clear that only a finite number of electrons can be moved and hence the effect at some point has to go in saturation for high intensities. Taking this into account, we make use of the so-called saturable model γ (2.3) F(x, y, |E|2 ) = − 1 + Ip (x, y)/Ib + |E|2 /Ib where the sign of the term indicates the type of nonlinearity - negative for focusing and positive for defocusing - that depends on the direction of the applied electric field E. In our experiments, the crystal was biased for focusing nonlinearity, meaning a local increase of the refractive index due to the light intensity. The strength of the nonlinearity is given by the coefficient γ = n3e r33 Eπ/λ which depends on the material properties n3e r33 reflecting the strength of the electro-optic effect, the applied electric field E and the wavelength λ. For reasons of simplicity, the intensities of the lattice Ip (x, y) and the probe beam |E|2 are measured in units of the background illumination Ib . The intensity profile of the lattice Ip (x, y) is given by the generated interference pattern and is assumed to stay constant along the propagation direction z. The use of the nonlinear Schr¨odinger equation brings in two important advantages: One is the fact that this equation describes the nonlinear behaviour of very different physical systems in very different physical contexts. As a result, the findings in one experiment can often be interpreted for other systems and have applications in sometimes seemingly unrelated environments. Optically induced lattices therefore can serve as a test bed, or – as mentioned in the introduction – as an experimental kit for nonlinear effects, paving the way for experimentally and financially more challenging studies. A prominent example are Bose-Einstein condensates where the equation (with the addition of an interaction term) is known under
2.4 Numerical simulation of the beam propagation
13
the name ‘Gross-Pitaevskii equation’. Other examples include hydrodynamics and nonlinear acoustics. Yet some of the most interesting applications are very close to our settings: The temporal evolution of a laser pulse e.g. in a fibre grating or is very similar to the transverse spatial analogue that we observe in optically induced lattices. The second advantage is that the one-dimensional nonlinear Schr¨odinger equation is integrable (for Kerr-type nonlinearity) and hence can be solved with the inverse scattering transformation [19]. Analytical solutions of this equation include the important solitons, where the effect of the diffraction is cancelled out or balanced by the nonlinear effect. The corresponding waves propagate through the material with a constant beam shape and at least in theory without the loss of energy. This might be a good place to shortly discuss the use of the term ‘soliton’ in this thesis. Strictly spoken (mathematical, that is) only the mentioned analytical solutions qualify as solitons. In real-world experiments though, even a perfectly soliton shaped beam (e.g. sech2 in bulk material) with the right intensity will loose energy and ultimately broaden. Consequently, the term has been applied to nonlinear self-trapped states that propagate with a constant beam profile over a certain distance. Usually, this distance has to extend over several diffraction lengths where the same beam propagating linearly would have significantly broadened; yet the terminology has been used rather inconsistently in literature. In the course of this thesis we will use the terminology in this latter ‘experimental’ interpretation, whereby the stability has not only to be observed in experiment but must be backed up by theoretical calculations (see e.g. section 4.5). Such light states where the beam self-action localises the energy are very important findings and have particular features in two-dimensional modulated systems that distinguish them from their one-dimensional counterparts. However, while the crystal is biased and the light propagates through the lattice, the index modulation in the material makes it experimentally impossible to get a clear view inside the crystal and so the observation is limited to the crystal front and back facet. In order to confirm the finding of a soliton and generally to get a better understanding of the physical effects that shape the beam, we need to peek inside the crystal and follow the development of the beam profile. One possibility would be to shorten the crystal by slicing off some part for every measurement (salami-technique). Since this destructive option was rather costly and cumbersome, we employ instead numerical simulations which offer us the desired insight into the beam evolution.
2.4 Numerical simulation of the beam propagation Numerically simulating the propagation of light has a number of advantages: Not only are calculations (normally) much cheaper and less alignment critical than experiments, but they also give us the possibility to observe the development of phase and intensity profile of the probe beam independently and under clearly defined conditions. By matching numerical results with experimental observations
14
Optically induced lattices
we thus gain a clearer understanding of the observed effects and at the same time can evaluate the theoretical model. Once the parameters of the numerics fit well the experimental results, we can also calculate the behaviour of the light under conditions that are not accessible in experiment, e.g. the propagation over long distances for which no crystal is available. In order to calculate the propagation of light with the model in equations (2.2) and (2.3), we need to solve the nonlinear Schr¨odinger equation numerically. The most commonly used method to do this is known as split-step method [19]. It solves the differential equation (2.2) by dividing it into two parts, the linear diffraction � 2 � ∂E ∂ E ∂ 2E = −D , (2.4) + i ∂z ∂x2 ∂y 2 and the nonlinear effect on the wave front i
∂E = −F(x, y, |E|2 )E, ∂z
(2.5)
that are calculated alternating for small discreet propagation steps of the length ∆z = h. The numerical technique requires the discretization of the light field in a complex matrix E. Naturally, both the accuracy and calculation cost (time) of this method increase together with the number of discretization points. However, by choosing it as a power of 2, parts of the calculation can be speeded up significantly, since the later employed Fast Fourier Transform benefits greatly from this fact. The nonlinear step is calculated rather easily by delaying – in the case of selffocusing nonlinearity (γ < 0) – the relative phase of the wavefront according to the beam intensity |E|2 at that each point (m, n): Em,n (z + h) = exp[ihF (x, y, |Em,n |2 )]Em,n (z)
(2.6)
The linear step on the other hand requires a bit more effort. Diffraction affects the spectral components of the beam and is therefore handled best in the frequency domain. From Fresnels diffraction theory we can derive a transfer function that determines the exact change for each spatial frequency over the propagation distance h. It is sufficient to calculate this transfer function once for all spectral components in the discrete Fourier space (u = 2π/m, v = 2π/n) and then to ‘store’ it as a matrix: � � −ihλ 2 2 (u + v ) (2.7) Du,v = exp 4πn If we now transfer the field E into the Fourier space by means of a Fourier transform F, the mathematical problem to calculate the diffraction of the beam over the propagation distance h is reduced to a mere pointwise multiplication with the matrix D: ˜ u,v (z) = F[Em,n (z)] , E (2.8) ˜ u,v (z + h) = Du,v · E ˜ u,v (z) , E
(2.9)
˜ m,n (z + h)] . Eu,v (z + h) = F−1 [E
(2.10)
2.5 Differences between optically induced lattices and photonic crystals
15
Here the last line denotes that before the next nonlinear step can be calculated, the field has to be transformed back with the inverse Fourier transform F−1 . Finally, to propagate a beam over a given distance l, the linear and the nonlinear steps have to be calculated alternating for N = l/h times. Step width h has to be chosen adequately small to avoid large phase modifications per step that give rise to numerical distortions. On the other hand, with an extremely small step width and the consequently high number of steps N the computing will accumulate numerical noise besides wasting (possibly) valuable time. A good rule of thumb is to start with a reasonably low number of steps over a fixed distance and then to increase it until the numerical results reach a steady state. It can easily be seen that the computational cost of this method lies primarily in the Fourier transform, which has to be applied twice for each of the often thousands of propagation steps. The method therefore benefits largely from the Fast Fourier Transform (FFT), for which a ready-to-use implementation is available for almost any programing platform. Although the split-step method in the presented simple version relies on a paraxial approximation and is limited to rather weak nonlinearities, it proofs very accurate and gives us valuable insight into the beam development, as will be seen in the following two chapters.
2.5 Differences between optically induced lattices and photonic crystals Optically induced lattices are regularly compared with or even referred to as photonic crystals. That might confuse some, as photonic crystals are usually understood as materials with a high refractive index contrast. In two dimensions this is often achieved by manufacturing a periodic pattern of holes in dielectric materials so that in the plane of propagation the index of the material interchanges with that of air. Compared to this index contrast of roughly 2, the index modulation that can be induced in photorefractive materials like SBN is almost four orders of magnitude smaller. Furthermore, the modulation period in photonic crystals is at the scale of the wavelength while e.g. those of the lattice structures employed in the following two chapters are about 50 times larger than the wavelength. Despite these differences, it is possible to observe similar effects in optically induced lattices as in photonic crystals. It is important to note though, that in these lattices we study the effect of the index modulation on the spatial frequencies of light beams rather than on optical frequencies as it is the case for photonic crystals (for details see section 3.1). To do so, we direct the light along the lattice structure so that the modulation is orientated in transverse direction to the wave vector, whereas the light in photonic crystals normally travels in the plane of modulation. A wellknown example for our chosen geometry may illustrate that it requires only a low index contrast: In a regular optical single-mode fibre, a Gaussian index modulation in the order of ∼ 10−3 is sufficient to completely suppress the transverse wavevector and guide the light in a stable mode.
16
Optically induced lattices
Another important difference between optically induced lattices and photonic crystals is still the issue of nonlinearity. Although many research groups worldwide are working on photonic crystals with a high nonlinearity that would make them better suitable for all-optical signal processing, such a crystal has not yet been presented to the public. Structures manufactured so far require laser powers that are unreasonably high for any practical technical application. Hopefully the progress in this field will soon make better materials available. Meanwhile, the easily accessible nonlinearity in optically induced lattices offers us a simple test bed to learn more about the fundamental physics and the potential of nonlinear periodic structures.
2.6 Summary In this chapter we briefly reviewed how a periodic index modulation can be written into a photorefractive crystal by interfering light beams. The combined effect of this optical potential and the nonlinear self-action on a probe beam can be described with the nonlinear Schr¨odinger equation, where we employ the saturable model for the nonlinear index change. Solving the same equation numerically gives us the possibility to simulate the beam propagation and thus to understand better the experimentally observed phenomena. In regards to the central topic of this thesis it is important to emphasise again the type and origin of the nonlinearity and modulation: • The photorefractive nonlinearity causes a local change of the refractive index due to the light intensity. In turn, the modified index affects the wavefront of the light and thus the beam shape. • The two-dimensional modulation is an optically induced variation of the refractive index that affects the spatial spectrum of the beam during propagation. In the following two chapters we will see how the interplay of these two aspects can reshape propagating light beams. Specifically, we will consider two different geometries, namely a square pattern and a modulated Bessel shaped lattice, the latter serving as an example for a radial symmetry.
CHAPTER 3
Bloch-Floquet modes and gap solitons in an optically induced square lattice
Periodicity has a major impact on nonlinear wave propagation. Most photonic devices rely in one way or the other on periodicity. The reason can be found in the nature of light itself: electromagnetic waves are periodic and most optical effects can be traced back to the interference phenomena, which in turn is a direct result of the periodic nature of light. In the context of this thesis it is therefore essential to analyse the consequences of periodicity for the linear and nonlinear propagation of light. Once again, a single thesis can not cover this topic in full. However, while discussing a variety of geometries for the modulation patterns we will address the question of periodicity from different viewpoints. In this chapter, we start with a strictly periodic structure, an optically induced lattice in the form of a square pattern. Periodic systems appear frequently in nature and have been studied extensively in other fields long before they raised interest in the optics community. Out of all these research areas, one particular system stood out in history, since it shaped the last century like no other: The movement of electrons in conductors and semiconductors. Physicists all over the world looked at the propagation of electrons in crystalline solids where the atoms with their electrons build a periodic potential. The insight into the laws that govern these systems allowed soon for an efficient control over the way electrons take in metals and specially designed semi-conductor structures. Felix Bloch was among the first to investigate the effect of periodicity in this context and he developed a theory describing the conduction of electrons in modes – stable states in which the electrons propagate without scattering through the material. Interestingly, the same mathematical model that Bloch used for electrons in crystals can be applied to the behaviour of photons in a periodic dielectric. As will be discussed later in this chapter, the propagation of any light beam in the optically induced lattice can be seen as superposition of modes, and thus, once the mode-structure is known the whole system is accurately described. Such modes are by definition infinitely extended in an infinite medium. Also due to financial (and technological) limitations, in experiments both lattice and probe beam are generally spatially restricted and finite, making it impossible to excite exactly one
Bloch-Floquet modes and gap solitons in an optically induced square lattice
18
single mode. In fact, by approximating the modes with a small beam that has the intensity and phase pattern of the targeted mode we will always excite a small range of closely neighbouring modes. As these modes propagate with different speed and with a small deviation in direction, the shape (transverse profile) of the probe beam changes – in contrast to a single mode that remains constant in its form. However, this effect of dispersion can be counteracted by the nonlinearity: the intensity of the probe beam can change the refractive index locally so that the material there supports a mode that is forbidden in the surrounding area. In this situation, light is either guided by total internal reflection or the divergent modes experience Braggscattering at the surrounding lattice – or both, as will be shown in section 3.6. In all these cases, the probe beam is confined or localised to the area of self-induced index change. Propagating with a minimal loss of energy, such nonlinear states can transport and even steer optical signals very efficiently. In this chapter we will discuss the concept of so-called Bloch-Floquet modes and their importance for the propagation of light in an optically induced square lattice. In experiment, we excite modes at the points of high symmetry in the lattice and study their linear and nonlinear behaviour. Focusing then on one of these modes, we demonstrate how the interplay of two-dimensional periodicity and nonlinearity leads to effects that are particular to two-dimensional nonlinear lattices.
3.1 Bloch-Floquet modes In 1928 Felix Bloch published an article on electrons in crystal lattices [20] where he discusses the wavefunction of an particle in a periodic potential. He could show that due to the periodicity it is sufficient to analyse the situation in a single crystal cell to characterise the particle behaviour for the whole crystal. The particle wave function was expressed as a plane wave multiplied by a function with the same periodicity as the underlying lattice. It turned out that these waves are in fact the eigenfunctions or eigenmodes of the periodic system, where the respective eigenvalue represents the speed of propagation. Any propagation state of electrons in the lattice can be described as the superposition of these modes, which each by itself passes through a crystalline material without scattering. In honour of this achievement with far-reaching consequences for many electronics devices today, this result is known as Bloch theorem. However, with the underlying mathematical approach Felix Bloch has been preceded by Gaston Floquet just 45 years earlier so that the actual modes are known not only as ‘Bloch modes’ but also often are referred to as Bloch-Floquet modes or waves. One of the reasons for E. Yablonovitch and S. John to coin the term ‘photonic crystals’ for periodic dielectric structures was that photons in a periodic index potential behave just like electrons in a crystal. Thus it is possible to apply the same formalism as it was developed by Bloch for electrons to characterise the propagation of light in periodically modulated materials such as optically induced lattices [21]. The Bloch-Floquet modes in two dimensions have the form E(x, y; z) = ψ(x, y) exp(iβz + ikx x + iky y),
(3.1)
3.1 Bloch-Floquet modes
19
β
k
ky
kx
Figure 3.1: Relation of the wavevector k with the propagation constant β = |β|, and kx = |kx |, ky = |ky |, the transverse components of the wavevector.
where ψ(x, y) is a complex function with the same periodicity as the underlying lattice. As we will see, the exact shape of this function differs for every set of (β, kx , ky ). It is multiplied with a plane wave whose propagation direction is given by kx and ky , the coordinates in the reciprocal lattice (in the frequency domain). The diagram in figure 3.1 illustrates the relation of β, kx , ky and the wavevector k. The phase velocity is related to β, the so-called propagation constant or mode index: The larger is the β, the smaller is the phase velocity. In this regard, the optically induced lattice – as it is discussed in this thesis – differs from the usual approach for photonic crystals: The propagation constant β = nef f 2π/λ includes both the frequency of the electromagnetic wave and the effective refractive index nef f for the mode in the modulated material. Photonic crystals usually are designed to differentiate the propagation properties of different frequencies of the electromagnetic wave, specifically to suppress certain frequencies so that they cannot propagate in the material. In contrast, in our optically induced lattices we only work with a single wavelength or ‘colour’ of light. However, the lattice differentiates spatial frequencies of a probe beam based on the effective refractive index. Mathematically, the Bloch-Floquet modes are found by solving the eigenproblem at a given point in the (spatial) frequency domain (kx , ky ) for the linearised Schr¨odinger equation [that is setting |E|2 = 0 in equation (2.2)]. Then the mode profile ψ(x, y) appears as eigenvector while the corresponding eigenvalue is the propagation constant β for this mode. The resulting dispersion relation β(kx , ky ) for a square lattice reflects the periodicity and symmetry of the lattice itself. It repeats for a translation of an integer numbers n, m of periods in the reciprocal lattice β(kx , ky ) = β(kx + n2π/dx , ky + m2π/dy ), where dx , dy represents the lattice period in x and y, respectively. It is therefore sufficient to look at the irreducible Brillouin zone, which is a single cell of the reciprocal lattices in the Fourier space, reduced by all of the symmetries (in the point group) of the lattice. The BlochFloquet modes build an orthonormal base (with the exception of the zone edges) so that any beam intensity and phase distribution can be described as a superposition or linear combination of these waves [22]. For every point in the Fourier space there are a number of discrete eigensolutions. The eingensolutions vary only little for closely situated points in the Fourier
20
Bloch-Floquet modes and gap solitons in an optically induced square lattice
space so that the eigenvalues β can be plotted as continuous surfaces against the transverse components of the wavevector (kx , ky ), building so-called bands. The shape and especially the curvature of these bands reveal much about the behaviour of light beams in the lattice. Since every physically realisable laser beam is finite in its transverse profile, it covers more than one single spatial frequency in the Fourier space. Thus, while propagating in the lattice it will excite a number of neighbouring modes, usually from the same band. If the modes that surround the central spatial frequency of the beam all have a lower eigenvalue and hence lower phase velocity 2 < 0 – the than the central one – that is a negative curvature in the band, ∂ 2 β/∂kx,y beam will broaden its spatial profile and diffract. If on the other hand the surround2 ing modes are faster – that is a positive curvature in the band, ∂ 2 β/∂kx,y > 0 – the beam experiences anomalous diffraction. Consequently, a flat band then signifies that the beam propagates with vanishing diffraction. While thus the dispersion properties are defined by the curvature of the band [22–24], the propagation direction in the lattice is determined by the normal to the band surface, and hence can differ from the direction of the wave vector of the beam, as has clearly been demonstrated e.g. in the case of anomalous refraction [24, 25].
Of particular interest are values of the propagation constant β for which no eingensolution exist in the periodic system. Such regions build gaps between the bands where no linear wave propagation is possible. Light with a wavevector in these regions does not magically disappear but is simply reflected and the wave redirected: At every change of the refractive index a small amount of the light is reflected. If the reflected light from each point in the continuously varying index modulation interferes constructively, the Bragg condition as introduced in the first chapter is fulfilled and all the energy is transferred into the reflected wave.
The impact of such gaps in the analogous case of electrons is hard to cover in a few words. Practically any semi-conductor electronic device depends directly or indirectly on the controlled crossing of these gaps by electrons (the photorefractive effect, by the way, does too). The hope to gain comparable technical benefits from photonic bandgaps is one of the main motivation for funding the research field of photonic crystals. Ironically, the pursuit is to do something ‘forbidden’: Not the crossing of the gap but the propagation within the gap is the goal. This can only be done by locally breaking the symmetry of the lattice, that is inducing a defect in the periodic structure. The light then will propagate along the defect, since it is hold by total internal reflection or by back-scattering from the surrounding structure. Thus, by controlling the defect, one has control over the flow of light. While in linear photonic crystals good quality defects require accurate design and manufacturing, in nonlinear systems such defects can be self-induced by the light beam itself.
3.2 Band structure and Bloch-Floquet modes in a square lattice
(b) Γ1
(a)
-2,0
21
Total internal reflection gap
X1 M1 COMPLETE
β
y c y
2D
BANDGAP
-2,5
X2
M2
x z
z
M Y
-3,0
X Γ
x -3,5 Γ
X
M
Γ
Figure 3.2: (a) Schematical illustration of how four interfering beams generate a two-dimensional optically-induced photonic lattice with a periodic modulation in the transverse directions (x-y plane) but a stationary profile in the longitudinal direction z. (b) Calculated dispersion bands β(kx , ky ) along the boundaries of the irreducible Brillouin zone (thick lines on inset). Dots mark the points of high symmetry.
3.2 Band structure and Bloch-Floquet modes in a square lattice As discussed in the previous chapter, the index modulation in the crystal is induced by the interference of plane waves inside the crystal. In order to generate a square pattern that is stationary along the propagation direction of the probe beam, four coherent beams are directed to overlap in the crystal as depicted in figure 3.2(a). Please note that in this experiment the main lattice axes x and y are under an angle of 45 degrees to the c-axis of the crystal. In this configuration the intrinsic anisotropy of the nonlinearity in SBN affects both axes equally and can be neglected for the intended mode probing. The four interfering beams generate an intensity pattern of the form Ip (x, y) = Ig {cos[π(x + y)/d] + cos[π(x − y)/d]}2 ,
(3.2)
where Ig stands for the modulation depth proportional to the light intensity and d is again the lattice period. Inserting this expression in the nonlinear Schr¨odinger equation � 2 � ∂ E ∂ 2E γ ∂E +D + − E = 0, (3.3) i 2 2 ∂z ∂x ∂y Ib + Ip (x, y) + |E|2 and making use of the techniques mentioned above and in the previous chapter, the properties of the system can be numerically modelled. The parameters used for numerical calculations are chosen to match the typical experimental conditions: the dimensionless variables x, y, z are normalised to the scale xs = ys = 1 µm,
Bloch-Floquet modes and gap solitons in an optically induced square lattice
22 Γ1
X1
M1
X2
M2
Intensity Intensity
Lattice
X Γ
Phase
Phase
M Y
Figure 3.3: Intensity (top) and phase (bottom) of different Bloch modes from the high symmetry points of the first and second bands of a square lattice. The blue color for the phase distribution corresponds to the zero phase, while the red color corresponds to the π phase.
and zs = 1 mm, respectively; the diffraction coefficient is D = zs λ/(4πne x2s ), where ne = 2.35 is the extraordinary refractive index of SBN, and λ = 532 nm is the laser wavelength in vacuum; the nonlinear coefficient γ = 2.36 is proportional to the electro-optic coefficient and the applied electric field E; and the intensities are normalised to the background illumination Ib . The lattice modulation and scale are given by the amplitude Ig = 0.49, and the lattice period of d = 23 µm, respectively. The values for γ and Ig have been found by matching numerical simulations with experimental measurements. Based on these parameters, the Bloch-Floquet modes of the system can be found as its eigensolutions. For the band diagram in figure 3.2(b), the propagation constant β for the first four bands is plotted along the boundary of the irreducible Brillouin zone (marked as thick lines in the inset). The scan passes the highsymmetry points of the lattice (marked by red dots): Γ at the centre of the Brillouin zone, where the wave-vector is directed exactly along the z-axis of the lattice; X at the centre of a face (kx , ky ) = (π/d, 0); and M at the edge of the Brillouin zone (kx , ky ) = (π/d, π/d). Remarkably, although the induced index contrast is very low – approximately 2 × 10⁻⁴ – a full two-dimensional gap exists between the first and second band. In figure 3.3 the calculated complex eigenvectors are depicted for the points of high-symmetry. The upper row shows the intensity profile of the Bloch-Floquet waves and the bottom row shows the corresponding phase structure (with blue = 0 and red = π phase). As a reference, the first column shows the light intensity of the lattice itself. The intensity distribution of the Bloch-Floquet modes from the first band all reflect the structure of the square lattice, with the intensity maxima coinciding with those of the lattice. However, their phase structure differs substantially. As can be seen from Fig. 3.3, the phase of the two-dimensional Bloch-Floquet waves originating from the Γ1 point is plain or constant, while those from the X1 and M1 points vary with the same periodicity as the lattice. More specifically, at the
3.2 Band structure and Bloch-Floquet modes in a square lattice
23
X1 point the phase structure has a stripe-like pattern, with the phase alternating between 0 and π along the x-axis yet being constant along the transverse direction. The intensity and phase structure at the Y1 point is fully symmetric to that at X1 point – just rotated by 90 degrees – so that the phase of this mode is alternating along the y-axis. For the Bloch-Floquet waves originating from the M1 point the phase distribution resembles a chessboard pattern. On the other hand, the two-dimensional Bloch-Floquet modes from the second spectral band have the intensity maxima centred between the maxima of the square lattice. The phase structures have the form of stripes oriented along the y-axis for the X2 point, or in 45 degrees with respect to the principal axes for the M2 point. From the diagram in figure 3.2 we conclude that the Γ2 point is highly degenerated with the propagation constants being nearly the same for the second, third, and fourth bands. Differences in the phase structure of these two-dimensional Bloch-Floquet waves translate into differences in the propagation dynamics of corresponding beams with a finite width. A plain phase as for the Γ1 point indicates isotropic propagation properties and a beam diffraction based on coupling between the lattices sites. On the other hand, an alternating phase is a signature of strong Bragg scattering, that may lead to an enhanced diffraction of beams along the direction of phasemodulation, similar to the effect of the dispersion enhancement in fibre Bragg gratings [26]. Beams with an anisotropic phase structure of the corresponding BlochFloquet wave can therefore be expected to experience anisotropic diffraction or beam shaping. The diffraction is further affected by the nonlinearity: by increasing the probe beam intensity the refractive index will locally change and deform the band structure. In our case of a medium with self-focusing nonlinearity, this will result in either a focusing or defocusing effect on the output beam, depending on whether the curvature of the dispersion surface is negative or positive, respectively. The sign of the curvature can therefore be identified experimentally utilising the nonlinear self-action of the beam. A close examination of the spatial dispersion defined by the bandgap spectrum of the lattice [Fig. 3.2(b)] shows that the beams associated with the Γ1 and X2 points will experience self-focusing in both (x, y) directions due to the negative band curvature along the kx - and ky -axis. On the other hand, the beams associated with the M1 point will experience nonlinear self-spreading due to the positive curvature at the corresponding point of the dispersion surface. At the X1 point the band diagram in figure 3.2(b) follows the 90 degree corner of the irreducible Brillouin zone, so that the positive curvature on the left side in the diagram indicates a positive curvature of the band surface along the kx -axis while the right side indicates a negative curvature of the surface along the ky direction. Probe beams at the X1 point will therefore experience an anisotropic nonlinear response: focusing along the direction of the constant phase and at the same time self-defocusing in the orthogonal direction. An interesting behaviour is to be expected for beams at the M2 symmetry point. The dispersion curves of the second and the third band nearly coincide, with both bands having opposite but isotropic curvatures. Due to this degeneracy, the nonlinear self-action of beams associated
Bloch-Floquet modes and gap solitons in an optically induced square lattice
24
(a)
(b)
Phase dist.
Blaze
Intensity dist.
PPM surface
PPM surface
Figure 3.4: Schematic of phase imprinting technique: (a) The desired phase pattern is added to a Blaze grating that has been multiplied with the aimed intensity distribution. The resulting matrix – modulo the maximum modulation depth supported by the device of 2π – is then send to the programmable phase modulator (PPM). (b) Plane waves that are reflected into the first order of the Blaze grating carry the phase imprint. From areas without the Blaze grating, no light is directed in the first order.
with this mode will result in rather complex beam dynamics.
3.3 Experimental Bloch-Floquet mode probing According to the importance of Bloch-Floquet modes, a number of techniques have been developed to measure them directly in experiment for different optical periodic systems: The Bloch-wave character of electromagnetic waves in photonic crystal waveguides has been deduced indirectly by detecting the out-of-plane leakage of light [27], by investigating the evanescent field coupling between a tapered optical fiber and a photonic crystal waveguide [28], and even more directly by local near-field probing of the intensity distribution in a waveguide [29]. The full band structure of a photonic crystal waveguide has been recovered very recently by employing a near-field optical microscope and probing both the local phase and amplitude of the light propagating through a single-line defect waveguide [30, 31]. The properties of the Bloch-Floquet modes of nonlinear periodic structures have been extensively studied in one-dimensional geometries, including Bragg gratings and waveguide arrays [32, 33], as well as in the context of modulational instability of one-dimensional waves [34–39]. In parallel to the experiments presented in this thesis, the Brillouin zone structure of a nonlinear two-dimensional photonic lattice was characterised by another research group. They based their analysis on the features of collective wave dynamics for partially coherent multi-band excitations [40]. In this study however, where we focus on the effect of the two-dimensional modulation on the linear and nonlinear propagation of light, the exclusive excitation of particular Bloch-Floquet modes is necessary. According to Bloch’s theorem, observing the behaviour of representative modes will then lead to a better understanding
3.3 Experimental Bloch-Floquet mode probing
25
of the system itself. We therefore choose the Bloch-Floquet waves discussed above to probe the lattice experimentally. Exciting a single mode is not trivial, since both intensity and phase profile of the probe beam have to match accurately the corresponding Bloch-Floquet wave, and the positioning on the lattice is crucial. In order to gain information about the band curvature it is necessary to excite a small spectrum in the vicinity of the mode, what is done by reducing the beam width as far as possible while conserving the characteristics of the complex mode profile. With the observed linear diffraction and change of the beam profile due to nonlinear self-action we then will gain a clear picture of the system. To engineer the probe beam, we use the phase-imprinting technique where we direct a relative broad laser beam [ca. 20 mm full width at half maximum (FWHM)] onto the reflective surface of a programmable spatial light modulator (Hamamatsu X8267). This modulator is designed to either control the intensity or phase of the reflected beam. In our setup we employ it as a programmable phase modulator (PPM): The reflective surface is divided into 768 × 768 separately addressable pixels (quadratic, ca. 26 µm edge length) with controllable thickness what results in a spatially controllable phase delay in the reflected beam. By applying a periodic grating with a slanted cross-sectional profile – known as Blaze grating – it is possible to concentrate most of the energy e.g. in the (plus) first diffraction order. As depicted in figure 3.4(a), the Blaze is multiplied with a binary function according the aimed spatial intensity distribution whereupon the desired phase profile is simply added and the resulting matrix send to the modulator. The part of the beam that is directed in the first order then will carry the phase imprint as shown in figure 3.4(b). The reflected beam is send through a telescope that performs two tasks: 1) By choosing the ratio between the focal lengths of the two lenses it scales the probe beam to the proper size. 2) In the focal plane of the telescope an aperture plate filters out the (plus) first order. Due to the filtering in the Fourier space only the light with the desired phase and intensity distribution will be imaged onto the crystal front face where it enters the lattice structure. Such a controlled optical shaping of the probe beam allows to approximate the aimed Bloch-Floquet mode sufficiently close so that the beam then is molded into the (energetically preferable) precise wave form by the lattice itself. The same technique of Fourier filtering is applied to the four lattice generating beams: A collimated broad beam passes through an amplitude mask in the form of a fine chessboard pattern, followed by a telescope that images it into the crystal. In the focal plane of the telescope, the Fourier transform of the chessboard pattern appears as two orthogonally oriented pairs of beams that are filtered out by an aperture. Actually, as the filtered pattern is the Fourier transform of the square lattice, the positions of the four beams in the focal plane directly mark the corners of its (first) Brillouin zone. Analogue to the case of the probe beam, the magnification factor of the telescope can be adjusted to generate the desired period, while a strict afocal imaging ensures that the interference pattern and period stays constant along the propagation direction z. The Talbot effect that would lead to a modulation in z is suppressed by filtering out the zeroth order from the Fourier spectrum. The full experimental setup is shown schematically in figure 3.5. An optical
26
Bloch-Floquet modes and gap solitons in an optically induced square lattice
Figure 3.5: Experimental setup for the excitation of two-dimensional BlochFloquet modes: λ/2 – half wave plate, PBS – polarising beam splitter, L – lens, PPM – programmable phase modulator, FF – Fourier filter mask, DOE – diffractive optical element to produce four coherent beams, SBN:60 – photorefractive crystal, HV – high voltage, Pol – rotatable polariser, CCD – camera. Green and red lines signify ordinary and extraordinary polarisation, respectively. Left: schematic illustrating the configuration of lattice and probe beams. The electric field is applied along the crystal c-axis.
beam from a continuous wave frequency doubled Nd:YVO4 laser at the wavelength of 532 nm is split by a polarising beam splitter into two beams with orthogonal polarisations. A λ/2 plate before the beam splitter allows to control the distribution of power between the two arms. The ordinarily polarised beam (green in Fig. 3.5) is used to generate the lattice beams and passes through the amplitude mask and a telescope with the previously described Fourier filtering. The resulting four coherent beams interfere with a period of 23 µm in a Cerium doped SBN:60 crystal with the dimensions 20 mm × 5 mm × 5 mm. The crystal is biased externally along the c-axis with an electric field of 4 kV/cm. Due to the strong anisotropy of the electro-optic effect in this material, the ordinary polarised lattice beams propagate linearly inside the crystal, practically unaffected by the refractive index modulation they induce for the probe beam. The second, extraordinary polarised laser beam is expanded by a telescope and directed on the active area of the PPM. The first diffraction order of the reflected beam is filtered out in the focal plane of a second telescope that also images the optically shaped probe beam with a magnification factor of ca. 1/16 onto the crystal front facet. While propagating inside the crystal, the extraordinary polarised probe beam experiences the optical potential of the lattice as well as nonlinear self-action due to the photorefractive nonlinearity. The input and output facet of the crystal can be imaged on a CCD camera to capture the beam intensity distribution, while a polariser allows to record selectively either the lattice or the probe beam profile. As explained earlier, the crystal front facet can only be seen clearly as long as no voltage is applied to the crystal, since the induced refractive index modulation will also distort the imaging. For the same reason it is not possible to observe
3.4 Excitation of the Bloch-Floquet modes from the first band
(a)
(b)
(c)
(d)
27
(e)
M Y
X
50 µm
Γ
y
x
Figure 3.6: Experimental data (top row) and numerical results (bottom) for the excitation of the two-dimensional Bloch waves from the Γ point of the first spectral band. (a) Input beam; (b-e) outputs for the input powers of 25 nW, 125 nW, 250 nW, and 375 nW, respectively.
the development of the probe beam profile inside the optical lattice. We therefore complement the experimental results with numerical simulations that allow us to ‘peek’ into the crystal as we can easily trace the evolution of the intensity and phase profile during propagation. Furthermore, the comparison between the numerical calculated results and the experimental measurements enables us to evaluate our theoretical model. Equipped like this we analyse the Bloch-Floquet modes of the square lattice at the points of high symmetry at the first and second band by probing them experimentally and comparing the measurements with the theoretical predictions and numerical simulations. The outcome for the different modes are shown in figures 3.6 to 3.10 where each top row shows the experimental measurements and the bottom row the corresponding numerical results. The input profile can be seen in the first column while the columns to the right depict the beam intensity at the output facet of the crystal and the numerical calculated beam profile after 20 mm propagation (the crystal length) for an increasing probe beam intensity.
3.4 Excitation of the Bloch-Floquet modes from the first band The Bloch-Floquet waves from the first diffraction band all have in common that their intensity maxima coincide with the lattice maxima, which are also the regions of maximal refractive index. However, the differences in the phase structure and band curvature at the edges of the irreducible Brillouin zone (Γ1 , M1 and X1 ) indicate a strong variation in the dispersion properties.
3.4.1 Γ1 -point According to the plain phase of the Bloch-Floquet mode at the Γ point of the first band (see Fig. 3.3), this mode can be simply excited by launching a plane wave
Bloch-Floquet modes and gap solitons in an optically induced square lattice
28
in form of a Gaussian beam along the lattice z-axis. For our numerical simulations the beam is describes as E(x, y) = A exp(x2 /wx2 + y 2 /wy2 ), where A is the amplitude, and wx , wy are the corresponding beam widths along the x and y axes, respectively. In experiment, a beam size of wx = wy = 18 µm was chosen to cover approximately one lattice site [Fig. 3.6(a), top] and the beam was centred on the lattice maxima. Since the mode has the same symmetry as the underlying lattice we can expect an equal diffraction along the two principal axes of the lattice. And indeed, for a linear propagation at low power (25 nW) the beam experiences strong discrete diffraction while most of its energy is symmetrically transferred or coupled away from the centre to the outside lobes [Fig. 3.6(b)]. At the Γ1 point, the first band touches the total internal reflection gap. By increasing the probe beam intensity, the refractive index at the lattice site of the beam position will increase due to the self-focusing nonlinearity. This increases also the propagation constant β of the beam and thus shifts it into the gap. The beam then gets localised along the self-induced defect where it is guided by total internal reflection and forms a discrete lattice soliton [41, 42]. The linear diffraction pattern together with the formation of a discrete lattice soliton give a good measure for the nonlinear strength and modulation depth of the optically induced lattice. In fact, the values for the nonlinear coefficient γ and the lattice modulation amplitude Ig are calibrated on matching the numerical results for the Γ1 point with the experimental measurements and then are used for all further numerical simulations.
3.4.2 M1 -point The band curvature at the M1 symmetry point at the corner of the Brillouin zone is symmetrical negative in both the kx and ky direction [Fig. 3.2(b)], leading to symmetric but anomalous diffraction. Therefore the initial beam is expected to exhibit enhanced defocusing at increasing beam power. The mode at this point too touches a bandgap, but since the self-focusing nonlinearity increases the propagation constant of the beam, higher intensities will shift it away from the gap (in selfdefocusing nonlinearity this mode would shift into the gap and localise on a selfinduced defect). To match the Bloch-Floquet wave profile, the input beam is modulated in numerics in the form E(x, y) = A cos(x π/d) cos(y π/d) exp(x2 /wx2 + y 2 /wy2 ), with a round beam profile of wx = wy = 51 µm width [Fig. 3.7(a)]. The intensity profile consists of humps on the lattice sites, separated by zero-intensity lines that are the direct result of the π phase jumps in the mode structure (Fig. 3.3). The predicted symmetric dispersion is confirmed by our experimental measurements that are depicted in figure 3.7(b-e)(top). At low laser powers (P = 40 nW)
3.4 Excitation of the Bloch-Floquet modes from the first band
(a)
(b)
(c)
(d)
29
(e)
M Y
X
50 µm
Γ
y
x
Figure 3.7: Experimental data (top row) and numerical results (bottom) for the excitation of the two-dimensional Bloch waves from the M point of the first spectral band. (a) Input beam; (b-e) outputs for input powers of 40 nW, 125 nW, 300 nW, and 850 nW, respectively.
the beam experiences rather weak linear diffraction. With increasing power [Fig. 3.7 (c-e) at power levels 125 nW, 300 nW, and 850 nW, respectively] the beam defocuses and forms a square type pattern [Fig. 3.7(e)(top)] that matches very well the numerical calculated beam profile [Fig. 3.7(e)(bottom)].
3.4.3 X1 -point In contrast to the M1 symmetry point, the dispersion properties at the X1 point are highly anisotropic for two reasons: 1) The curvature of the band surface is negative along the kx -axis yet positive along the ky -axis [Fig. 3.2(b)]. Nonlinear propagating beams will therefore experience focusing along the y-axis and at the same time self-defocusing in the orthogonal direction. 2) While the phase profile is constant in y direction, the alternating phase along the x-axis enhances Bragg scattering leading to a stronger beam broadening along this axis. At the experimental mode probing, we accounted for this effect by choosing an elliptical beam shape that is elongated along the x-axis. The larger beam profile in x direction leads to a smaller diffraction in this direction compared to the diffraction in y direction, so that the diffraction along both axes can be balanced. In experiment, the imprinted phase profile is constant along the y direction and alternates by π along the perpendicular x direction. This stripe-structure is then launched ‘onsite’, so that the intensity maxima are placed on the lattice sites. For numerical calculations, the input profile is modelled by the following expression [Fig. 3.8(a)] E(x, y) = A cos(x π/d) exp(x2 /wx2 + y 2 /wy2 ), where wx = 100 µm and wy = 33 µm set the width of the elliptically shaped beam. Both experimental and numerical results agree well on the predicted nonlinear behaviour: At low laser powers, the initial beam spreads strongly in x direction yet negligible along the y direction [Fig. 3.8(b)]. Increasing the beam power leads to focusing of the beam along y direction and simultaneous beam spreading along x axis [Fig. 3.8(c)]. This nonlinear response of the mode could be employed to induce
Bloch-Floquet modes and gap solitons in an optically induced square lattice
30
(a)
(b)
(c)
M Y
X
50 µm
Γ
y
x
Figure 3.8: Experimental data (top row) and numerical results (bottom) for the excitation of the two-dimensional Bloch waves from the X point of the first spectral band. (a) Input beam; (b,c) outputs for input powers of 25 nW and 375 nW, respectively.
line-like defects in the lattice that can act as waveguides to direct other beams along the principal axes.
3.5 Excitation of the Bloch-Floquet modes from the second band The intensity distribution for the modes from the second band are more complex than those from the first band. Although it was not possible to match them exactly with the available technical means, the approximated shapes were close to the actual mode profiles, so that during propagation the beam would develop into the calculated Bloch-Floquet wave. A comparison of the output for linear propagation in figure 3.9(b) and 3.10(b) with the Bloch-Floquet mode shown in figure 3.3 for the M2 and X2 symmetry point, respectively, gives experimental reassurance that the calculated eigenvectors of the modelled system indeed represent the ‘preferable’ states of the optically induced lattice - the additional excited higher order modes diffract strongly during propagation so that the second band mode dominates the output profile. The surface of the second band is separated from the first band by a complete two-dimensional photonic gap. While the first band thus is isolated from the others, the second band touches (or more precisely: comes very close to) the third band in the M2 symmetry point and even seems to overlap with the third and fourth band in the Γ2 point, leading to degeneracy of the two-dimensional Bloch-Floquet modes and subsequently complex beam dynamics. The behaviour of light beams at this points are reproducible in numerical simulations and experiments yet difficult to interpret. Out of these two degenerate points, we therefore consider only the M2 symmetry point. A particular interesting beam behaviour is found at the X2 symmetry point where the second band touches the bandgap. Although the situation resembles that at the Γ1 point, the two-dimensional nature of the system has a major impact on the properties of nonlinear propagating beams in that mode that clearly distinguishes it from related one-dimensional effects.
3.5 Excitation of the Bloch-Floquet modes from the second band
(a)
(b)
(c)
(d)
31
(e)
M Y
X
50 µm
Γ
y
x
Figure 3.9: Experimental data (top row) and numerical results (bottom row) for the excitation of the two-dimensional Bloch waves from the M point of the second spectral band. (a) Input beam; (b-e) outputs for input powers of 25 nW, 90 nW, 270 nW, and 660 nW, respectively.
3.5.1 M2 -point A close examination of the band structure at the M symmetry point in the diagram 3.2(b) reveals that the second and third eigenvalue do differ, although the difference is very small. As a result, the corresponding Bloch-Floquet waves of the second and third band will be excited simultaneously and the observed intensity distribution will be a superposition of the copropagating modes. Since the curvatures of the two surfaces have opposing signs, we expect a rather complex nonlinear beam shaping. The resolution limitation of the implemented phase imprinting technique does not allow one to design the probe beam exactly matching the calculated mode profile. It is therefore approximated by a horizontal stripe pattern oriented at a 45 degree angle with respect to the principal axes of the lattice. The zero-intensity lines are again the result of π phase jumps according to the mode profile [Fig. 3.3 (M2, bottom)]. In contrast to the modes of the first band, the intensity maxima of the second band lie between the maxima of the lattice. For the numerical simulations, we used a round Gaussian beam modulated in the form E(x, y) = A cos [(x − d/2) π/d + (y − d/2) π/d] exp(x2 /wx2 + y 2 /wy2 ), and a width of wx = wy = 38 µm [Fig. 3.9(a)]. The elliptical beam form in the experiment was not intended and is the result of a sub-optimal Fourier filtering mask. At low power, when the probe beam is propagating linear in the lattice, the diffraction leads to the pattern at the crystal output as shown in figure 3.9(b). At higher powers the nonlinear self-action results in a strong beam reshaping as can be seen in (c) for 90 nW, (d) 270 nW and (e) 660 nW, respectively. While the central part of the beam experiences self-defocusing, the intensity in the outer region increases. The asymmetry of this pattern reflects the asymmetric curvature of both the second and the third band at the M point. We find again the numerical simulation in a very good agreement with the experimental results [Fig. 3.9, bottom row].
Bloch-Floquet modes and gap solitons in an optically induced square lattice
32
(a)
(b)
(c)
(d)
(e)
M Y
X
50 µm
Γ
y
x
Figure 3.10: Experimental data (top row) and numerical results (bottom row) for the excitation of the two-dimensional Bloch waves from the X point of the second spectral band. (a) Input beam; (b-e) outputs for input powers of 10 nW, 60 nW, 100 nW, and 230 nW, respectively.
3.5.2 X2 -point The second band at the X point has an almost identical phase structure compared to the Bloch-Floquet mode of the first band. A major difference though is a shift of exactly half a lattice period along the x-axis, so that the π phase jumps are situated on top of the lattice maxima, resulting in the characteristic double-peak structure in the intensity pattern of this mode. The band curvature is asymmetric, just like that of the first band, yet negative in all directions of the Fourier space. The combination of the anisotropic phase structure and band curvature leads to a strong difference of the dispersion properties in x and y direction. In experiment and for numerical simulations, we approximate the Bloch-Floquet wave at the X2 point with the same beam shape as for the X1 point, but this time shifted half a period relative to the lattice: E(x, y) = A cos[(x − d/2) π/d] exp(x2 /wx2 + y 2 /wy2 ), Just as for the X1 point, the beam shape is chosen to be elliptical – in order to balance the effect of anisotropic diffraction – with a width of wx = 100 µm along the direction of alternating phase and wy = 33 µm in direction of constant phase. The expected double-peak structure of the calculated Bloch-Floquet wave [Fig. 3.3(X2)] can be clearly seen in the experiment. At low laser powers (20 nW) the beam diffracts linearly and is molded into the predicted mode shape [Fig. 3.10(b)]. To emphasise it again, the input profile is practically identical with the profile chosen for the first band [cf. Fig. 3.8(a) with Fig. 3.10(a)], with the only difference being the location on the lattice. However, a comparison of the beam profile at the crystal output [Fig. 3.8(b) and Fig. 3.10(b)] gives evidence that the apparently small difference in the spatial phase of the beam relative to the lattice has a critical impact on the propagation properties of the beam, demonstrating an important characteristic of the propagation of light in periodically modulated materials. This difference gets even more obvious for the nonlinear propagation: At increasing beam powers [60 nW, 100 nW, and 230 nW for Fig. 3.10(c-e), respectively]
3.5 Excitation of the Bloch-Floquet modes from the second band
33
normalized amplitude, A 0 200
0.1
0.2
0.3
0.4
0.5
FWHM (µm)
(b) 150
100
(e) 50
0 0
50
100
150
200
250
300
beam power (nW)
Figure 3.11: Focusing of a beam corresponding to the X-point of the second band: (top) width at the crystal output in experiment (symbols) and theory (lines). Solid line and dots – widths along x-axis; Dashed line and triangles – widths along y-axis. Gray bars reference the corresponding intensity profiles in figure 3.10. The three-dimensional plot on the right visualises the localised state at 230 nW.
the beam at the second band focuses in both transverse directions while the mode at the first band strongly defocuses in x direction. Also the physical reason for the nonlinear behaviour differs for the two modes. While for the X1 mode the band curvature determines the dispersion properties, the mode at the second band touches the bandgap and at increasing beam powers the beam is shifted into the gap where it localises on the self-induced defect and forms a spatial gap-soliton [Fig. 3.10(e)]. The nonlinear focusing of the probe beam can be analysed based on figure 3.11 where we plot the beam width in x and y direction against the input beam power. The widths are estimated as the full width half maximum (FWHM) of the Gaussian envelope over the modulated beam profile. Despite the elliptical beam shape, the linear diffraction at low probe beam intensities is stronger along the x-axis (experimental measurements marked as dots, numerical results as solid line) than along the y-axis (widths in experiment marked as triangles, numerical results as dashed line). In two-dimensional lattices, broad beams are known to be susceptible to collapse instability [43]. However, for the case of the X2 mode we see the focusing stopped at around 230 mW, where the beam profile covers approximately one lattice site in direction of constant phase and three in the direction of alternating phase. On the right side of figure 3.11 the intensity distribution of this localised state is visualised as a three dimensional plot. We find that the results of the numerical simulations show the same tendencies as our experiments. The lines in figure 3.11 represent a polynomial fit of the widths after 20 mm propagation, measured from a Gaussian envelop fitted to the numerically calculated intensity profile analog to the experimental measurements. Similar to the experiment, the width of the output state decreases to a minimum value of about 40 µm in the x direction and down to one lattice period (23 µm)
34
Bloch-Floquet modes and gap solitons in an optically induced square lattice
in the y direction. The slight increase of the beam width along the x direction at powers above 250 nW is due to a splitting of the beam into two solitons, an effect well known in one-dimensional systems [44].
3.6 Reduced-symmetry gap-soliton with directed mobility properties The formation of the localised state at the X2 point resembles the formation of the discrete gap soliton at the Γ1 point. In both cases, the nonlinear induced increase of the refractive index shifts the beam into a gap so that the beam is trapped at the self-induced lattice defect. However, due to their unlike symmetry the two localised states differ significantly in their properties. The mode at the Γ1 point is fully symmetric towards the lattice. It can only form along one lattice site and hence is fixed in its propagation direction to the z-axis [45, 46]. At the X2 point however, the mode has a reduced symmetry towards the underlying lattice. The lattice belongs to the C4 point symmetry group since the structure is identical after a rotation of 90, 180, 270 or 360 degree around any lattice site. The Bloch-Floquet mode on the other hand is only reproduced after a rotation of 180 and 360 degree, making it a member of the C2 point symmetry group. The reduced symmetry – particular in the phase structure of the Bloch-Floquet wave – not only causes different dispersion properties along the principle axes of the lattice but also indicates different mechanisms for the nonlinear focusing: An alternating phase is a key signature for a localisation due to Bragg reflection, whereas the constant phase in the orthogonal direction shows that total internal reflection is responsible for self-trapping in this direction. Along with the different physical effects causing the localisation we find a difference in the mobility properties. While the trapping in the lattice due to total internal reflection limits wave transport to the direction of the z-axis – as seen for the soliton originating from the Γ1 point – staggered phase or Bragg solitons are known to be highly mobile on the lattice. The formation of gap solitons in square lattices have been theoretically predicted in the work of John and Akozbek [47]. But similar to the recently experimentally observed gap vortices [48, 49] the solitons discussed in that work are symmetric and can be interpreted as a superposition of the states from the X2 and Y2 point. Experiments at the Y2 symmetry point confirmed that the mode has exactly the same properties as the mode at the X2 point, yet mirrored at the bisector. However, with the superposition of the two modes the interesting anisotropic properties of the single gap solitons are lost. To ensure that the observed self-trapped state qualifies as a soliton, we resolve the beam evolution inside the crystal in numerical simulations. The calculations show that the beam focuses at its initial stage of propagation, whereupon it reaches a steady-state propagation. Since it is easily possible to calculate the propagation for distances longer than the crystal length (20 mm), we simulate large propagation length and observe a stable beam evolution over distances up to one meter. The solitons eventually disintegrate after longer propagation distances due to the
3.6 Reduced-symmetry gap-soliton with directed mobility properties35
800
(c) (d)
Power
600 400
(b) (a)
200 0
0
-2.2
-2.1 β
(a) y
y/d
x
(c)
(d)
y
y x
0
-1.9
(b) y x
1
-2
x x/d
6
0
x/d
7
Figure 3.12: Families of gap solitons shown as normalised soliton power vs. the propagation constant. The grey areas mark both ends of the gap. (a-d) Examples of four types of gap solitons for β = −2.04. Line intersections mark the position of the lattice maxima.
development of oscillatory instabilities. As the Bloch-Floquet mode at the X2 point enters the gap, it can form localised states in four different symmetries. The numerically calculated intensity profiles of theses states are depicted in figure 3.12(a-d) for β = 2.04 (approximately the middle of the gap). They are centred either on or between the lattice sites of the horizontal and vertical axes, respectively. In all four cases, the soliton phase remains constant in y and oscillating in the x direction. The profile and power of each soliton symmetry changes slightly depending on its propagation constant β inside the gap, building four families of gap solitons that are found numerically by applying the two-dimensional relaxation technique∗ [50]. In figure 3.12(top) we plot the soliton power of these families against β. It is evident from the plot that the states (a) and (b) are energetically preferable compared to (c) and (d) and therefore more likely to be observed in experiment. Furthermore, the power of type (a) and (b) solitons practically coincide everywhere in the gap. The transition between these two states equals a moving along the x-axis of the lattice for half a lattice period. The negligible difference in power means that the force required for this transition, corresponding to the so-called Peierls-Nabarro potential [45], is very small. In contrast, there is a large difference in the powers for the solutions of types (a,b) and (c,d). This implies the existence of a significant Peierls-Nabarro potential along the y-axis and therefore reduced mobility or trapping of the solitons along this direction. ∗
The numerical calculation of the families has been done by Andrey Sukhorukov.
Bloch-Floquet modes and gap solitons in an optically induced square lattice
36
k y = 0 mrad
k y = 20 mrad
k x = 0 mrad
(a)
x
kx = 20 mrad
(b)
Experiment
(c)
(e)
(d)
(f)
y
50 µm
50 µm
Figure 3.13: Mobility of reduced-symmetry gap-soliton. (a-d) Numerically calculated output beam profiles after 20 mm propagation length for different initial tilts of the beam. (a) no tilt, (b) 20 mrad tilt along x, (c) 20 mrad tilt along y, (d) 20 mrad tilt along x and y; (e,f) show two experimental examples for the mobility along x, the cross marking the beam centre at the crystal front face.
Following these theoretical predictions, we investigate the soliton mobility in numerical simulations and experiment. More precisely, we impose an initial tilt to the input beam along the different lattice directions and study the beam displacement at the output compared to the soliton position without tilt [Fig. 3.13(a)]. In simulations, an initial tilt of 20 mrad (15% of the Bragg angle) in direction of the x-axis moves the output by two lattice sites [Fig 3.13(b)], whereas the same tilt in y leads only to a small deformation but no movement of the output state [Fig 3.13(c)]. Even with both tilts superimposed, the soliton moves the same two lattice sites along the x-axis only [Fig 3.13(d)]. This behaviour is confirmed in experiment: Two examples of the corresponding experimental results presented in figure 3.13(e,f) demonstrate the high mobility of the localised states along the x direction. Since the lattice itself is uniform in x and y, and the solitons originating from the X2 and Y2 symmetry points behave identically (though for a 90 degree rotated coordinate system), the axis of mobility is only determined by the localised state itself. These solitons can move robustly either along a row or a column of the lattice, depending on the mode chosen for the input beam. This property offers a controlled wave transport that can be used for all-optical switching or routing. In contrast to earlier suggested soliton networks [51], such states in square lattices do not require, and hence are not limited by fixed waveguides to direct the solitons.
3.7 Conclusions from square lattices
37
input
output
(b)
(c)
(d)
square lattice
bulk
(a)
Figure 3.14: Linear beam diffraction in bulk media and in presence of square lattice. (a,c) Input beam profile at crystal front face. (b) Diffraction after 20 mm in SBN without index modulation. (d) Discrete diffraction pattern of the same beam propagating along the lattice.
3.7 Conclusions from square lattices In this chapter we have studied the effect of a periodic square pattern on the diffraction and nonlinear self-shaping of propagating light beams. The lattice was optically induced in a photo-refractive crystal by the interference of four coherent beams. Probe beams were engineered with the phase-imprinting technique to excite selectively the Bloch-Floquet waves or eigenmodes of the system belonging to different high-symmetry points of the photonic lattice. Based on the linear diffraction and nonlinear focusing of a Gaussian beam – corresponding to the Γ1 point – the band structure of the system was calculated and revealed a complete two-dimensional photonic band gap between the first and second bands. Analysing the experimental and numerical results we could confirm the theoretical predictions derived from the band characteristics at the corresponding BlochFloquet mode. In turn, the band structure, in particular the band gaps, could explain the nonlinear beam focusing and trapping of the modes at the Γ1 and X2 point. The clear agreement between experiment, numerical simulations and theoretical predictions underline the accuracy of Bloch’s theorem in describing the beam evolution in periodic optical potentials. In order to draw conclusion in regard to the theme question of this thesis – how the two-dimensional modulation affects the nonlinear propagation of light – we have to compare the characteristics of beam dynamics in the square lattice to that in bulk and one-dimensional modulated materials. One key characteristic of the periodic modulation is discretisation. This effect is most obvious in the linear diffraction as shown in figure 3.14 at the example of a Gaussian beam. Not only is the energy of the diffracted beam concentrated on the
38
Bloch-Floquet modes and gap solitons in an optically induced square lattice
lattice sites and thus spatially discretised [Fig. 3.14(d) shows only the probe beam, other than in (c) the light from the lattice beams is filtered out by a polariser] but also do we find the energy transported away from the centre due to coupling between the lattice sites, both direct results of the periodic index modulation. Less apparent yet not less important is the effect of discrete eigensolutions in a periodic system. Phenomena associated with the appearance of a spectral gap, like for instance the soliton formation, are only possible because of a discontinuity between the discrete bands. In contrast to bulk media, the evolution of a light beam depends critically on its initial position in the modulated material. A comparison between the experimental results for the X1 and the X2 symmetry point makes this evident: The same probe beam can experience either nonlinear focusing or defocusing along the x-axis, solely depending on its relative position to the lattice [Fig. 3.8(c), Fig. 3.10(e)]. Both the discretisation and the sensitivity towards the beam position relative to the lattice phase can also be observed in one-dimensional lattices. However, a major difference of higher dimensional systems is the appearance of states with reduced symmetry towards the system. In our experiments, the resulting anisotropic beam dynamics have been observed for Bloch-Floquet modes profiles from the X1 , M2 , and X2 point. The corresponding modes all belong to the C2 symmetry group, while the lattice structure itself has a C4 symmetry. The same modes also feature an unequal band curvature in the Fourier space. The gap soliton originating from the top of the second band (X2 symmetry point) is a good example for the possible benefits that can be gained if the anisotropy relative to the lattice is employed in a smart way. This state can be simultaneously trapped in one direction, and still remains fully mobile in the orthogonal direction. For technical application such as all-optical switching or routing, this offers a novel approach to control nonlinear wave transport and thus e.g. steer the information carrying beam to a specific port.
CHAPTER 4
Bessel optical lattices
In the few years since their first successful fabrication in 1996 [52], photonic crystal fibres have become the most common and widely used two-dimensional modulated photonic structure. Their ability to confine light over sometimes kilometres to an area of the size of a few wavelengths dramatically enhances nonlinear effects. Usually these fibres are used with laser pulses so that the light is not only spatially confined but also temporal. Thus nonlinear effects such as self- and cross-phase modulation, four wave mixing, modulation instabilities and third-harmonic generation are accessible at moderate (average) laser powers even in material with weak nonlinearity as e.g. fused silica. By the design of the fibre profile it is possible to control the waveguide dispersion properties so that parts of the pulse propagate as temporal solitons and the peak power remains high over a large interaction length. The most prominent result of the combination of these features is the extreme spectral broadening known as super continuum generation [53]. Until recently, practically all the research that was done on micro-structured∗ fibres concentrated on the spectral temporal output of the laser light. Although the idea of filling holey fibres with liquids is almost as old as that of optical fibres itself [54, 55]† , it was primarily the idea of filling the few micrometres wide holes provided by these fibres that raised the interest in studying nonlinear spatial effects in these systems. Usually the employed liquids like oils or liquid crystals feature strong nonlinearity and have a higher refractive index than the silica or polymer of the fibre, so that the light is guided mainly in the liquid, that is in the holes. In preparation of similar studies in our laboratories we used the advantages of optically induced lattices to gain a bit more insight in what effects could possibly be observed and what aspects might deserve special attention in these experiments. ∗
There has been some confusion in the community regarding the term ‘photonic crystal’ fibres. In fact, there are two types of fibre designs that guide light based on different mechanisms: either in a photonic bandgap as for instance in hollow core fibres or based on an effective lower refractive index cladding due to the holes. However, for the studies presented here this distinction is irrelevant; we concentrate on the consequences of the structure itself on the spatial beam development. † In early years the goal was to achieve low loss fibres. By guiding the light in liquids with low absorption and scattering the researchers hoped to have significantly lower losses than in fibres with silica cores. At these days the fabrication process for silica fibres could not yet avoid small impurities in the fibre core which made them unusable for long distance applications.
40
Bessel optical lattices
(a)
(b)
(c)
(d)
Figure 4.1: The profile of a modulated Bessel beam resembles that of a photonic crystals fibre. (a,b) Profiles of fibres used for infiltration experiments; (c) calculated intensity profile of an azimuthal modulated third-order Bessel beam, and (d) experimentally generated Bessel beam profile.
Some examples profiles of micro-structured fibres are depicted in figure 4.1(a,b). Out of the variety of currently available fibre designs we picked the most common one with a central core surrounded by one or more circles of holes – the shape of the fibres we had at hand for the planned infiltration experiments. This geometry differs significantly from the lattice discussed in the previous chapter. The periodicity of the square lattice can be described by its translational invariance Ip (x, y) = Ip (x + md, y + nd), m, n ∈ Z, where the pattern is congruent with a copy of itself that is shifted by any integer number (m, n) of periods d. At some points of the lattice it also reproduces after a rotation of any integer multiply of π/2. The symmetry of the fibres on the other hand only demonstrates a rotational p invariance Ip (r, ϕ) = Ip (r, ϕ + m 2π/n), m, n ∈ Z in the polar coordinates r = x2 + y 2 and ϕ = tan−1 (y/x) when rotated around the centre. The integer variable n in this expression determines the symmetry class Cn that we already referred to in the last chapter (see section 3.6). It has been shown by A. Ferrando [56] that due to this angular periodicity the concept of Bloch-Floquet modes can be extended to rotational symmetries. In polar coordinates the Bloch-Floquet waves then take the form E(r, ϕ) = ψκ (r, ϕ) exp(iκϕ),
(4.1)
where interestingly κ is bound by the two limitations |κ| ≤ n/2 and κ ∈ Z. The first restriction reflects the boundary condition of the first Brillouin zone analogue to the square lattice where it limits both kx and ky to [−π/d, π/d]. The second restriction has interesting implications if we look at the second term on the right side of expression (4.1). In contrast to the Bloch-Floquet modes in the square lattice, it is only a plane wave for κ = 0. For a value of κ = 1, the phase of the second term increases with ϕ, building a phase spiral that reaches 2π after a full round-trip. In this case, the phase in the origin (r = 0) is undefined while the wave in any direction ϕ is exactly out of phase with the part in the opposite direction ϕ+π, hence leading to destructive interference in the centre. This matches exactly the definition of an optical vortex, and indeed, the Bloch-Floquet modes in a radial symmetry are given by vortices of the ‘charge’ κ. The first restriction
4.1 Non-diffracting beams
(a)
41
(b)
(c)
Figure 4.2: Examples of nondiffractive beams generated by the phaseimprinting technique (a) Mathieu beam (b) Mathieu beam, second order (c) elliptical beam
thus limits the possible charge of a propagating vortex that is supported in a radial lattices with the symmetry Cn [57]. On this background we experimented with vortices to excite different BlochFloquet modes in an optically induced lattice with rotational periodicity – yet were not able to observe a stable propagation of any higher order mode due to the intrinsic anisotropy of the photorefractive nonlinearity. We therefore concentrated on the first mode κ = 0 and probed our lattice with a planewave at three critical points: the lattice centre, between two lattice sites and on a single lattice site. Studying the linear and nonlinear propagation of light at these points, we observe discrete diffraction and demonstrate nonlinear light localisation. Before we do so, however, it is worth to take a look at some technical details on how the angular symmetric lattice is generated.
4.1 Non-diffracting beams To generate an optical induced potential that has the geometry of a microstructured fibre we need a intensity distribution that has a radial symmetry in the x-y plane but is constant along the propagation direction z. In chapter 2 is was mentioned that the interference of two coherent beams produces an one-dimensional lattice that is constant in z. Similarly, a triangular lattice can be achieved by interfering three plane waves [58] and in the previous chapter we used four beams for a square pattern. One would guess that for a radial shape then an infinite number of interfering plane waves are necessary∗ . And indeed, this is the case. The interference of an infinite number of plane waves produces a transverse intensity profile of a zero-order Bessel function, what gives the name to this family of wave forms: Bessel beams. Despite the fact that the exact solutions (eigenmodes) of Maxwell’s equations which form such Bessel beams are infinite extended and carry an infinite amount of energy, they have been demonstrated in experiments ∗
Optical induced lattices that are stationary in z can be generated by any combination of mutually coherent plane waves, as long as the wavevectors lie on a circle in the x-y plane and point conically to a point on the normal of the circle centre.
42
Bessel optical lattices
with finite beams. A limited beam width automatically limits the area in which the beam profile remains constant. Nonetheless, the characteristics of stationary propagation could be sustained in experiments over long distances, reportedly up to several meter [59–62]. In the past years, a number of practical ways to generate Bessel beams have been suggested including the use of passive optical systems such as ring apertures, FabryPerot etalons, and axicons [63], as well as holographic methods [64], or diffractive optical elements [65]. However, by employing the same phase-imprinting technique used previously to shape the probe beams we gain a lot of flexibility in the design of the potential [66, 67]. Not only can we adjust the scale of the beam by a simple reprograming of the PPM, but also is it possible to add an azimuthal modulation to the Bessel profile. With this azimuthal modulation the transverse beam profile indeed resembles that of a micro-structured fibre (Fig. 4.1): Like in the fibres, where the light is guided in the infiltrated holes due to the higher refractive index of the nonlinear liquid, the high index regions of the lattice surround a low-index core. Bessel beams are only one family in a class of non-diffracting beams, that all feature a constant transverse profile in propagation direction. Depending on the coordinate system in which the eigensolution of Maxwell’s equations are sought, these can either be plane waves for Cartesian coordinates, or Mathieu and parabolic beams in elliptic and parabolic cylindrical coordinates, respectively. Bessel beams are solutions in circular cylindrical coordinates. All of these beam types and their combinations (superposition) are very suitable to be used for optically induced lattices [68]. During the testing of the phase-imprinting technique for the Bessel lattice we experimentally generated several examples (Fig. 4.2) and verified their constant profile in propagation direction: Mathieu beam lattices such as the one depicted in figure 4.2(a) have been studied in theory as quasi-one-dimensional structures [69]. Higher order Mathieu beams and elliptical beams with a complex phase structure [Fig. 4.2(b) and (c), respectively] nicely demonstrate the potential of the phase imprinting technique.
4.2 Experimental generation of Bessel lattices The experimental setup for the angular symmetric potential (Fig. 4.3) is very similar to the one used for the optically induced square lattice. The main difference though is that the PPM now is used to generate the Bessel beam for the lattice profile instead of shaping the probe beam profile. As a consequence, an additional λ/2 wave plate rotates the polarisation of this beam path to ordinary so that the Bessel beam passes through the biased crystal (3.5 kV along the c-axis) practically unaffected by the nonlinearity, while at the same time inducing an optical potential for the extraordinary polarised probe beam. The phase modulator is programmed to reproduce the phase profile of a modulated Bessel beam given by E(r, ϕ) = AJm (r/w) cos(mϕ),
(4.2)
where A determines the amplitude, w is the spatial scale, and Jm is the m-th order Bessel function (not to be mistaken with the variable m in the symmetry discussion
4.3 Light localisation in a modulated Bessel potential
43
Figure 4.3: Experimental setup for probing azimuthally modulated Bessel lattices: λ/2 – half wave plate, PBS – polarising beam splitter, L – lens, PPM – programmable phase modulator, FF – Fourier filter mask, SBN:60 – photorefractive crystal, HV – high voltage, Pol – rotatable polariser, CCD – camera. Green and red lines signify ordinary and extraordinary polarisation, respectively. Left: schematic illustrating the configuration of lattice and probe beams. The electric field is applied along crystal c-axis.
above). As previously we add a Blaze onto the profile and employ a Fourier filtering in the focal plane of the telescope before the azimuthal modulated Bessel beam is send through the crystal. After imaging the active surface of the PPM by the telescope into the crystal centre (again with a magnification factor of 1/16) the beam width is approximately 1 mm and we measure w = 7.6 µm [Fig. 4.4(a) and 4.5(a)]. For such a small beam width one expects the region where the beam displays non-diffracting properties to be rather short. Still, we find that the intensity profile remains sufficiently steady over the full crystal length of 20 mm. To probe the optical potential, we use the ordinarily polarised Gaussian beam that is reflected from the polarising beam splitter (PBS) and rotate its polarisation to extraordinary with a λ/2 wave plate. This beam is tightly focused to a size of 13.2 µm onto the crystal front face [the black circles in Fig. 4.4(b) and 4.4(b) indicate the size relative to the lattice] and recombined with the Bessel beam on a beam splitter before the crystal [Fig. 4.3(b)]. Like before, the input and output facets of the crystal can be imaged by a lens and recorded with a CCD camera. Additionally, a small portion of the probe beam is used as an interferometric reference beam to monitor the phase profile of the probe beam at the crystal output.
4.3 Light localisation in a modulated Bessel potential In the case of the square lattice we could neglect the anisotropy of the nonlinear response in the photorefractive crystal after rotating both principal lattice axes by 45 degrees towards the crystal c-axis. Unfortunately, for the radial symmetry it
44
Bessel optical lattices
c−axis
Figure 4.4: Experimental images: (a) Intensity profile of the generated thirdorder Bessel lattice (m = 3); (b) linear diffraction of the probe beam without the lattice, the outer radius of the black circle shows the size of the input beam at the crystal front facet; (c-h) linear diffraction (top row) and nonlinear selffocusing (bottom row) of the input beam positioned (c,d) at the lattice center, (e,f) between two cites, and (g,h) at one site of the first lattice ring.
is not that easy. Although we can minimise the distortion of the refractive index modulation by choosing an advantageous orientation of the lattice pattern with respect to the crystalline c-axis, the anisotropy of the nonlinear response cannot be completely eliminated. We find that the optimal orientation corresponds to a zero intensity line of the Bessel pattern perpendicular to the applied electric field, as shown in figure 4.4(a). The impact of the anisotropy differs for the Bessel lattices of different orders. In our experiments, we have tested the azimuthal modulated Bessel lattices of the orders m = 1; 2; 3; and 4. For the low-order lattices (m = 1; 2), the two or four sites in the inner ring dominate the induced refractive index structure, representing strong uncoupled waveguides. For the higher-order Bessel beams (m = 4) the effect of the crystal anisotropy leads to strong vertical merging (perpendicular to the c-axis) of the closely located lattice sites [Fig. 4.5(c) and (d)]. Therefore, below we concentrate on the results for the representative case of the third-order modulated Bessel beams (m = 3). Without the Bessel shaped index modulation, the low-power (20 nW) input probe beam diffracts and increases its width to 162 µm at the crystal output, as shown in figure 4.4(b). On the other hand, if the same probe beam propagates along the Bessel lattice it experiences discrete diffraction with the output profile strongly depending on the specific location of the initial excitation. This can be seen in figure 4.4 where we excite at the centre of the lattice (c), between two lattice sites (e), and on a single lattice site (g). We note that not only the diffraction
4.3 Light localisation in a modulated Bessel potential
(a)
(b)
(c)
(d)
45
50 µm
Figure 4.5: Experimental results in the case of a fourth-order Bessel lattice (m = 4): (a) Intensity profile of the generated lattice; (b) linear diffraction of the probe beam without the presence of the lattice, the black circle shows the size of the beam at the crystal input; (c) linear diffraction and (d) nonlinear self-focusing of the beam positioned at the lattice centre.
pattern but also the diffraction strength differ significantly for these cases. Starting with the central excitation, we see that for the low-power regime around 20 nW most of the energy is concentrated on the second ring of the lattice, reminding us of the discrete diffraction observed in the square lattice (Fig. 3.14). Besides these ‘good’ news, the effect of the anisotropic nonlinear response is clearly visible. It results in a deformation of the induced Bessel-type potential and, accordingly, in an asymmetric output beam profile even for a symmetric excitation at the lattice origin. The light spreads faster in the vertical direction (perpendicular to the c-axis), indicating that the lattice potential is stronger along the c-axis. As we increase the laser power to 250 nW, the beam experiences nonlinear self-focusing and becomes localised at the inner ring of the Bessel lattice [Fig. 4.4(d)]. This experimentally observed localised state matches well a numerically found solution for a soliton in this lattice (see section 4.5). However, because the formation of the state takes a good part of the crystal length, the light can propagate in this steady state for only a few diffraction lengths before the crystal ends. In figure 4.4(e,f) we test an excitation between two lattice sites. At this point (and the corresponding lower sites) both lattice sites are affected equally by the anisotropy resulting in a smaller distortion of the symmetry, as can be seen from the linear diffraction at low laser powers (20 nW) in figure 4.4(e). For a probe beam power of 600 nW we observe the light localising in form of a double-peak inphase structure [Fig. 4.4(e,f)]. Based on the generic properties of lattice solitons [44, 70] and results of numerical simulations, we expect that this double-peak state is unstable with respect to symmetry breaking.
46
Bessel optical lattices
(a)
(b)
Figure 4.6: (a) Intensity profile of the localised state for central excitation; (b) corresponding interferogram indicating a plane phase of the state.
When the input probe beam is positioned onto a single lattice site of the first ring, the lattice site acts like a strong waveguide and the coupling to the neighbouring sites is rather weak, resulting in a just as weak discrete diffraction at low laser powers [20 nW - Fig. 4.4(g)]. With increasing laser powers the light localises on the lattice site, until it forms at around 450 nW a trapped state [Fig. 4.4(h)] due to total internal reflection – similar to the discrete soliton observed at the Γ1 point of the square lattice (see section 3.4.1). By interfering the output beam of the crystal with the broad Gaussian reference beam we analysed the phase distribution of the localised states. In all the cases 4.4(d), (f), and (h), the light localised on the inner lattice ring was in-phase, while the residual light in the lattice centre appears weakly phase shifted as shown in figure 4.6. This phase shift can be attributed to the fact that the residual light is propagating in a region with lower refractive index compared to the lattice sites.
4.4 Vortices on modulated Bessel potential The interferogram and the related phase of the probe beam look very different if we probe an optical vortex on the lattice. According to theoretical predictions, potentials with a rotational symmetry should support optical vortices as their eigenmodes. For our third-order Bessel lattice with a C6 symmetry, we could expect vortices with a charge up to κ = ±3 to propagate steadily along the potential [57]. The phase of the light on each lattice site would be constant while the phase difference between two lattice sites is expected to be κ2π/n, thus building a discrete lattice vortex. A close examination of the interference pattern in figure 4.7(e) shows that the phase at each lattice site is practically constant while the phase shifts slightly between the sites. However, the single vortex of charge one that propagates ideal without the lattice [Fig. 4.7(a,b)] turns into a complex phase turbulence when propagating along the lattice, with for instance nine phase dislocation as recorded in figure 4.7(e, arrows). We already observed earlier in various diffraction patterns (Fig. 4.4 and 4.5),
4.5 Numerical results for the anisotropic model
(c)
(a)
(b)
(d)
(e)
47
Figure 4.7: The linear propagation of a vortex in bulk media and in presence of a modulated Bessel lattice. (a) Intensity profile at the output of the bulk crystal and (b) interferogram of the same. The Y-juction in the middle indicates the phase dislocation; (c) Intensity profile of the modulated Bessel beam; (d,e) intensity profile and interferogram of the same vortex propagating along the lattice. Half-transparent arrows indicate phase dislocations.
that the anisotropy reduces the C6 symmetry of the system to effectively C2 . Still, theoretical predictions made in the beginning of this chapter would claim a vortex of charge one to propagate stable in a system with C2 symmetry. Yet the anisotropy of the photorefractive nonlinearity does not only reduce the symmetry but also leads to a different coupling strength between the lattice sites. Consequently, the energy flow of the vortex is disturbed or even broken, and any small misalignment of the vortex beam to the lattice causes phase distortions that are reflected in the new dislocations appearing in the residual areas of the lattice.
4.5 Numerical results for the anisotropic model Due to the strong anisotropy of the nonlinear response, the model successfully employed for the square lattices does not describe accurately the behaviour of light propagating in the optically induced Bessel lattice. Instead it is necessary to solve numerically the extended model∗ accounting for the anisotropy as well as the small nonlocal nonlinear response of the photorefractive material [50]. In this model, the ∗
The theoretical results presented in this section where prepared by Servando L´opez-Aguayo and Anton S. Desyatnikov and are included in this thesis for completeness.
48
Bessel optical lattices
(a)
(b)
(c)
(d)
y x Figure 4.8: Results of numerical simulations with the anisotropic nonlocal model: (a) Intensity of the azimuthally modulated Bessel beam and (b) corresponding induced refractive index profile (for A = 2.5 and γ = 2). (c,d) Examples of the ring-like and single-site solitons corresponding to the experimentally observed nonlinear states shown in Figs. 4.4(d) and (h), respectively.
nonlinear Schr¨odinger equation takes the form � 2 � ∂E ∂ E ∂ 2E i +D + + γ∂x ΦE = 0 , ∂z ∂x2 ∂y 2
(4.3)
coupled to the electrostatic potential Φ of the optically-induced space-charge field which determines the refractive index modulation and satisfies the relation [50] ∇2 Φ + ∇Φ∇ ln(1 + I) = ∂x ln(1 + I) ,
(4.4)
where ∇2 = ∂x2 + ∂y2 . Analogue to the modelling of the square pattern, the total intensity I in the medium is given by the sum of the probe and lattice beams (here for m = 3) I = |E|2 + A2 J32 (r) cos2 (3ϕ) , (4.5) where I again is measured in units of the background illumination intensity. By solving equation (4.4) for the intensity I of the lattice beam only, we find that the modulated Bessel beam induces a refractive index modulation which has a lower symmetry (C2 ) than the symmetry of the intensity pattern (C6 )[cf. Fig. 4.8(a) and (b)]. This comes as a direct result of the anisotropy and is confirmed by experimental observations, as e.g. the liner diffraction pattern depicted in figure 4.4(c). Stationary solutions of the system (4.3), (4.4) are sought with the relaxation technique [50], just as previously the soliton families in square lattices. With an Gaussian profile positioned on the potential centre as initial ansatz, the algorithm finds numerical solutions for ring-shaped solitons [Fig. 4.8(c)], which closely resemble the localised states observed in the experiment [Fig. 4.4(d)]. However, if we increase the peak intensity in the numerical calculations, the relaxation procedure converges to the on-site single soliton, shown in Fig. 4.8(d). We conclude that two families of solutions may be linked through a bifurcation, which may correspond to the onset of symmetry-breaking instability for the effectively two-lobe ‘in-phase’
4.6 Conclusion from Bessel lattices
49
soliton shown in figure 4.8(c). Although no stationary solution was found for the experimentally observed localised state excited between two lattice sites [Fig. 4.4(f)], this state propagates in numerical simulations stable over distances far longer than the crystal length before it disintegrates due to oscillation instabilities.
4.6 Conclusion from Bessel lattices In this chapter we generated azimuthally modulated Bessel beams and employed them to induce rotational periodic index potentials in a photorefractive crystal. Studying the linear and nonlinear light propagation in such segmented Bessel lattices we observed light localisation in the form of ring shaped and single-site self-trapped states. These experimental results are in good agreement with numerical simulations based on an anisotropic nonlocal model. Due to their symmetry, Bessel lattices can be regarded as an analogue of microstructured fibers infiltrated with highly nonlinear liquids, and the presented results can therefore be applied to predict light localisation in such fibers. Unfortunately, these studies offer more material for conclusions on the effect of an anisotropic nonlinear response than on a radial geometry. This anisotropy reduces the explored lattices effectively to a C2 symmetry. Furthermore, it causes an unequal coupling strength between the different lattice sites, thus hindering the energy flow required for the stable propagation of vortices. It was therefore not possible to study higher order Bloch-Floquet modes in these rotational symmetric systems. Nonetheless, the observation of discrete diffraction based on the (although inhomogeneous) coupling between the lattice sites shows how the index modulation shapes the beam dynamics. Analogue to the square lattice we find a discretisation of the intensity distribution and in the case of a vortex beam even of the azimuthal phase development. Since the Bessel lattice has no translational invariance like the square lattice, the propagation direction for stable modes in the system is naturally limited to the lattice orientation. Instead of a band structure, we therefore find the eigensolutions of rotational symmetric systems discretised to vortices with an integer charge that is limited by the lattice symmetry. The sensitivity of the beam development on the initial position at the lattice was found for both geometries, as a comparison of figure 3.8 with 3.10, and 4.4(c) with (e, g) shows. However, a direct comparison of this property between the two lattice types is difficult, because the anisotropy in the Bessel lattice hinders a clear interpretation. In both lattice types it was possible to induce nonlinear defects by increasing the light intensity. Light was trapped at these defects so that the corresponding beams would form localised states. Numerical calculations confirmed the formation of solitons in both systems [Fig. 3.12 and 4.8]. The combined results of the square and the Bessel lattice thus give us some insight into the complex interplay of photorefractive nonlinearity and two-dimensional index modulation. Comparing the impact of these two different geometries on the
50
Bessel optical lattices
linear and nonlinear propagation of light, we could identify fundamental characteristics that shape the beam dynamics in such systems. In the following chapters we will expand this study to another type of nonlinearity in conjunction with a different type of modulation. Although these systems are apparently very distinct, we will see that the mutual influence of modulation and nonlinearity leads to sometimes closely related phenomena.
CHAPTER 5
Second-harmonic generation and phase-matching
In the first part of this thesis we concentrated on the photorefractive nonlinearity, and how its interplay with a two-dimensional refractive index modulation affects the propagation dynamics of light beams. This mutual impact is best reflected in the development of the spatial spectrum in the beam profile. In contrast to this rather slow nonlinear effect we will now consider a very fast nonlinearity that affects primarily the optical frequencies of the light: Like in a piano where a hard keystroke at one of the lower notes will also set the higher harmonics in vibrations, a hard optical stroke – light at very high intensity – can cause in certain materials the generation of the second, third or even higher harmonics. We already noted in the general introduction of this thesis that the generation of optical harmonics was in fact one of the first reported nonlinear optics effects ever [2]. Since its discovery in 1961, it also has become one of the most important among them. A still today rapidly increasing amount of application and methods in research, life-science, telecommunication technologies, consumer electronics and many other fields benefit from, or even are based on optical harmonic generation or related frequency conversion processes. Ironically, just as laser light was needed to observe second-harmonic generation (SHG) in the first place, it is now the growing need of laser light at frequencies unavailable with the regular lasing materials that drives the development of new methods and techniques to perfect the frequency conversion process. To put the basic idea in general terms, the SHG process combines the energy of two photons in one photon that then consequently has the doubled frequency: 2(hν) = h2ν. Nonetheless, to understand the impact of a material modulation on this process, it is worth to discuss the origin and mechanisms of this nonlinear light-matter interaction a bit more in detail.
5.1 Nonlinear polarisation of the dielectric Coming back to the comparison with the higher harmonic generation in a piano, we can find an analogy between the piano strings and the electrons in a dielectric material. The stroke of the hammer at a string elongates it so that it starts to vi-
52
Second-harmonic generation and phase-matching
brate. Similarly, the electric field of the electromagnetic wave can displace electrons relative to the positive atomic cores∗ leading to a polarisation P of the material. The dependence of this polarisation on the electric field E can be expressed in a polynomial approximation (Taylor expansion) as (1)
(2)
(3)
Pi = �0 (χij Ej + χijk Ej Ek + χijkl Ej Ek El + . . .) ,
(5.1)
where �0 is the permittivity of free space. The susceptibility χ is a material property that varies for many crystals along their different axes and also depends on the direction of the electric field acting on the dielectric. In realty therefore, the susceptibilities χ(n) are tensors and the electric field is described by a vector relative to the principal crystal axis. The indices i, j, k, l, . . . in expression (5.1) therefore describe the components of the polarisation and the electric field, respectively. Furthermore, materials cannot polarise instantaneously in response to an applied field. This tiny delay causes the light to propagate through the dielectric at a velocity lower than that in free space. The refractive index – the relation of the speed of light in the material to that in vacuum – is therefore directly related to the linear susceptibility χ(1) , by far the largest factor in the Taylor series. However, the response time of the dielectric also depends on the frequency of light. This causes the light at different wavelengths to propagate at different velocities through the material, an effect known in various contexts as dispersion. Since the higher order susceptibilities (χ(2) , χ(3) , . . .) are much smaller compared to the first order susceptibility, the light-matter interaction for light fields with normal strength is dominated by the linear term P ≈ �0 χ(1) E. To give a quantitative example, for the Strontium Barium Niobate used in the previous chapters we find in literature a value of χ(1) = n2 − 1 = 3.94 [71](data for 1083 nm wavelength) compared to the maximal values of χ(2) = 3.54 × 10⁻¹¹ m/V [72](data for 1064 nm wavelength) and χ(3) = 1.17 × 10⁻²⁰ m2 /V2 [73](data for 1064 nm wavelength) that would affect extraordinary polarised light directed perpendicular to the crystal caxis. Consequently, these higher order terms that are responsible for the appearance of nonlinear effects, only contribute to the polarisation for very strong electric fields. This also makes clear why before the invention of the laser no second-harmonic generation or related nonlinear effects were reported: the light sources available at that time could simply not achieve sufficient high intensities for a nonlinear polarisation of the dielectric.
5.2 Characteristics of the second-harmonic generation From the expression for the nonlinear polarisation in equation (5.1), it is also possible to derive the particular case of second-harmonic generation. Following the ∗
For the aim of the explanation it is sufficient to employ the simple classical interpretation of dielectrics. Like any physical model it is just an approximation to the observed behaviour and does not claim to declare the physical reality.
5.2 Characteristics of the second-harmonic generation
53
explanation given by R. Boyd in his textbook [74]∗ , we can reduce the problem to P (2ω) = 2�0 def f E 2 (ω) ,
(5.2)
with def f standing for the effective second-order susceptibility (by definition 2def f = χ(2) ), already taking into account the material properties, the crystal orientation relative to the light beam and the polarisation direction of the electromagnetic wave. If we just change the sign of the applied electric field E in this equation, the sign of the induced polarisation P (2ω) must also change −P (2ω) = 2�0 def f [−E(ω)]2 = 2�0 def f E 2 (ω) ,
(5.3)
what then leads to the conclusion that P (2ω) = −P (2ω). In practise, this means that the second-order polarisation vanishes, and consequently no second-harmonic generation is possible. However, if for some reason the polarisation in opposing directions has a different strength, this conclusion is not valid any more. In certain crystals, namely non-centrosymmetric crystals, the intrinsic symmetry properties provide this situation. Nonetheless, this characteristic limits the usable materials to a rather exotic range of crystals that are usually not found in natures mountains∗ . Having overcome this problem by the choice of a suitable material, we assume a monochromatic plane wave with the slowly varying amplitude Aω 1 E(ω, z) = Aω exp(iωt − ikω z) + c.c. , 2
(5.4)
where kω = ωn(ω)/c is the wave vector including the frequency dependent linear refractive index n(ω). Here the index ω identifies variables of the fundamental wave in contrast to the index 2ω that is given to variables belonging to the secondharmonic wave. The analogous expression for the second-harmonic field is then 1 E(2ω, z) = A2ω exp(i2ωt − ik2ω z) + c.c. . 2
(5.5)
With this definition of the electric fields, the second-order polarisation becomes P (2ω) =
�0 def f A2ω exp(i2ωt − i2kω z) . 2
(5.6)
We then substitute these expressions into the wave equation ∇2 E − ∗
1 (1) ∂ 2 E 1 ∂ 2 P (2) � = , c2 ∂t2 �0 c2 ∂t2
(5.7)
Boyd uses the Gaussian (cgs) unit system, here the formulae where translated into the more common SI system based on [75] and information found at the online encyclopedia Wikipedia under the keyword ‘Second harmonic generation’. The aim of the following is not to repeat the mathematical derivation of SHG from coupled-wave equations in detail, but rather to identify characteristics of the SHG process that are relevant to the work presented in this thesis. ∗ Besides the use of non-centrosymmetric crystals, an asymmetry in polarisation can also be achieved in some materials like e.g. silica by applying a strong external electric dc field or mechanical stress, or occur near surfaces.
54
Second-harmonic generation and phase-matching
where �(1) (ω) stands for the frequency dependent dielectric constant �(1) (ω) ∝ [1 + χ(1) (ω)] = n2 (ω). Solving this coupled wave equation for a plane wave, we find iω dA2ω =− def f A2ω exp(i∆kz) dz n2ω c
(5.8)
describing the second harmonic wave where ∆k = k2ω − 2kω
(5.9)
is the wavevector mismatch between the fundamental and the second-harmonic wave [Fig. 5.1(a)]. The reason for this mismatch is the frequency dependence of the linear refractive index, causing the fundamental wave to travel with a different speed than the second-harmonic. The result of this mismatch is that the second-harmonic waves generated at different position in the material are out of phase and interfere destructively for every propagation distance ` of the fundamental wave in (π/|∆k|) < ` < (2π/|∆k|). Figure 5.1(c) illustrates this phase-mismatch schematically. If the waves originating from different positions were added, the total intensity would first raise and then equally vanish again. We also can derive this behaviour from equation (5.8) by integrating over the propagation length ` (for an improved clarity we abbreviate the formulation with the factor κ = −iω/n2ω c): A2ω (z = `) =
κdef f A2ω
Z
l
exp(iz∆k)dz
(5.10)
= κdef f `A2ω sinc(∆k`/z)exp(i∆k`/z)
(5.11)
0
where sinc(x) = sin(x)/x. From this formulation for the secondp the field of 2 harmonic wave we can see that its intensity (I2ω = 0.5n �0 /µ0 |A2ω | ) 2ω 2 d2ef f `2 2 I2ω (`) = Iω sinc2 (∆k`/2) 3 n2ωn2ω c �0
(5.12)
oscillates with the period∗ Λ = 2π/|∆k| and hence reaches its first maximum at the so-called coherence length `coh = π/|∆k|. Maker et al. [3] verified this in an experiment shortly after Franken had reported on their first SHG experiment. The behaviour is illustrated in figure 5.1(f) where the black line stands for the intensity of a non phase-matched SHG plotted against the propagation distance normalised by the coherence length. On the other hand, without a phase-mismatch ∆k = 0 the equation (5.10) reduces to a liner dependence of the SH field on the propagation length and hence a quadratic increase in intensity [see eq. (5.12)], as depicted with the green line in plot 5.1(f). After all these formulae, let us briefly summarise the essential information that we collected along the derivation of the SH intensity about the type and origin of ∗
To avoid confusion with the effective susceptibility def f we will denote periods in the following with Λ.
5.2 Characteristics of the second-harmonic generation
(a)
Δk kω
55
(b)
kω
kω
kω
k2ω
g
k2ω
(d)
(c)
Λ= 2lc
(f) no Δn Δk ∞
Refractive inden n
ne
λ
λ+h
wavelength λ
λ 2
(λ+h) 2
phase-matched, Δk = 0
SH power (arb. units)
(e)
QPM Δk = |g|
non phase-matched, Δk ≠ 0 0
2
4
6
distance (z/lc)
Figure 5.1: Quasi phase-matching. (a,b) Vector diagrams for (a) phase mismatch and (b) quasi phase-matching. (c) Schematic representation of bulk media with phase mismatch. The blue lines depicting exemplary the second harmonic generated at different position. (d) SHG with quasi-phasematching, grey arrows indicate the alternating poling direction and therefore the sign of χ(2) . (e) Qualitative plot illustrating the limitation of the phasematching bandwidth for birefringent phase-matching. (d) Comparison of the intensity development along the propagation direction for phase-matched (green line), not phase-matched (black line) and quasi phase-matched SHG (turquoise line).
the nonlinearity: SHG is a fast frequency conversion process originating from the nonlinear second-order polarisation of a dielectric and hence proportional to the intensity of the fundamental light. It can only be observed in non-centrosymmetric crystals where the conversion efficiency depends on the specific material properties and the orientation of the light wave relative to the crystal axes. Due to a different
56
Second-harmonic generation and phase-matching
speed of fundamental and SH wave, the SH intensity diminishes after the coherence length that directly depends on the phase-mismatch ∆k, thus limiting the efficiency of the conversion process.
5.3 Birefringent phase-matching The widely use of efficient SHG in many standard application today indicates that the challenge of phase-matching (PM) has been successfully addressed. In fact, there are numerous techniques and methods available to ensure that the SH generated along the propagation direction interferes constructively. For the purpose of this thesis we will group them in two classes: 1) methods that adjust the speed of the two different waves to eliminate the phase difference and 2) techniques that use a modulation of the nonlinear material to achieve in average a constructive interference of the SH field. The first group is not really in the scope of this thesis but shall be mentioned briefly for a later comparison. A common way to arrive at identical propagation velocities for the fundamental and the SH light is the use of birefringent crystals where the refractive index depends on the polarisation of the electromagnetic wave. By choosing the relative orientation of the fundamental polarisation to the crystal main axis so that is experiences the larger of the two possible refractive indices, it is possible that the refractive index for the doubled frequency of the orthogonal polarised SH wave just matches that for the fundamental – a technique known as angle tuning [Fig. 5.1(e), black dashed line marks ne (λpm ) = no (λpm /2)]. However, if a fitting configuration is only found under an angle to the crystal axis other than 0 or 90 degree, the SH will diverge from the fundamental beam as they propagate through the crystal. This walkoff effect limits the spatial overlap of the two waves, thus limiting the constructive interference and consequently reducing the SHG efficiency. To avoid the walkoff problem, in some crystals it is possible to hold the wave polarisations fixed along the crystal axis and adjust the refractive index difference (birefringence) by changing the temperature of the crystal. However, achieving PM by any of these methods for a certain frequency, generally does not imply that the group velocities of the interacting waves are matched as well. Figure 5.1(e) illustrates this for a wavelength λ0 + h that is shifted by an amount of h from the birefringent phase-matched frequency λ0 . Due to the nonlinear dependence of the refractive index on the frequency, the SHG process for this wavelength is not phase-matched any more. It can be shown [75] that the phase-matching bandwidth therefore is limited to 0.44λ0 (5.13) ∆λF W HM = ` |n0 (λ0 ) − 21 n0 (λ0 /2)| where n0 is the derivative ∂n/∂λ, and interestingly the bandwidth reduces with an increasing propagation length. On the other hand, we have seen that the conversion efficiency increases quadratically with `. Consequently we find an unavoidable tradeoff for birefringent phase-matching techniques: either we have a high conversion efficiency using a long crystal, or a broad bandwidth with a short crystal.
5.4 Phase-matching with modulated materials
57
5.4 Phase-matching with modulated materials An alternative solution to adjusting the wave velocities for PM is to modulate the nonlinear response of the material such that the SH generated in `coh < z < 2`coh has an additional phase difference of π towards the SH generated earlier (z < `coh ). As result, the SH intensity will not diminish in this region but in average interfere constructively with the previously generated SH, as illustrated in figure 5.1(d). The related curvature for the SH plotted against the propagation distance in figure 5.1(f) thus effectively changes its sign. If this modification is applied periodically (grey shaded areas), the SH intensity grows along the propagation direction as illustrated by the turquoise graph. This techniques is known as quasi phase-matching (QPM), and the π phase jump for the SH wave in this region is achieved by inverting the orientation of the ferroelectric crystal domains. Earlier [see Sect. 5.1] we noted that SHG is only possible in non-centrosymmetric crystals where the second-order polarisation has a directional preference. In most crystals this preference is either along or opposing the crystal c-axis, coinciding with the domain orientation. By flipping the domain orientation we thus change the direction of the stronger second-order polarisation and hence the electric field of the generated SH wave points in the opposing direction. An opposing electric field of the SH wave then again equals the same wave with a phase-shift of π [Fig. 5.1(d)]. The shape, size and orientation of the ferroelectric domains strongly depend on the conditions of the crystal growing. Usually it is not possible to control all these parameters sufficiently to grow a crystal where the direction of the crystal axis alternates with just the right period needed for phase-matching. It is however possible to change the orientation of the domains after the crystal structure has already formed. This is done by applying a strong external electric field so that the domains reorientate along the field. In the next chapter the related technology will be considered a bit more in detail. Mathematically, this material modification can be expressed with an alternating sign of the χ(2) nonlinearity. To achieve PM, the modulation period has to be exactly Λ = m2π/(∆k), m ∈ Z where m denotes the order of the phase-matching. Although the first order is preferable in almost all cases since it yields higher efficiencies, in some situation it is hard to manufacture the required small period. Nonetheless, PM is also possible if the modulation periods is an integer multiple of 2π/|∆k| – yet the conversion efficiency drops quadratically with the phase-matching order (1/m2 ). The phase-matching bandwidth of QPM structures has been considered in detail by V. G. Dmitriev and Y. V. Yur’ev [76]. For our discussion it might be sufficient to cite their result that the spectral bandwidth of this method is inversely proportional to the crystal length (see also [77]), leading to the same tradeoff between bandwidth and efficiency previously mentioned for the birefringent PM. Since the bandwidth for high efficiency devices is often very narrow, most application have to make use of the thermal tuneability of these structures similar to that of birefringent crystals. Analogue to the wavevector that represents the electromagnetic wave in the Fourier space, the periodic grating of alternating material poling (orientation of the
58
Second-harmonic generation and phase-matching
crystal axis) can be described by the reciprocal lattice vector g with the magnitude |g| = 2π/Λ. The vector diagram in figure 5.1(b) shows how this vector compensated the phase-mismatch of the process. Additionally, we can see that due to the grating the momentum is conserved. The latter note becomes very important for noncollinear phase-matching where the wave vectors of the fundamental and the SH are no longer parallel. However, for any other configuration of the wavevectors to each other than the depicted one, the grating vector g has to become longer and therefore the grating period smaller. The collinear arrangement is therefore often the technically preferred QPM scenario, producing SH in forward direction.
5.5 Summary In this chapter we had a very brief review of the physics of the SHG process, with the aim to identify its origin and properties. It is a fast two-photon process that combines the energy of two fundamental photons to one photon at the doubled frequency. The efficiency of the process depends primarily on: 1) the fundamental beam intensity, 2) the material properties, 3) the interaction length and 4) in conjuction with the interaction length on the fulfilment of the phase-matching condition, meaning that the SH waves generated in different positions interfere constructively. After this discussion on the charatersitics of the nonlinearity, we will consider in the following two chapters the effect of two-dimensional modulation, that is alternating the sign of the χ(2) nonlinearity, on the SHG process. This material modulation can either be manufactured in a controlled manner or naturally given by the inherent material structure. In this thesis we will consider both situation, and compare some of the consequences of these modulation types and their different geometries for the SH emission profile.
CHAPTER 6
Nonlinear Bragg diffraction and toroidal waves
Looking once again back into the busy early 60th of the last century, where the invention of the laser (May, et al., 1960) was more or less directly followed by the first observation of second-harmonic generation (SHG)(Franken, et al., 1961), and the problem of phase-matching was soon experimentally observed and discussed (Maker, et al., observed 1961, publ. Jan. 1962), we already find the first proposal of a periodic material modulation as a possible solution in an article by Armstrong, et al., submitted in April 1962 [78]. However, the suggestion proofed to be rather cumbersome and technical challenging: the crystal ought to be cut into thin slices where every second slice would be turned by 180 degree to invert the crystal axis, thus achieving quasi-phase-matching (QPM) as discussed in the previous chapter. Seeing the difficulties of this approach, a number of alternatives where soon developed, including techniques that would already alter the χ(2) nonlinearity during the growing process [79], or balance segments with different phase-mismatch (achieved by Rb indiffusion into KTP crystals) [80]. In the mid 70th, Levin, et al. [81] applied a periodic electric field to liquid nitrobenzene in order to modulate its nonlinear susceptibility. But only 1993 Yamada, et al. [82] reported on a more practicable photolithographic method to control where an external applied electric field would flip permanently the domain orientation in ferroelectric crystals. Since then, the photolithographic based technique to periodically pole ferroelectric crystals has not only become a standard tool for generating QPM structrues but also a rapidly growing industry. Almost all of these structures are designed for forward frequency conversion and therefore feature a one-dimensional modulation as illustrated in figure 5.1(d). More recently, the approach was extended to two-dimensional structures [83] and several pattern designs have been developed that make use of the additional degree of freedom for non-collinear SHG [84–86]. However, all of these studies focus on the propagation of light in the plane of modulation – primarily because this is the most efficient geometry. In this chapter we will consider the rarely studied geometry along the poling structure, similar to our experiments in optically induced lattices. In this configuration, certain characteristics of the poling process become important that are usually not critical for standard applications. We therefore will briefly review the poling process with reference to
60
Nonlinear Bragg diffraction and toroidal waves
the actual sample used in our experiments, so that later we will be able to identify the origin of certain structural artefacts that shape the SH emission profile. The sample used in the following study had originally been designed for noncollinear frequency doubling of a Nd:YLF laser at 1047.5 µm [85]. It consists of an annular binary structure poled on a 0.49 mm thick stoichiometric LiTaO3 (SLT) crystal in z-cut with an active size of 8.75 × 5 mm. Since we reuse the sample for propagation in direction of the z-axis, the geometry seems similar to that of the Bessel lattices. However, the structure is not azimuthally modulated and unlike the Bessel function the lattice has a strict radial periodicity, in our case of 7.5 µm.
6.1 Periodic poling The most common material employed in manufacturing QPM structures is Lithium Niobate (LiNbO3 ). Besides a comparatively large def f it features a broad transparency window and its wide spread use in optical telecommunication application makes it a relatively cheap commodity material. Compared to LiNbO3 , SLT is a bit more expensive, but offers advantages for frequency conversion in the visible range. Therefore this material raised recently the interest in the search of (frequency converted) RGB laser sources for new display technologies. However, the poling technique for both materials is practically the same. Figure 6.1 summarises the processing steps required to create a periodically poled crystal, as it was explained to the author by three different research groups manufacturing such structures∗ : The desired poling pattern is written on a chrome mask, whereby the resolution usually is limited to around 1 µm. It has to be said though, that the dark areas on the mask have to be chosen smaller than the intended repoled regions in the crystal. The mask then is laid on the photoresist coated Z(+) side of a homogeneously poled crystal wafer and exposed with UV light [Fig. 6.1(a)]. After the wafer with the exposed photoresist has been baked in an oven and the unexposed photoresist is washed out [Fig. 6.1(b)], the wafer is clamped between two O-rings in a fixture of the type depicted in (g) and an electrolyte is pored into the holder. The electrolyte serves in the setup as liquid anode and cathode, respectively. The specific poling parameter like amplitude, shape and duration of the applied high voltage pulse depend on the material thickness, the desired duty-cycle and other influences from the poling configuration. For instance, the 0.49 mm thick SLT sample used in our experiments was poled with 0.6 kV pulses. At the initial state, the domain reorientation in the crystal starts at the edges of the photoresist where the electric field is the strongest. The nucleation reflects the shape of the crystal structure. G. Miller, who studied the domain kinetics during electric field periodic poling states in his thesis [88]: “A domain nucleus in lithium niobate can be represented as a six-walled pyramid, with a hexagonal base at the surface of the ∗
The illustrated process is one possible approach besides others. The sample used for the experiments in this chapter has been produced in a small variation from this standard technique, where a thin (120 nm) titanium layer thermally deposited onto the photo resist pattern [87] was used instead of electrolytes. According to the best of the authors knowledge this detail should have little to no impact on the structural properties that are the focus of this explanation.
6.1 Periodic poling
61
photomask
(a)
photoresist ferroelectric crystal, for instance SLT
(b)
Z(+) Z( ) liquid electrode
(c)
high voltage
(g) (d)
(e)
(f)
periodically poled crystal
Figure 6.1: Processing steps for periodically poling of ferroelectric crystals.
crystal, and its apex, or tip, close to but just below the surface. The tip propagates parallel to the polar axis to the opposite face of the crystal, dominating the growth of the domain in this stage. As the tip propagates, the diameter of the base increases.” This behaviour is schematically depicted in figure 6.1(c). After the tip reaches the opposite facet of the sample the domain grows further in the horizontal direction (transverse to the applied field) [Fig. 6.1(d)] until the nuclei merge to form a single domain. Depending on the duration of the bias, the domains continue to grow under the region shielded by the photoresist [Fig. 6.1(e)]. The properties of the applied poling pulses thus have a strong influence at the produced duty-cycle of the completed structure after the photoresist is removed [Fig. 6.1(f)]. The exact domain formation in the poling process has usually no notable effect on the frequency conversion process in the resulting structure – as long as the light propagates perpendicular to the z-axis of the crystal. In this ‘regular’ configuration the most important factor for the conversion efficiency is the duty-factor D which
62
Nonlinear Bragg diffraction and toroidal waves
Z(+)
detail
Figure 6.2: Photo of the sample used in experiment. The annular periodic structure has been made visible by etching the surfaces with HF.
for our sample varies between 0.7 at the Z(+) surface and close to 0.8 at the Z(-) surface, while the period length of 7.5 µm was precisely kept along the crystal. This small derivation is not crucial for in-plane (wavevector k ⊥ z) SHG but decreases the efficiency for phase-matching in transverse geometry as we employ it in our experiment. An HF etching of the sample surfaces made the domain walls visible as depicted in figure 6.2. A close examination of the structure reveals small inhomogeneities in the pattern. The form of these defects at sub-micrometre scale remind the observed tendency of ferroelectric domains in LiNbO3 and SLT to retain their hexagonal shape in the poling process [89–91]. Although these defects are each minor by itself, they all reflect the symmetry of the crystal lattice and therefore are apparent in the Fourier spectrum of the modulation pattern. Before conducting the experiments, the end faces of the crystal have been polished for optical measurements. Nonetheless, small 20 nm deep grooves from the etching that remain after polishing cause weak (less than 3%) diffraction for a beam send perpendicularly to the domain structure, that is along its symmetry axis.
6.2 Nonlinear Bragg diffraction In the first chapter we introduced the Bragg condition in the context of a dielectric mirror, where a periodic modulation of the refractive index can cause a complete reflection of a light wave. In chapter 3 we then discussed how this condition leads to the appearance of band-gaps in the mode spectrum of the optical induced square lattice - again a system with periodic modulation of the refractive index. Interestingly, similar Bragg diffraction can also occur in media with a spatially homogeneous optical refractive index. The poling procedure that was used to generate our sample only flips the orientation of the crystal axis but generally does not affect the refractive index of the material (with the exception of the domain boundaries where the stress in the crystal structure induces a negligible index
6.2 Nonlinear Bragg diffraction
63
distortion). Nonetheless, the alternating sign of the second-order susceptibility χ(2) provides a periodic modulation that can result in an nonlinear analogue to the Bragg condition. While in the case of an index modulation with the period Λn the partial refracted waves add coherently and form a strong beam propagating outside the sample at the angles θm = sin−1 (mλ/Λn ), we find that for a homogeneous refractive index but modulated nonlinear response the second-harmonic waves interfere constructively outside the sample under the angles θm = sin−1 (mλSH /Λχ(2) ) ,
(6.1)
which are determined by a ratio of the second-harmonic wavelength λSH to the modulation period Λχ(2) of the χ(2) nonlinearity. In both situations m stands for the diffraction order, whereby in the nonlinear case it interestingly coincides with the phase-matching order. This effect, known as nonlinear Bragg diffraction, was first discussed by Freund [92], and has been observed experimentally in naturally laminated crystals exhibiting non-regularity and dispersion of the nonlinear domains [93]. As already mentioned, we probe the annular poled sample from the transverse direction, that is along the z-axis that indicates the ferroelectric domain orientation [Fig 6.3(top, a)]. Since in this configuration the beam is incident on the normal to the modulation plane, the grating vector g also stands perpendicular to the fundamental wavevector kω . The phase-matching condition therefore has now a transverse and a longitudinal component, that both have to be fulfilled to achieve efficient SHG. The vector diagram in figure 6.3(c) illustrates these conditions graphically. From there we can see that in transverse direction the angle αm of the m-th order inside the crystal is give by |k2ω |sin(αm ) = |g(m) | ,
(6.2)
where the grating vector g(m) of the m-th order conserves the transverse momentum. The same relation expressed as a dependency on the SH wavelength and poling period instead of the wave- and grating vector yields sin(αm ) = m
λSH , n2ω Λχ(2)
(6.3)
where n2ω = 2.31 is the refractive index of the material at the SH wavelength. This expression reminds us directly at the Bragg relation that governs the diffraction of waves and formation of spectral gaps in the optically induced square lattices. It also sets the maximum number of orders that can be generated inside the sample as mmax = (n2ω Λχ(2) )/λSH . Moreover, according to equation (6.1), the SH orders emitted from the output face of the sample to the outside can only reach Λχ(2) /λSH . On the other hand, the phase mismatch in the longitudinal direction |∆km | = |k2ω |cos(αm ) − 2|kω |
(6.4)
64
Nonlinear Bragg diffraction and toroidal waves
(a)
gG(4) 4
z y
k 2(4)
x
gG(3) 3
k 2(3) k 2(2)
α4
z
(b)
(c)
g(2) G2
g(1)
k 2(1)
y
G1
x (d)
Ay
Ay
ϕ
k1
k1
ϕ
x
z
Ay
ϕ
x
x
Figure 6.3: Phase matching and conical SH emission. (top) Schematic representation of excitation geometry. (a) Front facet of the SLT sample. (b) Farfield image of SH cones generated by the first two transverse phase-matching orders (longitudinal not phase-matched). (c) Phase matching diagram of the SHG process in the transverse QPM grating. (d) Polarisation structure of the ordinary (left), extraordinary (middle), and small-angle (right) second harmonic rings. The fundamental wave (red) is linearly (along y) polarised.
cannot be compensated for by the structure and hence limits the efficiency of the conversion process. The vector diagram in figure 6.3(c) makes clear that for a given set of fundamental wavelength, temperature and modulation period, there can only be one emission angle and therefore only one order exactly phase-matched with ∆km = 0. The discussion so far only considered the phase-matching in a single plane. Since the structure of our sample is fully radial symmetric, the conclusion from these phase-matching conditions are equally valid for any azimuthal angle ϕ and consequently the SH radiation will appear in form of concentric cones with cone angles θm [Fig. 6.3(top)] if the fundamental beam is directed exactly at the centre of
6.3 Polarisation and the χ(2) -tensor
65
the structre. However, the phase-matching considerations above do not yet take into account the crystalline structure. As we will see, besides the phase-matching, two more aspects have influence on the SH emission profile: the polarisation properties of the fundamental and SH waves, and the natural crystalline domain shape.
6.3 Polarisation and the χ(2)-tensor In the previous chapter we noted that the inner symmetry of the crystalline structure determines the nonlinear response for different polarisation states of the fundamental light relative to the crystal axes. Instead of one scalar factor, the second-order susceptibilities are therefore summarised in tensor form. Due to symmetry consideration, like the fact that inversion symmetry leads to a vanishing of the second-order term in the polarisation of the dielectric (see section 5.2), the majority of components in that tensor has usually a zero value. For stoichiometric Lithium Tantalate (the material of our sample), that belongs to the 3m (C3v ) crystal class (equally as e.g. LiNbO3 ), the second-order polarisation can be written in the form [74] Ex2 (ω) (2) Ey2 (ω) Px (2ω) 0 0 0 0 d31 −d22 2 E (ω) (2) z (6.5) 0 · Py (2ω) = ε0 −d22 d22 0 d31 0 2E (ω)E (ω) y z (2) d d d 0 0 0 31 31 33 Pz (2ω) 2Ex (ω)Ez (ω) 2Ex (ω)Ey (ω) where according to F. Charra and G. Gurzadyan [72] the nonzero components take the values (at 1058 nm fundamental wavelength) d22 ≈ 1.7 pm/V, d31 ≈ −1.0 pm/V and d33 ≈ −16 pm/V. Although the d33 component is the largest and yields the highest conversion efficiency for the SHG, it has no impact on our experiments because this component is only accessible (in our sample) for a propagation of the fundamental beam within the modulation plane, while we illuminate the sample from the transverse direction. However, from the position of the nonzero components in the tensor we can see that depending on the polarisation of the fundamental beam we will excite one or both of the following two possible SHG processes: Type I (e-oo), where two ordinary polarised waves generate an extraordinary second-harmonic wave and/or type 0 (o-oo), where two ordinary waves generate an ordinary second-harmonic wave. The effective nonlinearities for these two processes are derived using the approach given by F. Zernike in [94] (o)
def f = d22 cos(ϕ + 2γ) ,
(6.6)
def f = d22 cos α sin(ϕ + 2γ) + d31 sin α ,
(6.7)
(e)
where ϕ is the azimuthal angle measured counterclockwise from the x-axis, α is as before the diffraction angle inside the crystal, and γ stands for the angle that defines the polarisation of the input beam (γ = 0 for polarisation along the x-axis).
66
Nonlinear Bragg diffraction and toroidal waves
Effectively, we can generate two SH waves for every phase-matching order: an ordinarily and and extraordinarily polarised cone. As a result of the crystal symmetry properties, the polarisation of the ordinary conical wave is azimuthal [Fig. 6.3(d, left graph)] while the polarisation of the extraordinary conical wave is radial [Fig. 6.3(d, middle graph)]. For small angles α (when tan(α) � 1), the difference in the refractive indices of the ordinary and extraordinary waves can be neglected, the “ordinary” and “extraordinary” SH rings perfectly overlap and as a result the intensity of the conically emitted light does not depend neither on γ nor ϕ. In addition, its polarisation becomes linear [Fig. 6.3(d, right)]. For an fundamental polarisation of γ = 0 and γ = π/2, the polarisation of the SH wave coincides with the y-axis of the crystal, while for γ = π/4 the polarisation of the SH wave coincides with the x-axis. For relatively large angles α however, the ordinary and extraordinary conical waves propagate with different phase velocities [no > ne (α)] and at slightly different conical angles. In this case, the output polarisation depends strongly on the actual spatial overlap of the two rings since they are orthogonally polarised. Consequently, for longer crystals every diffraction order should appear as a doublet consisting of two orthogonally-polarised rings, especially in the case of the higher diffraction orders. Besides this transverse cone splitting, the polarisation dependence of the SHG process also leads to an azimuthal modulation of the intensity distribution of (o) (e) the SH cone. The generated SH intensity is proportional to [def f ]2 and [def f ]2 , respectively and hence depends on the polarisation of the fundamental beam defined by the angle γ. Since the two rings are orthogonally polarised the total intensity according to equation (5.12) is given as (o)
I2ω,m ∝ ` Iω h(m)
�2 h
i (e) (o) (def f )2 S (e) + (def f )2 S (o) ,
(6.8)
where (o,e)
S (o,e) = sinc2 (π`/2`coh )
(6.9)
(o,e)
takes into account the different coherence length `coh for ordinary and extraordinary polarised waves, and h(m) = 2/(πm) sin(πmD) is the lattice Fourier coefficient including the duty factor of the poling pattern D. In figure 6.4(b) we plot the de(o) pendence of the relative intensity log(I2ω,m ) (red dots) against the diffraction order m.
6.4 Experimental observations In experiments, we use a Ti:Sapphire oscillator and a regenerative amplifier as light source, delivering an intense beam of 140 fs pulses, with a repetition rate of 250 kHz and an average output power of 740 mW. The input beam is loosely focused with a 300 mm lens such that its waist at the input facet of the sample is 147 µm (FWHM) which, for the given input power, corresponds to a intensity of about
6.4 Experimental observations
67
(b)
4 3 2
1
∆km , µm
-1
2
1 0
0 -1
-1
-2
SH intensity
(a)
-3
-2
-4 -3
0
5
10
15
20
-5
Diffraction order
Figure 6.4: Far field image of experimentally observed second-harmonic rings. The x-axis is set horizontal. (a) For a fundamental beam directed exactly in the center of the annular structure the first several orders and 13-th order SH ring are seen. (b) Dependencies of the wave vector mismatch and the (o) predicted SH efficiency normalised to the first-order SH efficiency (log(I2ω,m ) in linear scale) as a function of the diffraction order.
100 GW/cm2 . Directed at the centre of the annular structure, the beam thus covers roughly 10 domain rings. We observe that the transverse illumination of the radial structure by the fundamental beam leads to the expected multiple conical emission of SH waves. Figure 6.3(b) shows the far field of the first two diffraction orders in form of rings. However, by calculating the transverse phase-mismatch with equation (6.4), we find that these inner rings are not phase-matched. Figure 6.4(a) shows a larger view of the SH rings for the fundamental wavelength of 822 nm, interestingly featuring one strong outer ring. The cone angles are measured by recording the ring diameter as a function of the distance from the sample. We thus find that the largest ring in figure 6.4(a) belongs to a cone with the emission angle of 45.6 degree (outside the sample), indicating that it is phase-matched for the 13-th order: Based on the data for the refractive index of SLT published by Nakamura et al. [91], we calculate the closest match as the 13-th phase-matching order at 836 nm fundamental wavelength with the cone angle of 46.4 degree. The small difference for the wavelength and angle can be explained with the absence of accurate Sellmeier coefficients for the ordinary index of refraction. The calculated longitudinal mismatch and relative intensity of the diffracted rings are plotted in figure 6.4(a) against the diffraction order m for λ = 836 nm. It can be clearly seen that the 13-th order SHG process is not only phase-matched in transverse but also in longitudinal direction (∆k13 = 0), and therefore yields the highest SH intensity. With the measurements presented in figure 6.5 we can analyse the 13-th order conical emission in more detail. In figure 6.5(b) we verify a quadratic dependence of the SH power of the 13-th SH ring as a function of the input power. From the maximum SH intensity obtained at 640 mW fundamental power (taking into account of all losses), we obtain the internal efficiency for the conversion process
68
Nonlinear Bragg diffraction and toroidal waves
SH output, µW
6
7
(a)
experiment model
5 4 3 2 1 0
(b)
6
SH output, µW
7
4 3 2 1 0
-15
-10
-5
0
5
10
0
15
100
Fundamental wavelength offset, nm
(c)
800
FF spectrum
810
820
Wavelength, nm
830
200
300
400
500
600
Fundamental power, mW
840
SH intensity, arb. units
FF intensity, arb. units
experiment square fit
5
SH spectrum
(d)
13th order SH-PM
1st order
400
405
410
415
420
Wavelength, nm
Figure 6.5: (a) Experimental measured (circles) phase matching curve and theoretical prediction (solid line) normalized to the maximum value of the SH signal experimentally obtained at λ = 822.5 nm. (b) Quadratic dependence of the 13-th order SH intensity on the fundamental power. (c) Spectrum of the fundamental radiation. (d) Spectra of the SH rings for non phase-matched (first-order) and phase-matched (13-th order) SH rings.
in the 13-th order SH ring of η13 = 0.0036%. This very low efficiency is not only due to the rather high order of the QPM interaction, but also has to be attributed to the fact that the duty factor of the poling pattern varies inside the crystal, leading to an effective length 2–3 times less than the real sample thickness. Nonetheless, the measured efficiency of the SH power generated in the non phase-matched firstorder ring is 220 times less than η13 . Our estimations show that for a 1 mm long sample operating in the regime of the first order QPM with a homogeneous 50% duty factor, theoretically a 10% efficiency could be achieved for the SHG process. The measured phase-matching curve for 822.2 nm shown in figure 6.5(a)(circles) is compared to the theoretical prediction∗ (solid line) based on the model by Saltiel, et al. [95] for a zero offset in the production of the grating and a poling duty factor of 0.748. The good qualitative agreement supports the conclusion that the difference in absolute wavelength is caused by inaccurate Sellmeier coefficients for SLT. In figure 6.5(c) we show the spectrum of the fundamental beam with a spectral width of ca. ∆ωF ≈ 8 nm (FWHM). The spectral width of the non phase-matched first and second order√ conical emission is close to the expected value for a stationary process ∆ωSH = 2∆ωF . In the case of the phase-matched 13-th order ring however, the SH spectrum is almost two times narrower with ∆ωpmSH = 1.3 nm (FWHM). This is the direct consequence of the group-velocity mismatch explained in the previous chapter (see section 5.3). For the spectrum of the 140 fs long funda∗
These theoretical calculations have been done by Solomon Saltiel.
6.5 Toroidal waves
69
Figure 6.6: (a,b) Experimentally measured intensity distribution of m = 1 and m = 13 SH rings. (c) Theoretical prediction for the azimuthal intensity distribution of the phase-matched 13-th order SH ring based on equation (6.8).
mental pulse we can calculate a group-velocity-mismatch length of 92 µm, what is a half of the expected effective length of the sample. The reduction of the spectral width in the conversion process goes along with a lengthening of the SH pulse duration compared to the fundamental pulse of correspondingly ca. factor 2, an effect that will be discussed in the next chapter a bit more in detail. Figure 6.6 demonstrates how the superposition of the two SHG processes o-oo and e-oo shape the azimuthal intensity distribution of the 13-th order conical emission. The three-dimensional plot in figure 6.6(c) shows the predicted intensity profile of the total emitted SH calculated with equation (6.8). We see that the average trend of the experimentally measured azimuthal intensity distribution in figure 6.6(b) is in good agreement with these theoretical prediction, confirming the accuracy of the model. However, as can be clearly seen in figure 6.6(a,b) as well as in the figures 6.3(b) and 6.4(a), the SH rings exhibit an additional azimuthal modulation with six welldefined peaks. These peaks are insensitive to the input polarization and intensity, and they are observed even in the regime of linear diffraction of the fundamental beam on the weak surface relief (remaining from the sample etching), indicating that this artefact is a result of the sample structure. In fact, these SH maxima in the far field can be attributed to the Fourier transform of the basic hexagonal domain shape in SLT crystals. As emphasised in the review of the periodic poling procedure and evident in the magnified photo of the sample in figure 6.2, the domains tend to retain this hexagonal shape during the poling process and thus the circle pattern is actually approximated at the single domain scale with angles of 120 degree [90].
6.5 Toroidal waves From the phase-matching conditions depicted in figure 6.3(c) and the plot 6.4(b) we can see that the longitudinal phase-mismatch continuously increases for phasematching orders higher than 13. Nonetheless, � we can excite the highest possible SH phase-matching order mmax = n2ω Λχ(2) /λSH ≈ 42 inside the sample if the momentum is conserved by the interaction of two counterpropagating fundamen-
70
(a)
Nonlinear Bragg diffraction and toroidal waves
(b)
2ω
x
ω B
A
(c)
y
z
g kω
A
k2ω kω B
2ω
Figure 6.7: (a) Schematic representation of the SH emission originating from two counterpropagating pulses along the z-axis. (b) Phase-matching diagram for the case of two photons with opposing propagation direction. (c) Photo of the experimental generated toroidal wave (blue spot) from the transverse direction towards the fundamental beam (λ1 = 830 nm). All other light in the picture is scattered from the fundamental beam at the sample surfaces and sample holder.
tal photons and consequently the longitudinal phase-mismatch ∆km = 0 vanishes completely. The phase-matching diagram in figure 6.7(b) makes clear that in this situation the generated SH wave will propagate in the transverse direction to the fundamental beam. Such transverse SHG is a very challenging nonlinear effect [96, 97]. For a first order phase-matched process it requires a χ(2) modulation period smaller than the fundamental wavelength, which is technically difficult to achieve. As an example, in our case of SLT as material and a fundamental wavelength of 830 nm, the firstorder PM period would be Λχ(2) = 183 nm. On the other hand, for higher order phase-matching like in our experiment, the conversion efficiency is usually very small and therefore the SH signals extremely weak. So far, the transverse SHG has been observed mostly in thin (1 − 2µm thick) quantum-well waveguide structures [98– 100] where the process is solely phase-matched in one direction perpendicular to the fundamental beams. The recorded signal is therefore often referred to as surface emitted SH. In contrast, the annular periodically poled crystal provides the required phase-matching equally for all azimuthal angles and we therefore expect to observe a transverse SH emission in all directions of the x-y plane perpendicular to the fundamental beams. Due to the phase-matching restriction, where two counterpropagating photons have to interact in order to conserve the momentum, the SH is emitted only from the region and duration of the pulse overlap. This spatiotemporal confinement of the SHG process leads to the emission of a SH wave in form of an expanding toroid additional to the conical SH waves that are generated by each of the two beams separately, as it is schematically illustrated in figure 6.7(a). Along the axis of the propagating beams, the interaction area and therefore the intensity profile of the toroidal wave (I2ω ∝ Iω2 ) is defined solely by the temporal
6.5 Toroidal waves
71
overlap of the fundamental pulses where 2
Z
∞
Iω (τ ) = hA (τ )i =
IA (t + τ )IB (t)dt
(6.10)
−∞
represents exactly the correlation of the pulses A and B. This phase-matching geometry results therefore in a mapping of time (τ ) into a space coordinate (s) via the simple relation τ = s 2no /c, where no is the ordinary refractive index of SLT, and c is as usual the speed of light in vacuum. The fine fringes in A2 (τ ) are in the range of a few nanometre, what is just a fraction of the SH wavelength, and therefore average out in measurements. The width and intensity profile of the SH toroid in transverse direction, that is in propagation direction of this SH wave, depends on a variety of factors: One is the profile of the spatial overlap of the two fundamental beams, another the duration or temporal length of the interacting pulses. Furthermore, we have seen that the narrow phase-matching bandwidth in our previous experiments results in a lengthening of the SH pulse length by factor 2. By controlling these parameters and the χ(2) modulation properties it is thus possible to design the exact shape of the expanding toroidal SH wave. In our experiments we use pulses from the same regenerative Ti:Sapphire amplifier as before, but now operating at a wavelength of 830 nm. The system delivers linearly polarized 165 fs long pulses of an energy up to 3 µJ at a repetition rate of 250 kHz. The beam with a Gaussian spatial profile is split in a polarising beam splitter and directed from both sides into the sample such that the same pulses meet roughly in the centre of the periodically poled structure. A set of λ/2 plates allows us to control the relative powers of both beams and their polarisations. The average beam power before the beam-splitter has been measure to be about ∼ 340 mW. Both beams are loosely focused in the sample to a waist of 160 µm. The emitted transverse SH signal is recorded by a CCD camera mounted above the sample. Figure 6.7(c) shows a photo that due to the higher repetition rate of the laser compared to the exposure time of the camera integrates over several thousand SH waves. From a similar but calibrated experimental photo we∗ measured the thickness of the toroidal wave to be 34 µm, corresponding to 160 fs assuming a secant hyperbolic temporal pulse shape. Since the fundamental beam waist is much bigger than the spatial extent of the pulse, the thickness of the toroidal wave in its propagation direction is determined by the fundamental beam profile and is estimated to be about 370 µm outside the sample. However, as a mean for pulse characterisation this technique has several drawbacks. Primarily, this is the high power requirement due to the very low efficiency of the SHG process. Not only causes the high phase-matching order (possibly the highest reported so far [96]) a very low SH signal, but also is it not possible in this configuration to make use of the largest component of the χ(2) tensor, namely d33 . Furthermore, the narrow phase-matching bandwidth as seen in figure 6.5(c) limits the use of any sample with a fixed period to practically one wavelength, especially ∗
This measurement was done by Dragomir Neshev and Solomon Saltiel
72
Nonlinear Bragg diffraction and toroidal waves
since the necessary broad beam excitation hinders a homogeneous thermal tuning of the sample.
6.6 Conclusion from non-collinear SHG in periodically poled structures In this chapter we gave a survey over one method to periodically pole stoichiometric Lithium Tantalate as it is equally used for Lithium Niobate. With this process it is possible to spatially controlled flip permanently the orientation of the crystal domains and thus to modulate the sign of the χ(2) nonlinearity. In this context we emphasised the tendency of the domains to remain their hexagonal shape that later proofed to have an impact on the SH emission profile. We then probed an annular periodic poled sample of SLT along the crystal z-axis and observed conical SH waves. The cone angels thereby depend on the transverse phase-matching conditions – given by the ratio of the SH wavelength to the poling period – and satisfy exactly the Bragg relation. For the case of two counterpropagating pulses, where the momenta of two interacting photons propagating in opposing directions cancel out, we could additionally observe the phase-matched emission of toroidal shaped SH waves. The transverse profile of these toroidal waves is determined by the correlation of the fundamental pulses and allows to estimated the fundamental pulse duration. Looking at the output of the nonlinear processes we can see that the annular symmetry of the structure is mostly conserved in the SH emission profile – with two exceptions: 1) The origin of the six peaks on the SH cone intensity profiles could be traced back to the basic hexagonal shape of the crystal domains. The circular pattern of the sample is therefore approximated at domain scale in 120 degree angles [Fig. 6.2(right)]. 2) At a even smaller scale the crystalline structure determines the polarisation dependence of the frequency conversion process, leading to two simultaneously occurring SHG processes (o-oo and e-oo). The superposition of the thus generated ordinary and extraordinary SH waves leads to an azimuthal modulation of the SH intensity distribution as seen in figure 6.6(b,c). Consequently, for the reported experiments the effective material modulation determining the SH emission profile is a combination of the poling-, domain- and crystalline structure. More general we can say that similar to the way the photonic band-structure governs the propagation dynamics of light beams in nonlinear material with periodic index modulation, the phase-matching conditions in periodically χ(2) modulated materials govern the shape of the SH emission. This similarity is underlined by the prominent appearance of the Bragg relation in both system, which also points to the common underlying reason for the beam shaping in both cases: constructive interference. Furthermore, the discretisation of the propagation constant β into eigenvalues of the periodic systems (in the case of index modulation) resembles the discretisation of the observed SHG process into phase-matching orders in periodically poled materials.
6.6 Conclusion from non-collinear SHG in periodically poled structures
73
So far, we only considered modulation geometries that had a fixed periodicity in either a Cartesian or a polar coordinate system. In the next chapter of this thesis we will contrast these systems with a two-dimensional disordered structure. In opposition to the intuitively expected vanishing of all phase-matching and thus the suppressing of SH generating processes we will find that disorder can actually benefit the frequency conversion in different aspects.
CHAPTER 7
Second-harmonic generation in disordered nonlinear material
When Arthur Ashkin discovered the photorefractive effect in 1966, he actually was looking for a SH emission from the crystal – but found instead a distorted laser beam profile. Ironically, just the opposite happened to a Spanish group of researchers last year: Directing a pulsed laser beam on a SBN crystal, they hoped to observe the formation of a spatial soliton based on the very same photorefractive nonlinarity that we employed in chapter 2 to 4 of this thesis. Yet what they got to see was a line of bright green SH light illuminating the wall. It almost seemed like nature had lately changed its mind – why did the Spanish group get to see the SH emission Ashkin and his team were looking for? It turned out that a small negligence had occurred at the company where the crystal was grown. Usually, each crystal is heated to ca. 70 degrees and biased with a high voltage over several hours before it is shipped to the customer. However, the crystal that was sent to the Spanish group somehow had skipped this processing step unnoticed and thus showed the unintended, yet not less welcomed behaviour noted above. To understand the impact of this processing step and the origin of the SHG in SBN, it is essential to have a second brief look into this material.
7.1 Domain Structure in Strontium Barium Niobate The photographs in figure 7.1(a) were first published in Romero, et al. [101] where the authors analysed the structural properties of SBN. The pictures show the domain structure of the crystal as it grows ‘naturally’ in chemical laboratories. Since the domains have all identical linear properties, they could not be seen on a normal photograph of the polished material. For this picture therefore the boundaries of the domains have been made visible by etching the sample [102]. There are three main aspects inherent to this domain structure, two of them being well apparent in figure 7.1(a): • The domains are elongated along the crystal c-axis. This leads to a finer modulated structure in the x-y plane compared to modulation along the c-
7.1 Domain Structure in Strontium Barium Niobate
(a)
(b)
75
χ(2)> 0
χ(2)< 0
Figure 7.1: Domain structure of SBN. Photos of crystal [101] in (a, left) xcut, with elongated domains along the c-axis and (a, right) z-cut, showing the varying domain sizes and the disordered structure. (b) Schematic comparison of a strictly periodic structure to natural domain poling in SBN. The grey arrows illustrate grating vectors.
axis, which is of significantly larger scale. In the following we will see that the structure in c direction has practically no impact on the effects observed in experiments [103]. We therefore can consider this system as quasi twodimensional. • Domain sizes in the x-y plane∗ vary strongly and the domain packing is random. • What can not be seen on these photographs are the nonlinear properties. Due to the tetragonal unit cell of the crystal, the needle-like domains are either parallel or anti-parallel ferromagnetic orientated along the crystal c-axis. Thus the sign of the second-order nonlinearity χ(2) alters from domain to domain in the x-y plane. This provides a ‘natural’ two-dimensional poled structure. The term ‘natural’ is here used in the sense that it is not technical designed and controlled. Nonetheless, it would be presumptuous to conclude that the lack of human influence would automatically make the structure inferior. In fact, with the modern technical facilities for crystal poling† it is not possible to reproduce such a fine structure at the scale of these domain sizes. In order to gain a strong and homogeneous photorefractive effect, the anti-parallel ferromagnetic orientation of the domains has to be overcome. For this reason the crystal growing company employs the treatment mentioned above: By heating the crystal and applying a strong external electric field most of the domains are reorientated in one direction along the c-axis, leading to a uniform poling of the crystal. This processing step is hence just the opposite of the periodic poling discussed in the previous chapter – it aims to erase the already existing poling structure. In turn, without the treatment the crystal remains with a fine random poling pattern. The last point hence partially explains the emission of SH radiation. An alternating sign of χ(2) in the structure is needed to achieve phase-matching for this ∗
Please note that the x, y and z = c coordinates in this chapter are given by the crystal geometry and do not coincide with the coordinates used in chapter 2 to 4 where we concentrated on the optically induced structure rather than the crystal itself. † Technical stand in 2007.
76
Second-harmonic generation in disordered nonlinear material
process. However, for efficient SHG this alternation has to be of a specific period which has to match the phase difference between the SH and the fundamental wave. But no such single period is evident in figure 7.1(a). The schematic in figure 7.1(b) illustrates this situation. An ordered periodically poled crystal as depicted on the left side can efficiently phase-match exactly one frequency in forward direction. On the right side a sketch of the natural structure in SBN crystals is drawn, reflecting that of the photo 7.1(a, right). In contrast to the ordered sample, no single periodicity dominates the formation. Instead, the disordered modulation provides a continuous set of phase-matching gratings with various periods and in all directions of the x-y plane. As a result, for any fundamental wavevector kω of light propagating through the crystal there will be also a matching grating vector g in this plane to fulfill the phase-matching condition k2ω = 2kω + g. Furthermore, this is not limited to SHG but is equally valid for any other second-order parametric process such as sum frequency mixing or difference frequency mixing [74]. From the three structural aspects listed and discussed above thus follow four noteworthy properties of the SHG in SBN: • Within the set of grating vectors, different periods are available to phasematch SHG for light of different wavelengths. Theoretically, the frequency limitations of this process are only set by the crystals transparency window of λ = 0.4 µm to approximately 4 or 6 µm (the specifications of manufacturers differ in this point; in figure 7.4(a) we plot our own measurement of the absorption within the available range of our facilities). However, due to a lack of sources for longer wavelengths, we could experimentally verify phase-matched SHG only up to a wavelength of 1.55 µm (C-band in telecommunication technologies). Other literature reports on this subject cover continuously the wavelengths from 0.7 up to 1.2 µm [101, 104]. Since the probability for different periods varies only slowly, the directly linked SHG efficiency as a function of the fundamental wavelength can be considered as practically constant over the range of several tenth of nanometres. As a result, the disordered domain structure provides achromatic phase-matching, meaning that all frequencies are converted with equal efficiency. • As mentioned before, non collinear phase-matching requires not only a grating vector g with a transverse component towards the direction of the fundamental wavevector, but also a finer grating compared to forward phase-matching of the same frequency. Both requirements are fulfilled in the disordered structure and hence SHG can be observed in all directions of the x-y plane for a fundamental beam propagating in that plane. However, this effect differs significantly from the phase-matching in completely random material. For instance, the SH generated in KTP powder is radiated in the full solid angle. While the powder thus shows isotropic properties in all three dimensions, the quasi two-dimensional modulation in unpoled SBN crystals confines the SH emission into a plane, or, as will be demonstrated later, a cone.
7.1 Domain Structure in Strontium Barium Niobate
77
• In contrast to periodic structures like the square lattice discussed in chapter 3, where a translational invariance is limited to shift of integer values of the lattice period, the disordered structure features full translational invariance. Although locally at domain scale the phase-matching condition might differ for two places in the crystal, the average phase-matching situation for any reasonable large propagation length of the fundamental beam is equal everywhere in the crystal. • The advantages listed before come to the price of a rather low conversion efficiency as a natural tradeoff. These properties – especially of the first two of them – and their combination bring in a couple of technical advantages that are worth to be discussed a bit more in detail. Achromatic phase-matching is a property highly desirable for all-optical devices that could convert different wavelengths in the same material with equal efficiency. That is e.g. interesting for the all-optical processing of wavelength division multiplexed (WDM) signals in telecommunication technologies. It also proofs very useful in systems with tunable laser wavelength, where the strength of the SH response from the unpoled SBN is independents of the adjusted wavelength. Furthermore, no angular or temperature tuning of the crystal is needed when the working wavelength is changed. The most interesting applications of achromatic phase-matching are probably found in the context of ultra-short pulses. Due to the fundamental uncertainty principle, the spectral bandwidth of a pulse naturally increases as the pulse duration becomes shorter. This relation is known as the time-bandwidth product of a laser pulse and the corresponding limiting factor can be calculated with the Fourier transform. To give an example, commercially available fibre laser around 1560 nm can produce pulses of ca. ∆τ = 50 fs (FWHM). If these pulses were exactly sech2 -shaped, the minimal time-bandwidth product is given by ∆τ ∆ν ≥ 0.315 and hence the spectral bandwidth would expand over more than 100 nm (FWHM). In reality though, such short pulses are often strongly deformed in the compression process. In other experiments, we generated soliton-compressed pulses with ∆τ = 23 fs (FWHM) which had a spectral bandwidth of still more than 40 nm at a fundamental carrier frequency of 1550 nm [105]. This stands in direct contrast to the narrow bandwidth provided by most efficient SH generating techniques. For instance, the SHG process in the annular poled SLT sample employed in the previous chapter resulted in a two times narrower SH spetrum and therefore in a two times longer SH pulse length compared to the fundamental pulses [see section 6.4, esp. Fig. 6.4]. The SH signal of a ultra-short pulse generated in a regular frequency converting element with often sub-nanometre bandwidth will thus have a strongly reduced bandwidth with the unavoidable consequence of a far longer SH pulse duration. In view of the evident need to overcome this phase-matching bandwidth problem for ultra-short pulses, the research community has recently generated a variety of solutions. Two examples are chirped gratings [106, 107] and aperiodic optical
78
Second-harmonic generation in disordered nonlinear material
superlattices [108] that are used as poling patterns in e.g. LiNbO3 crystals∗ . These and many other techniques have in common that the strict periodicity of the poling structure is broken and replaced by a combination or superposition of many periods. Following this idea consistently, the two-dimensional disordered medium marks the other extreme of the approach. While thus the technical optimal solution will be located somewhere in between these extremes, balancing the high efficiency of periodicity with the broad bandwidth of disorder, the study of SHG in disordered structures gives valuable insight in the fundamental physics behind this method. For instance, the results presented in this chapter could already advance the development of poling structures with a designed phase-matching spectrum, where the bandwidth of these devices was set by controlling the degree of randomness in the pattern [110]. Non-collinear phase-matching is often associated with the spatial walk-off that occurs with critical phase-matching techniques in birefringent crystals. In this situation it is usually not appreciated, because the fundamental beam and the SH field lose their spatial overlap during propagation. In effect, the useful interaction length and thus the conversion efficiency is reduced, while the spatial profile of the SH beam broadens and thus the SH beam quality suffers (see section 5.3). Besides this rather negative association, non-collinear SHG can have several practical advantages like e.g. the spatial separation of the SH wave from the fundamental beam that simplifies the SH signal detection. Furthermore, it can be used to resolve spatially the SH signal according to its wavelength, as it is applied in the pulse characterisation technique GRENOUILLE [111] or for signal routing in twodimensional PPLN [84]. In the last chapter we also discussed how transverse SHG from two counter-propagating pulses can be used to generate toroidal waves and to characterise the temporal profile of laser pulses. The same effect can be generated in the disordered domain structure of SBN, with the additional advantage of achromatic phase-matching, as will be shown later in section 7.5. The full translational invariance translates in practical applications to a strong robustness of the nonlinear process against misalignment. An equal phasematching situation everywhere in the crystal is not only convenient under experimental conditions but has high technical significance as it simplifies the assembling and handling of the devices. The fourth point, the low conversion efficiency is often regarded as a disadvantage. And indeed, it is the primary reason why since the first report on the observation of broadband SHG in SBN [104] the interest in this technique has been rather limited. Even that particular publication concentrated on methods to increase the efficiency for a single frequency by optically inducing a periodic structure into the material. However, a low conversion efficiency means also a low depletion of the fundamental wave. This aspect is of particular importance for measurement application where the fundamental beam has to be analysed with minimal distortion and losses. ∗
Achromatic phase-matching can also be achieved in birefringent crystals (typically BBO): A broadband light pulse is angularly dispersed such that each frequency component propagates in the nonlinear crystal with its individual phase matching angle [109].
7.1 Domain Structure in Strontium Barium Niobate
79
The observed low efficiency of the SHG process is not only due to a broad phasematching bandwidth and the distribution of the SH signal in space. Statistics of the domain sizes show that the diameter of the domains in the x-y plane vary between 0.5 and 7 to 8 µm, with a peak of the distribution at around 2.5 µm [101, 112]. On the other hand, the coherence length for the SHG varies between 0.1 and 1.5 µm. The harmonic generation in this structure is therefore generally based on higher order phase-matching, especially for the non-collinear cases which require smaller grating periods than the forward phase-matching. Similar to the anisotropy of the photorefractive effect in SBN, the strength of the SH generating process depends on the polarisation of the fundamental light wave toward the principal axis of this crystal. As discussed in chapter 5.1, this process is governed by the second-order electric susceptibility χ(2) which varies strongly along the different crystal axis. Analogue to Litium Tantalate considered in the last chapter, the respective values for the x, y and z = c axis are summarised in a tensor. Strontium Barium Niobate belongs to the 4mm (C4v ) crystal class, so that the second-order polarisation P (2) of the dielectric material can be written in the form [74] Ex2 (ω) (2) Ey2 (ω) Px (2ω) 0 0 0 0 d31 0 2 (ω) E (2) z 0 0 d31 0 0 · (7.1) Py (2ω) = ε0 0 2Ey (ω)Ez (ω) (2) d d d 0 0 0 31 31 33 Pz (2ω) 2Ex (ω)Ez (ω) 2Ex (ω)Ey (ω) where the nonzero components d33 ≈ 17.7 pm/V is almost twice as large as d31 ≈ 9.4 pm/V [72](data for 1064 nm fundamental wavelength). This means that the highest conversion efficiency will be achieved for light polarised along the c-axis (only Ez2 (ω) 6= 0, extraordinary polarisation) since it makes use of the largest tensor element d33 . Hence the wavevector of the corresponding fundamental field stands normal to the c-axis (kω ⊥ z) and the light is propagating in the x-y plane. On the other hand, the orientation of the wavevector within this plane has no impact on the efficiency. Along any propagation direction in the plane the build-up of the SH field depends solely on the phase matching condition – which is isotropic in x and y since the disorder of the domain structure has no directional preference. However, according to the non-zero elements of the χ(2) tensor, SHG can also be achieved for light polarised perpendicular to the c-axis (ordinarily polarised), although the resulting SH signal will have an approximately four times weaker intensity. A second look at the position of the non-zero elements in the tensor makes clear that a linear polarisation of the fundamental field along any of the crystal axis will lead to extraordinary polarised SH emission. Ordinarily polarised SH light can only be generated from mixed polarisation states of the fundamental. We could demonstrate this fact in a detailed study of the polarisation properties of SHG in unpoled SBN – in collaboration with the Spanish group that was mentioned in the introduction of this chapter [113]. However, in contrast to the case of the SLT sample, the polarisation states in our experiments with SBN have no impact
80
Second-harmonic generation in disordered nonlinear material
(a)
ω
(b)
(c)
2ω ω
Figure 7.2: SH emission for a beam propagating in the x-y plane of the SBN crystal. (a) Schematic representation of the domain orientation to the fundamental beam, leading to the phase matching condition depicted in (b), where red and blue arrows indicate the fundamental and SH wave vector, respectively, and grey arrows stand for the reciprocal grating vector. The four cases are exemplary only, quasi phase-matching is given in all direction in the x-y plane. (c) Photo of the SH emission in experiment, where the blue lines are either reflections or scattering of the SH at the sample holder and the crystal facets. The red arrow represents the fundamental beam.
on the emitted SH profile (except the overall efficiency), and hence those details are not in the scope of this thesis. After this structural analysis of the nonlinear material, we will now study experimentally the impact of disordered two-dimensional modulation on the SH emission and discuss how to make use of the advantages that result from this structure. The experiments are categorised in four cases, namely a single pulse propagation perpendicular to and along the c-axis and the interaction of counterpropagating pulses for the same two directions. As just discussed, the largest efficiency is to be expected for the fundamental beam propagating in the x − y plane, that is directed perpendicular to but polarised along the c-axis. We therefore start with this configuration before we turn the crystal 90 degree to the weaker emission of the beam propagating along the domain orientation. The same two-dimensional modulation leads in these two cases to very different phase-matching conditions with distinct shapes of the SH emission. By repeating both crystal orientation with counterpropagating pulses, we find that in the region of interaction, where the two pulses overlap, the SH signal is not just simply four times higher due to the doubled intensity, but that the cancelling out of the momentum of two couterpropagating photons generating SH leads to yet another phase-matching situation with its own characteristics.
7.2 SH emission in a plane, kω ⊥ z The Spanish group that was mentioned in the introduction of this chapter was actually not the first ‘to see the light’. Moshe Horowitz and Baruch Fischer studied the broadband SHG in SBN already in the early 90’s [104, 114]. Yet the interest in this technique suffered under the rather low conversion efficiency in this material, and the relevance of this approach for ultra-short pulses was not commonly recog-
7.2 SH emission in a plane, kω ⊥ z
81
nised. The more recent development of sources for laser pulses with only femtoseconds duration changes this situation in two ways: One is the already discussed need for a broader phase-matching bandwidth for ultra-short pulses, the other is the fact that the concentration of the pulse energy in such a short event leads to extremely high peak intensities. To give an example, the mode-locked titanium:sapphire laser we used in the following experiments generates an average laser power of approximately just Pav ≈ 0.5 Watt. Due to the pulse duration of ∆τ ≈ 150 fs and a repetition rate of frep = 76 MHz, the peak power Pp in this laser beam is almost Pp = Pav /(∆τ frep ) ≈ 44 kW. Since the nonlinear process that generates SH is almost instantaneously, such extremely high fields of the short pulses lead to a strong polarisation of the dielectric which in turn leads to a much higher efficiency of the nonlinear process. This new situation motivated us to measure again the efficiency of the SHG in SBN – yet this time for femtosecond pulses. Our experimental setup consisted of a Coherent Mira femtosecond oscillator with the characterisitcs mentioned above, which is tunable within the range of 700 to 900 nm, a lens with 50 mm focal length and an unpoled SBN crystals of the dimensions 5 × 5 × 10 mm. The beam was focused inside the nonlinear material to a focal spot of 74 µm diameter (FWHM). All sides of the crystal where polished, allowing the observation of the SH radiation from different directions. The power of the SH emission was measured with a regular power meter (Ophir NovaII), while the spectral properties of the fundamental beam and the SH radiation were monitored by a spectrometer (Ocean Optics HR2000) with an average resolution of 0.3 nm. As the first configuration we consider the fundamental beam propagating perpendicular to the domain orientation as shown in figure 7.2(a). All available grating vectors for phase-matching thus lie in the x-y plane, resulting in a SH emission in theoretical all directions of this plane. However, the phase-matching diagram in figure 7.2(b) makes evident that for an increasing angle between the SH wave vector and the direction of the fundamental beam, the reciprocal grating vector g has to become longer. This means that the required grating periods have to become smaller, for large angles ϕ � π/2 even smaller than the fundamental wavelength. Consequently, the SH emission for large ϕ is due to a higher order processes than the forward phase-matching, leading to a relative weaker SHG. In fact, we could not observe any noticeable SH signal in the exact backward direction. The SH light scattering at the crystal input facet in figure 7.2(c)(left crystal facet in photo) is forward SH reflected at the crystal output facet (right side). Nonetheless, the photo shows clearly the rather homogeneous distribution of the SH signal in all direction of the x-y plane. To measure the intensity of the generated SH, we covered the detector of the power meter with a short-pass filter, thus minimising the contribution of scattered fundamental light to the signal. The remaining fundamental background has been eliminated by subtracting from every measurement the signal strength for the not mode-locked laser, which produces the same amount of scattering yet practically no SH. The femtosecond conversion efficiency can then be calculated as the ratio of the generated average SH output power and the average input power of the fundamental. In figure 7.3(a) we plot the SHG efficiency against the power of the
82
(a)
Second-harmonic generation in disordered nonlinear material
(b)
(c)
c
(d)
c
(e)
2 mm
Figure 7.3: (a) Measured efficiency of the SHG process (in percent) for the fundamental propagating in the x-y plane (kω ⊥ z) as a function of average input power. The green dotted line marks the expected linear dependency (slope of one in double-logarithmic plot), while the red dashed line corresponds to a quadratic dependence (slope of two). Squares indicate the measured divergence of the fundamental beam outside the crystal (in rad). Top and front view of SH emission at (a,b) 250 mW, and (c,d) 450 mW respectively.
fundamental wave for three different wavelength of 820, 840 and 860 nm. Because of difficulties in collecting all power of the generated SH signal at the detector simultaneously, only energy emitted in one of the transverse directions is measured. Within the error of the measurement∗ the efficiency for all these three wavelength are equal, underlining the achromatic nature of the phase-matching. Furthermore, the graph shows that for low input power the efficiency increases linearly with the power of the fundamental ( |E(ω)|2 ), as it is expected for the quadratic SH process. However, for power values exceeding 250 mW, the dependence becomes quadratic (red dashed line). This unusual increase in efficiency goes along with a broadening of the fundamental beam, indicating a nonlinear self-focusing. In order to quantify this effect, we recorded the divergence of the fundamental beam outside the crystal as a function of the input power and plotted it in the same graph (pink squares). The beam divergence is inversely proportional to the size of the focal spot inside the crystal. Thus, an increased divergence indicates a smaller focal area with consequently higher intensity, leading to a stronger nonlinear response. And indeed, the graph shows that the change of the slopes for the beam divergence and the conversion efficiency roughly coincide. As recoded in figure 7.3(a), the observed maximum efficiency of the SHG process is close to 0.1%. We note that the radiation coming out from the top surface and recorded by the power meter is only a fraction of the whole signal emitted in this ∗
After every change of the wavelength the laser had to be reoptimised and the same average power might not necessarily indicate an identical peak power.
7.3 Thermal lensing
83
plane. Due to the total internal reflection almost half of the generated SH light is trapped inside the crystal and only the emission at the angles 90 ± 23 degree is collected by the power meter. After accounting for the whole generated SH signal, the total conversion efficiency for the fundamental propagating in the x-y plane is estimated to be about 0.38%. This value exceeds previously reported results due to the high concentration of energy in time (femtosecond pulses) and in space: in the self-focusing region, beam intensities reach the order of 10 GW/cm2 . A comparison of the SH emission profile seen from the top of the crystal at low [250 mW, Fig. 7.3(b)] and high [450 mW, Fig. 7.3(d)] fundamental powers supports the conclusion that the increased SH signal strength originates from the self-focusing region. Figure 7.3(d) is attenuated compared to (b) in order to avoid saturation of the CCD signal. It shows how the SH signal is stronger around the focus point, while for low power the SHG process has everywhere the same strength along the beam path. Comparing for the same two power levels the SH emission in forward direction [Fig. 7.3(c,e)] we see that the SH line at high power is broadened as if the light passed through a lens. Interestingly, a part of the non-collinear generated SH light is focused by this lens into forward direction, building the bright spot in figure 7.3(e). The measurement of the SH emission in from the top of the crystal [Fig. 7.3(b)] includes another interesting aspect of the non-collinear phase matching in disordered structures: In a mono-periodic poled crystal designed for forward phase-matching, the SH field builds up coherently and thus the SH power increases proportional to the square of the propagation length of the fundamental wave. In contrast, the SH signal measured in transverse direction from the crystal is an incoherent superposition of contributions generated throughout the sample. As a result, the strength of the total SH emission depends linearly on the propagation length of the fundamental beam in the crystal. The observed self-focusing of the fundamental beam does not only affect the conversion efficiency but also has an impact on the SH emission profile – as already seen in figure 7.3(b-d) – and even the spectral properties of the light. It generates an additional modulation of the nonlinear material; yet other than the disordered alternation of the sign of the χ(2) nonlinearity, this modulation is a local increase of the refractive index. However, before we study how the resulting lensing effect modifies the properties of the SH emission, let us first clarify its origin.
7.3 Thermal lensing Since the SBN crystal is not biased and the domains are orientated randomly, the photorefractive effect in this material is negligible under our experimental conditions. Furthermore, the single pulse power is less than the critical power for self-focusing due to the electric nonlinearity of SBN [73]. An alternative source for the refractive index increase is thermal nonlinearity. The measured absorption characteristic of our sample in figure 7.4(a) shows that the transparency window of this material ends abruptly at around 400 nm. From
84
Second-harmonic generation in disordered nonlinear material
Transmission in %
80
(a)
(b)
60
40
20
0 200
300
400
500
600
700
800
900 1000
wavelength (nm)
SH frequency (l/cm)
SH frequency (1/cm)
Intensity (arb. units)
24000
24400
24800
SH frequency (1/cm) 25200
(c)
12000
24000
24400
24800
25200
12200
12400
12600
(d)
12200
12400
FF frequency (1/cm)
12600
12000
FF frequency (1/cm)
Figure 7.4: Spectral broadening due to the thermal lens, induced by twophoton absorption. (a) The transparency window of SBN ends abruptly at around 400 nm. (b) Two SH spectra for equal peak intensities but different average powers. The stronger spectral broadening at higher average power indicates a thermal origin of the nonlinear self-focusing. (c,d) SH (blue, with dots) and fundamental (red, solid line) spectral shapes measured at the output facet of the crystal at (c) 83 mW and (d) 566 mW.
this we can expect to observe two-photon absorption for fundamental wavelengths shorter than 900 nm. The two-photon absorption in turn heats locally the material which has a strong dependence of the refractive index on the temperature, especially when it comes close to the phase-transition temperature of 60 − 90◦ C (depending on the doping). Thus the two-photon absorption in SBN can lead to a thermal self-focusing [115], which increases locally the fundamental intensity and results in stronger nonlinear effects. Compared to the practically instantaneously SHG process that depends on the peak power of the laser beam, the heat accumulation in the material is a rather slow effect in the range of milliseconds and depends on the average power of the fundamental beam. An easy way of testing the thermal nonlinearity as origin of the self-focusing is therefore to compare two beams with identical peak power but different average powers. Experimentally this is realised by inserting a rotating chopper wheel into the setup, stopping the beam for half of the time (50% duty cycle), and thus effectively reducing the average power by two. As a result, we observe that the divergence of the fundamental beam decreases, proofing the dependence of the self-focusing on the average power and thus indicating a
7.3 Thermal lensing
85
thermal origin of the self-focusing. More convenient and sensitive than measuring the divergence of the fundamental beam is the recording of the beam spectrum. Due to the very high intensities in the self-focusing region, also third-order nonlinearities come into play, leading to a selfphase modulation of the fundamental pulses and a spectral broadening by Kerr nonlinearity. This is illustrated in figure 7.4 where the spectrum of the pulse at high power [566 mW, Fig. 7.4(d)] is significantly broadened compared to the spectrum measured at lower intensities [83 mW, figure 7.4(c)]. Since the Kerr nonlinearity has a cubic dependence on the fundamental field [∝ E 3 (ω)], it is very sensitive to the intensity increase that results from the self-focusing. We therefore repeat the experiment with the chopper wheel while measuring the spectrum, finding another confirmation for the slow response of the lensing effect. Figure 7.4(b) shows clearly how the spectral broadening of a beam (grey line) is reduced when the chopper wheel halves the average power (black line). The appearance of a thermally induced lens represents an (unintended) complex interplay of two-dimensional modulation and nonlinearity. To keep things apart, we briefly repeat the four different types of nonlinearity and two types of modulation involved in the process as a chain of events: 1. The two-photon absorption in SBN for a given wavelength depends quadratically on the input peak intensity, and the square of the imaginary part of χ(3) . This fast process transforms the optical energy in thermal energy. 2. On the other hand, the accumulation of the thermal energy is a rather slow process that leads to a local heating inside the crystal. Since the refractive index of SBN depends strongly on its temperature, this heating induces a spatial modulation of the refractive index [115] – not to be confused with the photorefractive effect. The thermal self-focusing induces a lens-like index modulation at the focal spot which additionally increases the intensities of the fundamental beam. 3. The thus enhanced fundamental field results in a high polarisation of the dielectric, leading to strong second- and third-order nonlinearities. The thirdorder Kerr-nonlinearity too changes the refractive index of the material, causing self-phase modulation depending on the beam intensity. Yet the response time is much shorter (quasi instantaneously), affecting the temporal profile of the fundamental pulse and generating the observed spectral broadening. 4. In parallel, the intensity increase due to the self-focusing also enhances the efficiency of the SHG process. Interestingly, all frequency components of the broadened fundamental spectrum are equally converted into the SH signal, giving clear evidence of the achromatic phase-matching featured by the disordered χ(2) modulation. As a result, the SH spectrum is almost an exact copy of the fundamental spectrum at the doubled frequency. The last point is experimentally confirmed in figure 7.4(c) and (d), where the red and blue lines are the measured fundamental and SH spectra, respectively.
86
Second-harmonic generation in disordered nonlinear material
(a)
ω
(b)
(c)
(d)
ω 2ω
Figure 7.5: Propagation of the fundamental beam along the crystal c-axis leads to a conical SH emission. (a) Schematic representation of the SH emission geometry to the domain orientation; (b,c) diagrams illustrating the phase-matching condition for the beam propagating (b) exactly along and (c) under an angle α to the c-axis. The reciprocal lattice vectors gi are available in the x-y plane. (d) Photo of the conical emission in experiment scattered through a thin peace of paper. The black dot in the middle is a metal plate stopping the fundamental beam.
The blue dots indicate the measurement points and show how the comparison is limited by the resolution of the spectrometer. However, it can be clearly seen from the superposition of the fundamental and SH spectra that the achromatic phasematching in unpoled SBN can be used for an accurate frequency mapping from infrared to the visible. In conjunction with the translational invariance of the phasematching conditions and the negligible depletion of the fundamental signal, this suggest SHG in unpoled SBN as an tool for noninvasive and alignment free spectral monitoring of far-infrared optical signals in the sensitivity window of standard silicon detectors.
7.4 Conical SH emission, kω k z For a fundamental wave propagating along or under a small angle to the crystal domain orientation (c-axis), the same two-dimensional modulation leads to a very different phase-matching situation compared to the conditions for a fundamental beam propagating in the x-y plane. As it is depicted schematically in figure 7.5(a), the SH is no longer emitted in a plane but in the form of a cone [116]. Similar to the configuration used for the SLT sample, the infinite set of reciprocal phasematching vectors now lies in a plane perpendicular to the propagation direction. The diagram in figure 7.5(b) shows the effect of the phase-matching condition for a beam propagating exactly in direction of the c-axis: Since the available grating vectors are restricted to the normal of the fundamental wave vector, the cone angle ϕ depends directly on the phase-mismatch between the fundamental and the SH wave – analogue to the situation found for the conical emission from the SLT sample. Figure 7.5(c) extends this description for small angles α of the fundamental beam with respect ot the c-axis. It shows that the axis of the emitted SH cone always
7.4 Conical SH emission, kω k z
(a)
87
(b)
Figure 7.6: (a) Divergence of the conical SH emission (outside the crystal) measured as full external angle 2θ against the fundamental wavelength at high (circles) and low powers (stars). The solid line represents the theoretical predicted emission angle calculated based on the Sellmeier coefficients in [71]. (b) Efficiency of the conical SHG process (kω k z) for the fundamental wavelengths of 820 nm and 860 nm.
coincides with the crystal c-axis, independent of α, the fundamental wavelength or the phase-mismatch. However, the cone angle is affected by all of these, as can be seen from the longitudinal and transverse phase-matching conditions that can be written as k2ω cos(ϕ) = 2kω cos(α) , and k2ω sin(ϕ) ± 2kω sin(α) = |gi | ,
(7.2) (7.3)
respectively. Due to the continuous set of grating vectors gi in the x-y plane the transverse phase-matching condition is always fulfilled. This stands in strong contrast to the discrete phase-matching orders and the coinciding nonlinear Bragg diffraction orders that we observed when illuminating the SLT sample. Furthermore, the homogeneous intensity distribution of the SH cone – which can be seen in the photo of the experiment in figure 7.5(d) – clearly confirms the isotropy of the phase-matching in the discorded structure. Also, due to the radial symmetry of the SHG geometry, the conical emission for α = 0 is always radially polarised [116]. The longitudinal phase-matching condition determines the cone angle. However, mainly due to the lower intensities used in the experiments with SBN (max. 7 nJ) compared to those employed with the periodically poled structure (approximately 3 µJ) we only observe the single, both longitudinal and traversal phase-matched conical emission. Since the phase mismatch depends on the wavelength, we find in our experiment an angular dispersion of the SH wave analogue to a that of a prism. Together with the refraction at the crystal surface, the external cone angle θ therefore has a strong dependence on the fundamental wavelength, as illustrated in figure 7.6(a). For a fundamental wavelength of 860 nm and 880 nm, the full external angle (2θ) measured at low powers (100 mW, blue stars) are 131.0◦ and 125.1◦ , respectively. This agrees with the theoretical predicted values of 134.24◦ and 125.95◦
88
Second-harmonic generation in disordered nonlinear material
Figure 7.7: Effect of the thermal lensing on the SH emission profile for a fundamental beam propagating under a small angle to the x-y plane. The schematics in the top row illustrated how the SH light is refracted at the heat induced index modulation. Experimental results in the bottom row show the development of the SH profile for an increasing fundamental power (noted are average powers).
that are calculated based on the Sellmeier formula with the coefficients published by Woike, et al. [71]. The high wavelength sensitivety of e.g. 2(δθ/δλ) = −0.51◦ /nm at λ = 860 nm, suggests applications of this SHG geometry for simultaneous SH conversion and wavelength separation of multi-wavelength signals (e.g. in WDM systems), and represents a nonlinear analogue to the super-prism effect in photonic crystals [117]. However, in the initial measurements we tried to benefit from a stronger SH signal at higher laser powers but had to notice that the measured cone angles under these conditions are notably smaller that those calculated. This can be attributed again to the formation of a thermal lens. The refractive index modulation focuses the SH cone inside the crystal and thus reduces the cone angle as depicted in the inset of figure 7.6(a). According to the circumstances and personal taste, this can be interpreted either as a nonlinear tunability or as a distortion at high laser powers. Besides reducing the cone angle, the thermal lens benefits the efficiency of the SH conversion process in this geometry: In figure 7.6(b) we see the same quadratic increase in efficiency for a fundamental average power over the critical value of 250 mW as previously for the plane emission. However, the total SH signal is much smaller because only a limited number of grating vectors with the fitting magnitudes participate in the SHG process. Again, because of the minimal size of the domains the QPM is of high-order type, and accordingly of low efficiency. Additionally, the parametric process is governed by the d32 component of the χ(2) tensor, wich is only half of the d33 component involved in the plane emission. Last but not least, the
7.5 A simple autocorrelator for pulse monitoring
89
incident angle of the cone at the crystal surface is close to the angle of total internal reflection and so a good part of the SH light is not emitted but reflected back into the crystal. After having discussed the two cases for kω ⊥ z and kω k z separately, it should be mentioned that the angle ϕ increases monotonically with the angle α between the propagation direction of the fundamental wave and the crystal c-axis. Consequently, the cone opens in a gradual transition, until in the extreme case of α = π, meaning kω ⊥ z, the cone is transformed into a plane. Looking at an angle α close to π, we can find a situation where the thermal lensing beside all applied and technical considerations causes an effect of primarily aesthetic value. Figure 7.7 is related to figure 7.3(e), both depicting the SH emission in forward direction. Yet in difference to figure 7.3, the fundamental beam in figure 7.7 is propagating under a small angle to the x-y plane, with the SH emission not in the shape of a plane but slightly bended as a part of a widely opened cone. The schematics in the top row illustrate how the thermally induced index modulation refracts the fundamental beam together with the SH light generated before the thermal lens. In the bottom row we show the experimental recoding for the SH emission profile at increasing power levels, where the part of the SH cone propagating closest to the fundamental beam is deflected most. The increasing lensing effect thus builds up a beautiful SH caustic until at around 500 mW a maximum of blue light is focused at one spot and the caustic starts to disintegrate for higher fundamental intensities.
7.5 A simple autocorrelator for pulse monitoring Back to a more application orientated research, we will consider next the configuration where two counterpropagating pulses, directed perpendicular to the crystal c-axis, meet inside the crystal. We already discussed in the last chapter [see sect. 6.5] in the context of transverse phase-matched SHG in the annular poled SLT sample that the emitted SH signal of two counterpropagating pulses is actually the intensity correlation of the two pulses and that thus the observation of the encounter in perpendicular direction to the fundamental beams offers us a simple and intuitive way of looking at the temporal profile of the pulses. This idea is not new, but has already been suggested shortly after the first pulsed laser sources became available. J. A. Giordmaine, et al. [118] proposed 1967 to photograph the transverse emitted light from the two-photon fluorescence (FTP) of counterpropagating pulses in dye as a technique to measure the pulse duration. However, this approach suffered primarily from the high pulse intensity requirements (about 2–20 GW/cm2 [118, 119]), the scattering and absorption in the liquid and a fast dye degradation [120]. As we will see, these problems can be overcome by applying their idea to the transverse SHG process in disordered media. Making use of the advantages provided by the phase-matching conditions in the two-dimensional random structure we thus can build a very simple device for pulse monitoring that already attracted industrial interest [121, 122]. Figure 7.8(b) schematically shows the experimental setup, where the original
90
Second-harmonic generation in disordered nonlinear material
(a)
(b)
M
M
M M c
L
SBN
L
BS M
Figure 7.8: Transverse SH autocorrelator. (a) Combined photo showing the camera perspective where the top part is taken with background illumination for a comparison of the signal trace (red arrow indicating the autocorrelation) to the crystal width of 5 mm. (b) Experimental setup with BS – beam splitter, M – mirror, L – lens, and SBN – unpoled Strotium Barium Niobate crystal.
pulse is split into two, both directed from opposing sites into the SBN crystal, similar to the setup for transverse SHG from the periodically poled sample. Please note that the delay line (two mirros on grey rectangle) is only used to equalise the beam paths for the two pulses so that they meet approximately in the centre of the crystal. Regular autocorrelators for pulse characterisation direct the two pulses under a small angle through a SH generating crystal and measure the SH intensity in forward direction. In this configuration it is necessary to delay one of the pulses relative to the other, so that the autocorrelation trace can be measured as the SH intensity against a scan over the relative delay. However, in our setup the measurement becomes single-shot due to the recording of the SH signal from the transverse direction, and no part of the setup needs to be moved to record the correlation trace∗ . The combined photo in figure 7.8(a) depicts the camera view onto the crystal, where the top part was taken with room light as background illumination to provide a scale for the observed SH signal (the crystal width is 5 mm). In contrast to the periodically poled structure in SLT, the disordered media also phase-matches the transverse SHG from single pulses. The phase-matching diagram in figure 7.9 illustrates that in our experimental configuration there are therefore three different processes contributing to the transverse SH signal. They cannot be differentiated in our measurement since both pulses have the same carrier frequency and so the results of all three frequency conversion processes have the same wavelength. However, the distinction would become immediately apparent if the counterpropagating pulses had different frequencies: Each single pulse would gener∗
This aspects is primarily of technical interest since the proposed autocorrelator thus can be build without any mechanical components.
7.5 A simple autocorrelator for pulse monitoring
AA-S A
B
k2ω
2k1A g'
91
2k1B
BB-S
g'
k2ω
AB-S
k1A
k1B g k2ω
c-axis
k2ω – SH wave vector k1 – fundamental wave vector – reciprocal grating vector g
Figure 7.9: Transverse phase-matching of second-harmonic generation from two pulses counterpropagating perpendicular to the crystal z-axis (kω ⊥ z).
ate a SH background on its path through the crystal and the (cross-)correlation trace from the region of pulse interaction would then be the result of a sum-frequency mixing process. All three processes would be equally phase-matched in the disordered structure, but the resulting signals would have different wavelengths and could be spectrally separated. In comparison, the previous experiments with the SLT sample allowed us to record the correlation trace of two pulses with the same frequency automatically as a background free measurement. This drawback of the autocorrelation in SBN from pulses directed perpendicular to the c-axis of the crystal is outweighed by the fact that we can now make use of the biggest component of the χ(2) tensor if both fundamental beams are extraordinary polarized and propagate within the x-y plane. Measurements with an uncooled CCD-camera were done at power levels down to 0.26 MW/cm2 , four orders of magnitude lower than those usually used with TPF. To these significantly lower power requirements contributes also the confinement of the emitted SH in a plane instead of the emission in the full solid angle from the TPF process. But even compared to the transverse SH emission from the periodically poled SLT sample, which is also limited to a plane, we find a difference of four to five orders of magnitude in power. The measurement accuracy is primarily limited by the imaging of the correlation trace onto a camera. For recording, we use an optical microscope at 4.5× magnification. To avoid an image distortion caused by the limited depth of field, the beams are focused in the crystal by cylindrical lenses (f = 50 mm), resulting in a beam width of 33 µm along the observation direction. For comparison, we also measured the pulse duration with a GRENOUILLE, as shown in figure 7.10(c,d). In figure 7.10(b) we overlay the SH autocorrelation trace (black dots) with that obtained from the reference measurement taken with GRENOUILLE (red solid line). In a series of measurements we find the two methods to disagree no more than 10 %, including the dispersion of the 190 fs pulse in 2.5 mm of SBN, that accounted for approximately 4.5 % of the error. The effect of dispersion can be easily reduced by using shorter crystals.
Second-harmonic generation in disordered nonlinear material
c) Wavelength (nm)
a)
100 µm
430 425 420
1 ps -400
0
Time (fs)
200
400
0.8
0.8
0.6 0.6
0.4
0.4
0.2 0
0.2 0
-600
-300
0
Time (fs)
300
600
Intensity (arb. units)
d) 1
1
Correlation
Intensity SH (arb.units)
b)
-200
0.8 0.6 0.4 0.2
1
Phase (rad)
92
0.8 0.6 0.4 0.2 0
-600 -300
0
300
Time (fs)
600
Figure 7.10: Comparison to FROG: (a) Camera picture of transverse SH trace, and (b) FROG trace of the same pulse at 850 nm fundamental wavelength. (b) Black dots – SH profile from area marked in (a), solid line – autocorrelation trace calculated from FROG measurement. (d) Pulse shape and phase retrieved from FROG with ∆τ = 189 fs.
Apart from the pulse duration measurements, the correlator in Fig. 7.8(b) can also be used to visualize unambiguously the tilt of the front of an optical pulse. Such a pulse front tilt (PFT) (which is typically caused by dispersive elements like prisms, gratings, or wedges) leads to an effective longer pulse duration and hence a lower peak power in the focal plane of the beam. By placing a 60 degree (SF11 Schott glass) prism into the beam path [Fig. 7.11(a)], a PFT was introduced that can be clearly seen in the 4 degree tilt of the correlation trace [cf. Fig. 7.11(b) and (c)]. The large time window of our technique (1 mm SBN is sufficient to monitor 7 ps) allows for monitoring more complex temporal structures consisting of multiple pulses. To demonstrate this feature, a pulse doublet is generated by passing the beam through a thin (3.2 mm) birefringent (Lithium Niobate) crystal followed by a polariser, as depicted in Fig. 7.11(d). The ordinary polarised component of every pulse gets delayed roughly 1 ps with respect to its extraordinary counterpart. The polariser combines these two components to a pulse doublet. The autocorrelation trace shown in Fig. 7.11(e) clearly resolves the two components of the doublet and allows for the delay between them to be precisely measured as (989 ± 2) fs. For comparison, in the analogous experiment GRENOUILLE averages over the two pulses due to its narrow time window, and hence the information about the double structure of the pulse event is completely lost. Even more information about a pulse signal can be gained if one of the counter-
7.6 Toroidal waves from disordered structure
a)
93
b)
M
c)
P M
d)
1 ps
1 ps
e)
LiNbO3
Pol. 1 ps
Figure 7.11: Detecting pulse front tilt, complex pulse shapes and pulse trains (all at 850 nm fundamental wavelength). (a) Schematic of optical system to induce a pulse front tilt. (b,c) Autocorrelation traces of the (b) tilted and (c) straight front pulses. (d) Schematic of the generation of a pulse doublet by means of a birefringent crystal. (e) Autocorrelation trace of a doublet with 989 fs delay between the two pulses.
propagating beams is a pulse train with well defined properties like e.g. generated by an optical clock. As mentioned before, such a cross-correlation can be phasematched even for pulses of different carrier frequency so that the correlation trace can be filtered out from the SH background. Furthermore, if the reference signal is well known, a cross-correlation retrieves not only a more precise information about the signal pulse shape but also monitors the synchronisation of the signal pulse train relative to the reference pulses from the optical clock. Even a small de-synchronisation between the reference and signal repetition rate will lead to a moving of the correlation peak, while any additional delay of the signal pulse during the monitoring results in a shift of the correlation trace and can be easily measured with femtosecond precision. On the other hand, a pulse jitter will result in broadening and flattening of the correlation trace.
7.6 Toroidal waves from disordered structure In the case of the annular periodically poled SLT sample, the toroidal wave was emitted from the interaction of two pulses counterpropagating along the crystal zaxis, that is the symmetry axis of the structure. The same type of SH emission is achieved if the SBN crystal in the experimental setup (Fig. 7.8) is turned by 90 degrees and both beams are directed along the domain orientation in the crys-
94
Second-harmonic generation in disordered nonlinear material
(a)
(b)
2ω
(c) x
ω y
z
g kω
A
k2ω
ω
kω B
Figure 7.12: SH emission from pulses propagating along the disordered domains structure in SBN ( kω k z). (a) Schematic representation of conical emission from each single pulse (A and B), and the toroidal wave generated by the interaction of these two pulses. (b) Phase-matching diagram for toroidal SH wave [identical to Fig. 6.7(b)] (c) Photo of the experimental generated toroidal wave (marked with white arrow), scattered at a peace of paper. The two other strong SH lines are the scattering of the conical SH waves. The fundamental pulse (before splitting in the setup) had the same energy (ca. 3 µJ) as in figure 6.7(c).
tal. Figure 7.12 schematically depicts this configuration where – equally to the χ(2) modulation in the SLT sample – now all available grating vectors lie in a plane perpendicular to the fundamental beam. Consequently, the phase-matching conditions [Fig. 7.12(b)] and hence the SH emission profile [Fig. 7.12(c)∗ ] in both situations are almost identical – with three important exceptions: • Due to the achromatic phase-matching in the disordered structure, all frequency components of the fundamental pulses are converted with the same efficiency (relative to their respective intensity). In contrast to the spectral narrowing observed for the SHG in the sample with fixed-period grating 6.5(c,d), the spectrum of the SH generated in the disordered structure reflects the full spectrum of the fundamental wave, avoiding thus the temporal lengthening of the SH pulse. • The domain sizes in SBN (in the x-y plane) spread around a diameter of 2.5 µm. Compared to the poling period of 7.5 µm in the SLT crystal, where the transverse SH emission resulted from (approximately) the 42end phasematching order, the phase-matching order in the experiment with SBN is therefore estimated to be around 14. In conjunction with the higher values of the χ(2) tensor elements involved in the process for SBN than for SLT (a difference of factor 4 to 5), the conversion efficiency in SBN is notably higher. As an example, the photograph and the corresponding correlation graph in figure 7.13 for kω k z was taken from a fundamental pulse with an energy (before splitting in the autocorrelator setup) of ca 6 nJ, while the picture 6.7(c) required 3 µJ pulses. ∗
Picture taken by Solomon Saltiel and Dragomir Neshev.
7.7 Conclusion on phase-matching in a disordered domain structure 95
k1 || z
k1 ┴ z
Figure 7.13: Camera pictures of transverse SH trace of the pulse and their autocorrelation function for kω k z(left, red) and kω ⊥ z(right, blue) geometries. One camera pixel corresponds to 15.7 fs. The ratio of SH intensities of the two curves does not reflect the real strength of the two processes.
• From the annular poled structure, a toroidal wave with homogeneous intensity distribution can only be emitted if the sample is excited exactly at the centre. In the disordered domain structure of SBN on the other hand, the full translational invariance provides identical phase-matching conditions everywhere in the crystal and thus the emitted toroidal SH wave has no azimuthal intensity modulation, independent from where in the crystal the pulses meet. Figure 7.13 compares the autocorrelation trace from the same pulse train recorded for the two crystal orientations kω k z (left) and kω ⊥ z (right) under the experimental conditions defined in section 7.5. Besides the advantage of a background free correlation trace for the configuration kω k z, we can also see that the correlation trace is smoother compared to the configuration of two pulses propagating perpendicular to the c-axis. However, the intensity of the background free SH signal is much smaller (the two correlation traces in figure 7.13 are differently scaled to allow for an easy comparison) because of the fact that the effective nonlinearity in the two configuration differs by a factor of ca. d33 /d31 ≈ 2.
7.7 Conclusion on phase-matching in a disordered domain structure In this chapter we studied theoretically and observed experimentally the planar, conical and toroidal SH emission excited by near-infrared femtosecond pulses in an unpoled SBN crystal. All these processes were quasi-phase-matched by the χ(2) modulation that stems from the naturally antiparallel orientated ferroelectric domains
96
Second-harmonic generation in disordered nonlinear material
in this material. Due to the elongated form along the c(= z)-axis and the random diameter in the x-y plane, these domains provide a quasi two-dimensional disordered geometry with significantly different phase-matching conditions compared to fixed-period poling structures like e.g. the SLT sample discussed in the previous chapter. For instance, we discussed and demonstrated the possibility of achromatic and non-collinear phase-matching and showed their advantage in applications like spectral mapping into the SH signal and pulse monitoring. These two features also highlight an important aspect of the disordered structure compared to fixed-period pattern as discussed in the last chapter: Instead of discrete phase-matching orders that lead to a discretisation of the directions and wavelength regions in which the SH process can be phase-matched, the disordered structure provides a continuous set of phase-matching gratings that result in a continuum in the spectral and spatial emission properties. For a similar reason the phase-matching does not depend on the position of the fundamental beam inside the crystal. The phase-matching conditions are isotropic and homogeneous within the modulation plane, in contrast to the discussed radial geometries (annular periodically poled SLT sample and optically induced Bessel lattice) that only show identical conditions in all transverse directions if excited exactly at the centre of the structure. An interesting example for the complex impact of nonlinearities on the beam dynamics and vice versa was observed in the formation of a thermal lens in the focal spot of the fundamental beam. It illustrates the importance of considering the interplay of spatial modulation and nonlinearity rather than the two aspects isolated from each other. It also indicates that beyond the basic case of a single type of nonlinearity interacting with a single type of modulation as it is studied in this thesis, new functionalities could be achieved with a deeper understanding and a smart design of several connected interactions involved into the processing of light signals.
CHAPTER 8
Research summary and conclusions
Before we review the common and distinct properties of the modulation geometries and their particular interaction with nonlinearity, we will summarise the original research contribution of the work presented in this thesis∗ .
8.1 Original contribution to research in this thesis Optically induced square lattices as discussed in chapter 3 have been studied by other groups previously and in parallel to our project. However, in our work we excited exclusively single Bloch-Floquet modes at the high symmetry point from the first and second band, in order to study their linear diffraction behaviour and compare it to the nonlinear beam dynamics. Furthermore, we demonstrated experimentally a two-dimensional gap-soliton with reduced symmetry towards the underlying lattice. Such light states are localised simultaneously by total internal reflection along one axis and Bragg scattering in the transverse direction, and therefore feature directed mobility properties within the system. In chapter 4 we employed a non-diffracting Bessel beam to optically induce a lattice with rotational symmetry. It turned out that at about the same time as our research was conducted another group used Bessel beams for a similar purpose. The main difference though, is that they studied the mobility of solitons in single rings of the Bessel lattice [123] while we looked for localised states in azimuthally modulated Bessel lattices that resemble the structure of infiltrated microstructured fibres. By probing our Bessel lattice we demonstrated nonlinear self-trapped states in this rotational periodic structure and analysed numerically their stability. The annular modulated SLT sample discussed in chapter 6 is certainly among the first two-dimensional periodically poled structures that have been excited along the crystal z-axis, that is perpendicular to the modulation plane, in order to generate non-collinear second-harmonic waves. Although transverse second-harmonic generation has been demonstrated several times before in different periodically structured materials, the transverse emission of a SH wave in form of an expanding toroid has – as far as we know – not been reported before. ∗
Several other projects that were undertaken as part of my PhD program are not listed here because they did not directly relate or contribute to the theme of this thesis. However, they can be found in the publication listed in the preface of this thesis.
98
Research summary and conclusions
Broadband phase-patching of second-harmonic generation in Strontium Barium Niobate has been observed some 15 years ago and studied by various research groups in the fields of optics and crystal growing. However, in chapter 7 we quantified the conversion efficiency of the process for the use of femtosecond pulses and emphasised the possibility to phase-match in disordered structures the broad spectrum of ultra-short pulses for parametric processes. Applying Giordmaines idea of correlation measurements from counterpropagating pulses to this material we developed a simple solid-state autocorrelator that hopefully will soon provide a commercially available alternative to expensive pulse monitoring tools.
8.2 Conclusion on the interplay of two-dimensional modulation and nonlinearity After the detailed study of several nonlinear systems with different structural geometries and their effects on the propagating light and related nonlinear effects, the conclusion drawn from their comparison should help us to gain a more general view on the observed behaviour so that we can identify some common characteristics of two-dimensional modulated nonlinear systems: We repeatedly observed how periodicity leads to a discretisation in the product of the nonlinear process. This discretesation can be in space and/or in the spatial and optical spectrum of the beam dynamics or the SH emission profile. Examples are the discrete diffraction of linear propagating beams in the optically induced lattices, the discrete eigenmodes and formation of spectral gaps in the optically induced square lattice as well as the analogue discrete phase-matching and nonlinear Bragg diffraction orders seen in the case of transverse SH excitation in the annular periodically poled crystal. This aspect becomes particular evident in the comparison with the aperiodic, that is disordered, structure discussed in the last chapter, where the absences of a single dominating modulation period leads to continuous properties of the phase-matching conditions and hence the of SH emission in both space and the optical spectrum. In the discussed geometries we also noticed that the position of the probe beam relative to the lattice has a crucial impact on the result of the nonlinear light selfaction. This is especially evident in the drastic difference of the beam dynamics at the X symmetry point in the Brillouin zone of the square lattice, where the output for an identical probe beam critically depends on its initial position relative to the phase of the lattice period. While in the square lattice, which is periodic in a Cartesian coordinate system, the conditions repeat for a translation of any integer number of periods along the main axes, we see that for the two systems that are defined in a polar coordinate system, namely the Bessel lattice (not considering the effect of anisotropy) and the annular poled SLT crystal, the conditions only are homogenous in all transverse directions if they are excited exactly at the centre of the structure. Again, the experiments with the disordered domain structure in SBN allows us to contrast this behaviour with an aperiodic modulated nonlinear medium where the conditions for the nonlinear process do not depend on the placement of
8.2 Conclusion on the interplay of two-dimensional modulation and nonlinearity
99
the fundamental beam in the crystal but only on the angle to the modulation plane. The impact of a two-dimensional modulation on the nonlinear effect compared to that of one-dimensional structures has been illustrated e.g. with localised states featuring a reduced symmetry relative to the underlying lattice. For instance, the gap-soliton originating from the top of the second band in the square lattice is localised by different mechanisms along its principle axis and therefore shows anisotropic properties in diffraction and mobility for these two direction. The transverse SH excitation by counterpropagating pulses in the annular periodically poled crystal demonstrates how the two-dimensional modulation can be used together with the fundamental beam profile and pulse duration to shape a three-dimensional toroidal SH wave. In the disordered domain structure of SBN on the other hand, we could see that the quasi-two-dimensional nature of the modulation confines the SH emission in a plane or cone instead of emitting the SH in the full solid angle like e.g. known from KTP powder. In the introduction we claimed that the “fascinating interplay of light, matter and modulation [...] builds the vivid scenery for this thesis”. Especially the formation of a thermal lens in the experiments with SHG in SBN let us witness how the complex interaction of different types of nonlinearity with different types of modulation creates a variety of effects that shape the light both spatially and spectrally. We therefore can say that in fact these two aspects, the spatial modulation and the nonlinearity, should not be considered isolated from each other but rather as a strongly interacting duo. This thesis could only examine a few specific examples of the interplay between spatial modulation and nonlinearity. Most of them seem rather far from any industrial implementation. However, the results presented here already contributed to many other research projects that are a bit closer to potentially ‘useful’ applications. Especially the simple approach of monitoring laser pulses by means of transverse SHG in random media will hopefully be developed soon to a commercially available product. In regards to the long-term goal of an efficient all-optical control and processing of optical signals, the discussed findings are only a small step on yet a long way to go. Much will depend on the development of better suitable optical materials and a smart combination of optical and electronic solutions. For the results of this thesis to prove useful, they will need to be translated and applied to other, more efficient systems that work at lower light powers. Nonetheless, we could demonstrate how two-dimensional modulation geometries in nonlinear optical systems offer new possibilities in the shaping of optical signals. Where and how they will be used – we will see.
Bibliography
[1] T. H. Maiman, “Stimulated optical radiation in ruby,” Nature 187, 493–494 (1960). [2] P. A. Franken, A. E. Hill, C. W. Peters, and G. Weinreich, “Generation of optical harmonics,” Phys. Rev. Lett. 7, 118–119 (1961). [3] P. D. Maker, C. M. Savage, R. W. Terhune, and M. Nisenoff, “Effects of dispersion and focusing on production of optical harmonics,” Phys. Rev. Lett. 8, 21 (1962). [4] P. Vukusic and J. R. Sambles, “Photonic structures in biology,” Nature 424, 852–855 (2003); Vukusic:2004-680:NAT. [5] D. Trager, R. Fischer, D. N. Neshev, A. A. Sukhorukov, C. Denz, W. Krolikowski, and Yu. S. Kivshar, “Nonlinear Bloch modes in two-dimensional photonic lattices,” Opt. Express 14, 1913–1923 (2006). [6] R. Fischer, D. Trager, D. N. Neshev, A. A. Sukhorukov, W. Krolikowski, C. Denz, and Yu. S. Kivshar, “Reduced-symmetry two-dimensional solitons in photonic lattices,” Phys. Rev. Lett. 96, 023905–4 (2006). [7] R. Fischer, D. N. Neshev, S. Lopez Aguayo, A. S. Desyatnikov, A. A. Sukhorukov, W. Krolikowski, and Yu. S. Kivshar, “Observation of light localization in modulated Bessel optical lattices,” Opt. Express 14, 2825–2830 (2006). [8] S. M. Saltiel, D. N. Neshev, R. Fischer, W. Krolikowski, A. Arie, and Y. S. Kivshar, “Generation of the second-harmonic conical waves via nonlinear Bragg diffraction,” submitted to PRL (in ). [9] S. M. Saltiel, D. N. Neshev, R. Fischer, W. Krolikowski, A. Arie, and Y. S. Kivshar, “Spatiotemporal toroidal waves from transverse second-harmonic generation,” accepted for Optic Letters (in ). [10] R. Fischer, S. M. Saltiel, D. N. Neshev, W. Krolikowski, and Yu. S. Kivshar, “Broadband femtosecond frequency doubling in random media,” Appl. Phys. Lett. 89, 191105–3 (2006). 100
[11] R. Fischer, D. N. Neshev, S. M. Saltiel, A. A. Sukhorukov, W. Krolikowski, and Yu. S. Kivshar, “Monitoring ultrashort pulses by transverse frequency doubling of counterpropagating pulses in random media,” Appl. Phys. Lett. 91, 031104–3 (2007). [12] N. K. Efremidis, S. Sears, D. N. Christodoulides, J. W. Fleischer, and M. Segev, “Discrete solitons in photorefractive optically induced photonic lattices,” Phys. Rev. E 66, 046602–5 (2002). [13] D. M. Pepper, J. Feinberg, and N. V. Kukhtarev, “The photorefractive effect,” Sci.Am. 263, 62 (1990). [14] A. Ashkin, G. D. Boyd, J. M. Dziedzic, R. G. Smith, A. A. Ballman, J. J. Levinstein, and K. Nassau, “Optically-induced refractive index inhomogeneities in LiNbO3 and LiTaO3 ,” Appl. Phys. Lett. 9, 72–74 (1966). [15] A. S. Desyatnikov, N. Sagemerten, R. Fischer, B. Terhalle, D. Trager, D. N. Neshev, A. Dreischuh, C. Denz, W. Krolikowski, and Yu. S. Kivshar, “Twodimensional self-trapped nonlinear photonic lattices,” Opt. Express 14, 2851– 2863 (2006). [16] P. Yeh, Introduction to Photorefractive Nonlinear Optics (John Wiley & Sons, New York, 1993). [17] R. G. Hunsperger, Integrated Optics, fourth ed. (Springer, Berlin, 1995). [18] A. S. Desyatnikov, D. N. Neshev, Yu. S. Kivshar, N. Sagemerten, D. Trager, J. Jagers, C. Denz, and Y. V. Kartashov, “Nonlinear photonic lattices in anisotropic nonlocal self-focusing media,” Opt. Lett. 30, 869–871 (2005). [19] G. P. Agrawal, Nonlinear Fiber Optics (Academic Press, New York, 1989). ¨ [20] F. Bloch, “Uber die Quantenmechanik der Elektronen in Kristallgittern,” Zeitschrift der Physik 52, 555–600 (1928) (in German). [21] P. S. Russell, “Bloch wave analysis of dispersion and pulse-propagation in pure distributed feedback structures,” J. Mod. Opt. 38, 1599–1619 (1991). [22] P. St. J. Russell, T. A. Birks, and F. D. Lloyd Lucas, “Photonic Bloch waves and photonic band gaps,” in Confined Electrons and Photons, E. Burstein and C. Weisbuch, eds., (Plenum, New York, 1995), pp. 585–633. [23] H. S. Eisenberg, Y. Silberberg, R. Morandotti, and J. S. Aitchison, “Diffraction management,” Phys. Rev. Lett. 85, 1863–1866 (2000). [24] T. Pertsch, T. Zentgraf, U. Peschel, A. Brauer, and F. Lederer, “Anomalous refraction and diffraction in discrete optical systems,” Phys. Rev. Lett. 88, 093901–4 (2002). 101
[25] C. R. Rosberg, D. N. Neshev, A. A. Sukhorukov, Yu. S. Kivshar, and W. Krolikowski, “Tunable positive and negative refraction in optically induced photonic lattices,” Opt. Lett. 30, 2293–2295 (2005). [26] Nonlinear Photonic Crystals, Vol. 10 of Springer Series in Photonics, R. E. Slusher and B. J. Eggleton, eds., (Springer-Verlag, Berlin, 2003). [27] M. Loncar, D. Nedeljkovic, T. P. Pearsall, J. Vuckovic, A. Scherer, S. Kuchinsky, and D. C. Allan, “Experimental and theoretical confirmation of Blochmode light propagation in planar photonic crystal waveguides,” Appl. Phys. Lett. 80, 1689–1691 (2002). [28] P. E. Barclay, K. Srinivasan, M. Borselli, and O. Painter, “Probing the dispersive and spatial properties of photonic crystal waveguides via highly efficient coupling from fiber tapers,” Appl. Phys. Lett. 85, 4–6 (2004). [29] S. I. Bozhevolnyi, V. S. Volkov, T. Sondergaard, A. Boltasseva, P. I. Borel, and M. Kristensen, “Near-field imaging of light propagation in photonic crystal waveguides: explicit role of Bloch harmonics,” Phys. Rev. B 66, 235204–9 (2002). [30] H. Gersen, T. J. Karle, R. J. P. Engelen, W. Bogaerts, J. P. Korterik, N. F. Hulst, van, T. F. Krauss, and L. Kuipers, “Direct observation of Bloch harmonics and negative phase velocity in photonic crystal waveguides,” Phys. Rev. Lett. 94, 123901–4 (2005). [31] R. J. P. Engelen, T. J. Karle, H. Gersen, J. P. Korterik, T. F. Krauss, L. Kuipers, and N. F. Hulst, van, “Local probing of Bloch mode dispersion in a photonic crystal waveguide,” Opt. Express 13, 4457–4464 (2005). [32] D. Mandelik, H. S. Eisenberg, Y. Silberberg, R. Morandotti, and J. S. Aitchison, “Band-gap structure of waveguide arrays and excitation of Floquet-Bloch solitons,” Phys. Rev. Lett. 90, 053902–4 (2003). [33] A. A. Sukhorukov, D. Neshev, W. Krolikowski, and Yu. S. Kivshar, “Nonlinear Bloch-wave interaction and Bragg scattering in optically induced lattices,” Phys. Rev. Lett. 92, 093901–4 (2004). [34] C. M. de Sterke, “Theory of modulational instability in fiber Bragg gratings,” J. Opt. Soc. Am. B 15, 2660–2667 (1998). [35] J. Meier, G. I. Stegeman, D. N. Christodoulides, Y. Silberberg, R. Morandotti, H. Yang, G. Salamo, M. Sorel, and J. S. Aitchison, “Experimental observation of discrete modulational instability,” Phys. Rev. Lett. 92, 163902–4 (2004). [36] R. Iwanow, G. I. Stegeman, R. Schiek, Y. Min, and W. Sohler, “Discrete modulational instability in periodically poled lithium niobate waveguide arrays,” Opt. Express 13, 7794–7799 (2005). 102
[37] B. J. Eggleton, C. M. de Sterke, A. B. Aceves, J. E. Sipe, T. A. Strasser, and R. E. Slusher, “Modulational instability and tunable multiple soliton generation in apodized fiber gratings,” Opt. Commun. 149, 267–271 (1998). [38] C. Wirth, M. Stepic, C. Rueter, and D. Kip, “Experimental observation of modulational instability in self-defocusing nonlinear waveguide arrays,” In Nonlinear Guided Waves and Their Applications, Postconference ed. OSA p. TuB2 (Optical Society of America, Washington DC, 2005). [39] M. Chavet, G. Fu, G. Salamo, J. W. Fleischer, and M. Segev, “Experimental Observation of Discrete Modulation Instability in 1-D Nonlinear Waveguide Arrays,” In Nonlinear Guided Waves and Their Applications, Postconference ed. OSA p. WD39 (Optical Society of America, Washington DC, 2005). [40] G. Bartal, O. Cohen, H. Buljan, J. W. Fleischer, O. Manela, and M. Segev, “Brillouin zone spectroscopy of nonlinear photonic lattices,” Phys. Rev. Lett. 94, 163902–4 (2005). [41] J. W. Fleischer, M. Segev, N. K. Efremidis, and D. N. Christodoulides, “Observation of two-dimensional discrete solitons in optically induced nonlinear photonic lattices,” Nature 422, 147–150 (2003). [42] H. Martin, E. D. Eugenieva, Z. G. Chen, and D. N. Christodoulides, “Discrete solitons and soliton-induced dislocations in partially coherent photonic lattices,” Phys. Rev. Lett. 92, 123902–4 (2004). [43] S. F. Mingaleev and Yu. S. Kivshar, “Self-trapping and stable localized modes in nonlinear photonic crystals,” Phys. Rev. Lett. 86, 5474–5477 (2001). [44] Yu. S. Kivshar and G. P. Agrawal, Optical Solitons: From Fibers to Photonic Crystals (Academic Press, San Diego, 2003). [45] Yu. S. Kivshar and D. K. Campbell, “Peierls-Nabarro potential barrier for highly localized nonlinear modes,” Phys. Rev. E 48, 3077–3081 (1993). [46] R. Morandotti, U. Peschel, J. S. Aitchison, H. S. Eisenberg, and Y. Silberberg, “Dynamics of discrete solitons in optical waveguide arrays,” Phys. Rev. Lett. 83, 2726–2729 (1999). [47] S. John and N. Akozbek, “Nonlinear-optical solitary waves in a photonic bandgap,” Phys. Rev. Lett. 71, 1168–1171 (1993). [48] O. Manela, O. Cohen, G. Bartal, J. W. Fleischer, and M. Segev, “Twodimensional higher-band vortex lattice solitons,” Opt. Lett. 29, 2049–2051 (2004). [49] G. Bartal, O. Manela, O. Cohen, J. W. Fleischer, and M. Segev, “Observation of second-band vortex solitons in 2D photonic lattices,” Phys. Rev. Lett. 95, 053904–4 (2005). 103
[50] A. A. Zozulya, D. Z. Anderson, A. V. Mamaev, and M. Saffman, “Solitary attractors and low-order filamentation in anisotropic self-focusing media,” Phys. Rev. A 57, 522–534 (1998). [51] D. N. Christodoulides and E. D. Eugenieva, “Blocking and routing discrete solitons in two-dimensional networks of nonlinear waveguide arrays,” Phys. Rev. Lett. 87, 233901–4 (2001). [52] J. C. Knight, T. A. Birks, P. S. Russell, and D. M. Atkin, “All-silica singlemode optical fiber with photonic crystal cladding,” Opt. Lett. 21, 1547–1549 (1996). [53] J. M. Dudley, G. Genty, and S. Coen, “Supercontinuum generation in photonic crystal fiber,” Rev. Mod. Phys. 78, 1135–1184 (2006). [54] G. J. Ogilvie, G. P. Kidd, and R. J. Esdaile, “Transmission loss of tetrachloroethylene-filled liquid core-fiber light guide,” Electron. Lett. 8, 533 (1972). [55] D. N. Payne and W. A. Gambling, “New low-loss liquid-core fiber waveguide,” Electron. Lett. 8, 374 (1972). [56] A. Ferrando, “Discrete-symmetry vortices as angular Bloch modes,” Phys. Rev. E 72, 036612–6 (2005). [57] A. Ferrando, M. Zacares, and M. A. Garcia March, “Vorticity cutoff in nonlinear photonic crystals,” Phys. Rev. Lett. 95, 043901–4 (2005). [58] C. R. Rosberg, D. N. Neshev, A. A. Sukhorukov, W. Krolikowski, and Yu. S. Kivshar, “Observation of nonlinear self-trapping in triangular photonic lattices,” Opt. Lett. 32, 397–399 (2007). [59] J. Durnin, J. J. Miceli, Jr., and J. H. Eberly, “Diffraction-free beams,” Phys. Rev. Lett. 58, 1499–1501 (1987). [60] Y. Lin, W. Seka, J. H. Eberly, H. Huang, and D. L. Brown, “Experimental investigation of bessel beam characteristics,” Appl. Optics 31, 2708–2713 (1992). [61] T. Wulle and S. Herminghaus, “Nonlinear optics of bessel beams,” Phys. Rev. Lett. 70, 1401–1404 (1993); Wulle:1993-209:PRL. [62] C. Lopez-Mariscal, J. C. Gutierrez-Vega, and S. Chavez-Cerda, “Production of high-order Bessel beams with a Mach-Zehnder interferometer,” Appl. Optics 43, 5060–5063 (2004). [63] G. Indebetouw, “Nondiffracting optical fields: some remarks on their analysis and synthesis,” J. Opt. Soc. Am. A 6, 150–152 (1989). 104
[64] A. Vasara, J. Turunen, and A. T. Friberg, “Realization of general nondiffracting beams with computer-generated holograms,” J. Opt. Soc. Am. A 6, 1748– 1754 (1989). [65] W. X. Cong, N. X. Chen, and B. Y. Gu, “Generation of nondiffracting beams by diffractive phase elements,” J. Opt. Soc. Am. A 15, 2362–2364 (1998). [66] N. Chattrapiban, E. A. Rogers, D. Cofield, W. T. Hill, III, and R. Roy, “Generation of nondiffracting Bessel beams by use of a spatial light modulator,” Opt. Lett. 28, 2183–2185 (2003). [67] S. H. Tao, W. M. Lee, and X. C. Yuan, “Dynamic optical manipulation with a higher-order fractional Bessel beam generated from a spatial light modulator,” Opt. Lett. 28, 1867–1869 (2003). [68] Y. V. Kartashov, V. A. Vysloukh, and L. Torner, “Rotary solitons in Bessel optical lattices,” Phys. Rev. Lett. 93, 093904–4 (2004). [69] Y. V. Kartashov, A. A. Egorov, V. A. Vysloukh, and L. Torner, “Shaping soliton properties in Mathieu lattices,” Opt. Lett. 31, 238–240 (2006). [70] D. N. Christodoulides, F. Lederer, and Y. Silberberg, “Discretizing light behaviour in linear and nonlinear waveguide lattices,” Nature 424, 817–823 (2003). [71] T. Woike, T. Granzow, U. Dorfler, C. Poetsch, M. Wohlecke, and R. Pankrath, “Refractive indices of congruently melting Sr0.61 Ba0.39 Nb2 O6 ,” Phys. Status Solidi A 186, R13–R15 (2001). [72] F. Charra and G. Gurzadyan, Nonlinear Dielectric Susceptibilities, LandoltB¨ornstein (Springer-Verlag, Berlin, 2000). [73] M. Sheik-Bahae, D. C. Hutchings, D. J. Hagan, and E. W. Van Stryland, “Dispersion of bound electronic nonlinear refraction in solids,” IEEE J. Quantum Electron. 27, 1296–1309 (1991). [74] R. W. Boyd, Nonlinear Optics (Academic Press, San Diego, 1992). [75] A. Yariv and P. Yeh, Optical waves in crystals : propagation and control of laser radiation (Wiley, New York, 2003). [76] V. G. Dmitriev and Y. V. Yur’ev, “Quasi-phase-matching bandwidth for second harmonic generation in crystals with a regular domain structure,” Quantum Electron. 29, 814–816 (1999). [77] M. M. Fejer, G. A. Magel, D. H. Jundt, and R. L. Byer, “Quasi-phase-matched 2nd harmonic-generation - tuning and tolerances,” IEEE J. Quantum Electron. 28, 2631–2654 (1992). 105
[78] J. A. Armstrong, N. Bloembergen, J. Ducuing, and P. S. Pershan, “Interactions between light waves in a nonlinear dielectric,” Phys Rev 127, 1918 (1962). [79] W. S. Wang, Q. Zou, Z. H. Geng, and D. Feng, “Study of LiTaO3 crystals grown with a modulated structure .1. 2nd harmonic-generation in LiTaO3 crystals with periodic laminar ferroelectric domains,” J. Cryst. Growth 79, 706–709 (1986). [80] J. D. Bierlein, D. B. Laubacher, J. B. Brown, and C. J. Vanderpoel, “Balanced phase matching in segmented ktiopo4 wave-guides,” Appl. Phys. Lett. 56, 1725–1727 (1990). [81] B. F. Levine, C. G. Bethea, and R. A. Logan, “Phase-matched secondharmonic generation in a liquid-filled waveguide,” Appl. Phys. Lett. 26, 375– 377 (1975). [82] M. Yamada, N. Nada, M. Saitoh, and K. Watanabe, “1st-order quasi-phase matched LiNbO3 wave-guide periodically poled by applying an external-field for efficient blue 2nd-harmonic generation,” Appl. Phys. Lett. 62, 435–436 (1993). [83] V. Berger, “Nonlinear photonic crystals,” Phys. Rev. Lett. 81, 4136–4139 (1998). [84] L. H. Peng, C. C. Hsu, J. Ng, and A. H. Kung, “Wavelength tunability of second-harmonic generation from two-dimensional χ(2) nonlinear photonic crystals with a tetragonal lattice structure,” Appl. Phys. Lett. 84, 3250–3252 (2004). [85] D. Kasimov, A. Arie, E. Winebrand, G. Rosenman, A. Bruner, P. Shaier, and D. Eger, “Annular symmetry nonlinear frequency converters,” Opt. Express 14, 9371–9376 (2006). [86] S. M. Saltiel, A. A. Sukhorukov, and Yu. S. Kivshar, “Multistep parametric processes in nonlinear optics,” Prog. Optics 47, 1–73 (2005). [87] A. Bruner, D. Eger, and S. Ruschin, “Second-harmonic generation of green light in periodically poled stoichiometric LiTaO3 doped with MgO,” J. Appl. Phys. 96, 7445–7449 (2004). [88] G. D. Miller, “Periodically Poled Lithium Niobate: Modeling, Fabrication, and Nonliner-optical Performance,” Ph.D. thesis, Stanford University, 1998. [89] N. G. R. Broderick, G. W. Ross, H. L. Offerhaus, D. J. Richardson, and D. C. Hanna, “Hexagonally poled lithium niobate: a two-dimensional nonlinear photonic crystal,” Phys. Rev. Lett. 84, 4345–4348 (2000). 106
[90] Y. Sheng, T. Wang, B. Q. Ma, E. Qu, B. Y. Cheng, and D. Z. Zhang, “Anisotropy of domain broadening in periodically poled lithium niobate crystals,” Appl. Phys. Lett. 88, 041121–3 (2006). [91] M. Nakamura, S. Higuchi, S. Takekawa, K. Terabe, Y. Furukawa, and K. Kitamura, “Refractive indices in undoped and MgO-doped near-stoichiometric LiTaO3 crystals,” Jpn. J. Appl. Phys. 41, L465–L467 (2002). [92] I. Freund, “Nonlinear diffraction,” Phys. Rev. Lett. 21, 1404 (1968). [93] G. Dolino, “Effects of domain shapes on second-harmonic scattering in triglycine sulfate,” Phys Rev B 6, 4025 (1972). [94] F. Zernike and J. E. Midwinter, Applied Nonlinear Optics (Wiley, New York, 1973). [95] S. Saltiel, W. Krolikowski, D. Neshev, and Yu. S. Kivshar, “Generation of Bessel beams by parametric frequency doubling in annular nonlinear periodic structures,” Opt. Express 15, 4132–4138 (2007). [96] X. H. Gu, R. Y. Korotkov, Y. J. J. Ding, J. U. Kang, and J. B. Khurgin, “Backward second-harmonic generation in periodically poled lithium niobate,” J. Opt. Soc. Am. B 15, 1561–1566 (1998). [97] G. D. Landry and T. A. Maldonado, “Counterpropagating quasi-phase matching: a generalized analysis,” J. Opt. Soc. Am. B 21, 1509–1521 (2004). [98] T. M. Crawford, C. T. Rogers, T. J. Silva, and Y. K. Kim, “Observation of the transverse second-harmonic magneto-optic Kerr effect from Ni81Fe19 thin film structures,” Appl. Phys. Lett. 68, 1573–1575 (1996). [99] R. Normandin, R. L. Williams, and F. Chatenoud, “Enhanced surface emitting wave-guides for visible, monolithic semiconductor-laser sources,” Electron. Lett. 26, 2088–2089 (1990). [100] N. D. Whitbread, J. A. R. Williams, J. S. Roberts, I. Bennion, and P. N. Robson, “Optical autocorrelator that uses a surface-emitting 2nd-harmonic generator on (211)b gaas,” Opt. Lett. 19, 2089–2091 (1994). [101] J. J. Romero, C. Arago, J. A. Gonzalo, D. Jaque, and J. G. Sole, “Spectral and thermal properties of quasiphase-matching second-harmonic-generation in Nd3+: Sr0.6Ba0.4(NbO3 )(2) multiself-frequency-converter nonlinear crystals,” J. Appl. Phys. 93, 3111–3113 (2003). [102] V. Bermudez, F. Caccavale, C. Sada, F. Segato, and E. Dieguez, “Etching effect on periodic domain structures of lithium niobate crystals,” J. Cryst. Growth 191, 589–593 (1998). 107
[103] S. Kawai, T. Ogawa, H. S. Lee, R. C. DeMattei, and R. S. Feigelson, “Second-harmonic generation from needlelike ferroelectric domains in Sr0.6Ba0.4Nd2O6 single crystals,” Appl. Phys. Lett. 73, 768–770 (1998). [104] M. Horowitz, A. Bekker, and B. Fischer, “Broad-band 2nd-harmonic generation in srxba1-xnb2o6 by spread-spectrum phase-matching with controllable domain gratings,” Appl. Phys. Lett. 62, 2619–2621 (1993). [105] B. Kibler, R. Fischer, R. A. Lacourt, E. Courvoisier, R. Ferriere, L. Larger, D. N. Neshev, and J. M. Dudley, “Optimized one-step compression of femtosecond fibre laser soliton pulses around 1550 nm to below 30 fs in highly nonlinear fibre,” Electron. Lett. 43, 915–916 (2007). [106] M. A. Arbore, A. Galvanauskas, D. Harter, M. H. Chou, and M. M. Fejer, “Engineerable compression of ultrashort pulses by use of secondharmonic generation in chirped-period-poled lithium niobate,” Opt. Lett. 22, 1341–1343 (1997). [107] P. Loza Alvarez, M. Ebrahimzadeh, W. Sibbett, D. T. Reid, D. Artigas, and M. Missey, “Femtosecond second-harmonic pulse compression in aperiodically poled lithium niobate: a systematic comparison of experiment and theory,” J. Opt. Soc. Am. B 18, 1212–1217 (2001). [108] Y. W. Lee, F. C. Fan, Y. C. Huang, B. Y. Gu, B. Z. Dong, and M. H. Chou, “Nonlinear multiwavelength conversion based on an aperiodic optical superlattice in lithium niobate,” Opt. Lett. 27, 2191–2193 (2002). [109] P. Baum, S. Lochbrunner, and E. Riedle, “Tunable sub-10-fs ultraviolet pulses generated by achromatic frequency doubling,” Opt. Lett. 29, 1686– 1688 (2004). [110] Y. Sheng, J. H. Dou, B. Q. Ma, B. Y. Cheng, and D. Z. Zhang, “Broadband efficient second harmonic generation in media with a short-range order,” Appl. Phys. Lett. 91, 011101–3 (2007). [111] P. O’Shea, M. Kimmel, X. Gu, and R. Trebino, “Highly simplified device for ultrashort-pulse measurement,” Opt. Lett. 26, 932–934 (2001). [112] M. O. Ramirez, D. Jaque, L. Ivleva, and L. E. Bausa, “Evaluation of ytterbium doped strontium barium niobate as a potential tunable laser crystal in the visible,” J. Appl. Phys. 95, 6185–6191 (2004). [113] J. Trull, C. Cojocaru, R. Fischer, S. Saltiel, K. Staliunas, R. Herrero, R. Vilaseca, D. N. Neshev, W. Krolikowski, and Y. Kivshar, “Second-harmonic parametric scattering in ferroelectric crystals with disordered nonlinear domain structures,” Optics Express 15, 15868–15877 (2007) (in ). 108
[114] B. Fischer and M. Horowitz, “Controllable narrow-band and broad-band 2ndharmonic generation by tailored quasiphase matching with domain gratings,” Appl. Phys. Lett. 64, 1756–1758 (1994). [115] M. Horowitz, R. Daisy, O. Werner, and B. Fischer, “Large thermal nonlinearities and spatial self-phase modulation in srxba1-xnb2o6 and batio3 crystals,” Opt. Lett. 17, 475–477 (1992). [116] A. R. Tunyagi, M. Ulex, and K. Betzler, “Noncollinear optical frequency doubling in strontium barium niobate,” Phys. Rev. Lett. 90, 243901–4 (2003). [117] H. Kosaka, T. Kawashima, A. Tomita, M. Notomi, T. Tamamura, T. Sato, and S. Kawakami, “Superprism phenomena in photonic crystals,” Phys. Rev. B 58, 10096–10099 (1998). [118] J. A. Giordmaine, P. M. Rentzepis, S. L. Shapiro, and K. W. Wecht, “2-photon excitation of fluorescence by picosecond light pulses,” Appl. Phys. Lett. 11, 216 (1967). [119] F. Theberge, S. M. Sharifi, S. L. Chin, and H. Schroder, “Simple 3-D characterization of ultrashort laser pulses,” Opt. Express 14, 10125–10131 (2006). [120] D. J. Bradley and N. G. H. C., “Ultrashort pulse measurements,” Proceedings of the IEEE 62, 313 (1974) (in ). [121] R. Fischer, S. M. Saltiel, D. N. Neshev, W. Z. Krolikowski, and Y. Kivshar, “Optical detection system and method,” Australian Prov. Patent No. p. 2006904289: IP Australia (2006). [122] R. Fischer, D. N. Neshev, S. M. Saltiel, W. Z. Krolikowski, and Y. Kivshar, “Optical detection system and method,” Australian Prov. Patent No. p. 2007900150: IP Australia (2007). [123] X. S. Wang, Z. G. Chen, and P. G. Kevrekidis, “Observation of discrete solitons and soliton rotation in optically induced periodic ring lattices,” Phys. Rev. Lett. 96, 083904–4 (2006).
109