Proposal for a performance dashboard for the monitoring of Water and Sewage service Companies (WaSCs) F. Franceschini, E. Turina Politecnico di Torino, DISPEA Corso Duca degli Abruzzi 24, I-10129 - Torino, ITALY, Tel. +39 011 5647225, Fax. +39 011 5647299, e-mail:
[email protected]
Abstract The water and sewage industry provides an essential service to the community, but it is characterized by natural monopoly tendencies of service suppliers. In this framework, it is very important to assist regulators with a small set of critical indicators (performance dashboard) for the evaluation and monitoring of the service provided by Water and Sewage Companies (WaSCs). The paper originates from the analysis of situation of Piemonte (Italy), where each regional and local body adopts a proprietary Performance Measurement System (PMS). In order to improve the coordination of information flow and to support the definition of common service standards, a methodology to merge existing PMSs and define a unique shared reference system is proposed. The Kaplan and Norton’s Balanced Scorecard (BSC) is adopted as the reference model of this approach. BSC is widely recognized to be an exhaustive and balanced framework in describing the performances of an organization and ensures that all the operational aspects of WaSCs are adequately monitored. The output of the proposed procedure is a general performance dashboard for the monitoring of WaSCs. The dashboard is shown and some remarks about indicators properties are developed. In particular, this analysis highlights some common pitfalls originated by a ‘rushed’ aggregation of several performance indicators. Description is supported by several examples.
Keywords Water and sewage service, Performance measurement, Balanced Scorecard, performance dashboard, key performance indicators, Performance Measurement Systems.
1. Introduction Privatisation of water service (e.g. “affermage”) started in Europe several years ago (Barraqué, 1995; Lepage, 1997; Alegre et al., 2006). The main aim was to improve economic efficiency and to obtain private investments for infrastructural improvements (Gialis et al., 2011; Barret and Wallace, 1
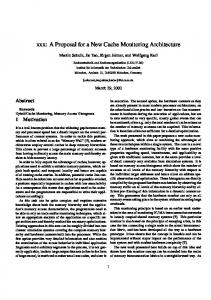
2011). However, the water and sewage industry has strong natural monopoly tendencies and privatization should be accompanied by effective regulatory mechanisms (Neto, 1998). Different systems of performance indicators have been developed. We cite, among the others, the OFWAT model in UK (OFWAT, 2008), the ONEMA in France (ONEMA, 2009) and the ERSAR in Portugal (ERSAR, 2009). To give an example, the Water Services Regulation Authority of England and Wales (OFWAT) periodically collects data on the level of service provided to customers from the Water and Sewage Companies (WaSCs). The key performance areas are four: water supply, sewage service, customer service, and environmental impact (OFWAT, 2008). The OFWAT produces then the Overall Performance Assessment and calculates an overall score for each WaSC. This value is considered when the OFWAT sets the limits for the prices that companies charge customers. Another interesting proposal is that of the International Water Association (IWA) which identifies a large set of performance indicators for the monitoring of water and wastewater service. Six main groups of key features are defined: water resources, personnel, physical, operational, quality of service and economic and financial (Matos et al., 2003; Alegre et al., 2006). Finally, some standards for the assessment of water and wastewater services are also developed by the International Organization for Standardization (ISO 2007:24510; ISO 2007:24511; ISO 2007:24512). In Italy the reform of water service established national, regional and local bodies responsible for the monitoring of WaSCs performances (Repubblica Italiana, l. 36/1994; Regione Piemonte, l. 13/1997). For example, in Piemonte there are a regional Observatory of water services and six local Authorities (or A.ATO, Autorità d’Ambito Territoriali Ottimali). Each local body monitors the performance of a subset of the WaSCs operating in the region and collects data on economic performance (e.g.: revenues, investments, level of prices) as well as on the level of service (e.g.: water and wastewater quality, service interruptions, …). Part of this information is used to fix prices of the service. Collected data are then transmitted to the regional body, which is also in charge for the monitoring of the Companies performance (see Figure 1). Currently, each regulator body provides its own performance indicators independently from the others. In this context, a comparison of WaSCs at a regional level is a very complex issue, since Performance Measurement Systems (PMSs) are not homogeneously defined. A set of key performance indicators (KPIs) common to all local and regional bodies would allow an easier monitoring of the WaSCs performance. A performance dashboard is a small set of KPIs which enables a quick and synthetic evaluation of an organization performance (Performance-Based Management Special Interest Group, 2001; Lohman et al., 2004; Franceschini et al., 2007). This paper describes a methodology to define an 2
homogeneous subset of KPIs by a structured merging of current local and regional PMSs. The obtained performance dashboard synthesizes the collaboration between the regional Observatory of water services and three local Authorities. In this pilot study, a subset of local Authorities was chosen (A.ATO2, A.ATO5 and A.ATO 6). They adopted the most refined PMSs and monitored the service offered by 13 WaSCs. Each PMS contains a different number of indicators ranging from 60 to 400. Monitored performance areas and related key indicators are not the same. Information available for a given WaSC is not available for another one and so on. This makes the coordination of the information flow among local and regional bodies very complex. PMS R
REGIONAL SERVICE OBSERVATORY
PMS 2
PMS 1
WaSC1
...
...
A.ATO 2
A.ATO 1
WaSC5
WaSC1 WaSC3
WaSC2
...
PMS 6
A.ATO 6
WaSC1
WaSC2
WaSC7
Regular information flow Periodical information flow
Figure 1: Scheme of the information flow among regulator bodies in Piemonte (Italy). Data are periodically collected from WaSCs by Local Authorities (A.ATO, Autorità d’Ambito Territoriale Ottimale), which apply their own PMSs (PMS1 to 6). Gathered data are transmitted to the regional Observatory of water services. Regional Observatory periodically integrates this information with other WaSCs data on performance.
The lack of homogeneity originated from the absence of a common reference framework in the definition of the different regional and local Authorities’ PMSs. On the contrary, the methodology here proposed is founded on a reference model which supports the identification of balanced and homogenous performance areas. This model becomes the leading framework in the merging of the PMSs currently adopted by single regulator Bodies. In detail, the paper is structured as follows. Section 2 introduces the adopted reference framework. Section 3 describes the merging process of the current regional and local Authorithies’ PMSs. Strategic goals are organized according to BSC perspectives and a common base of performance indicators is obtained. Section 4 illustrates a procedure to extract a subset of KPIs. The obtained
3
performance dashboard is presented and some remarks on indicators properties are proposed. Conclusion sums up the main contribution of the paper.
2. A reference framework: the Balanced Scorecard In order to support the definition of a performance dashboard common to the different local and regional bodies, a reference model has been adopted. In the literature there are several models focused on organization performance (for a detailed review see Performance-Based Management Special Interest Group, 2001; Franco and Bourne, 2003) as well as on water service context (see for example Alegre et al., 2006). In this paper, the Kaplan and Norton’s Balanced Scorecard (BSC) (Kaplan and Norton, 1992; 1996; 2001b) is applied. During the years, the BSC approach obtained a large diffusion (Rocha et al., 2005). It has been extensively used and tested in different organizational contexts. The BSC introduces the balancing concept. Its aim is to overcome the shortcomings of traditional Performance Measurement Systems available in the 90’s, which relied only on financial outcomes. The BSC considers four perspectives: (1) Financial: it considers the financial aspects of the organization. (2) Customer: it considers what an organization has to do for its customers in order to ensure financial success. (3) Internal business process: it concerns which processes most influence customer satisfaction. (4) Learning and growth: it concerns the improvements that can be made to ensure sound business processes and satisfied customers. The strategic goals of a generic organization are translated into performance measures on the basis of these four perspectives. This ensures a balance between the perspectives and their indicators as well as between short and long term objectives, leading and lagging indicators, financial and non-financial measures. Many WaSCs adopted BSC model. Kaplan and Norton, for example, applied BSC in the review of the Human Resources team in Yorkshire Water (Kaplan and Norton, 2001a). Tebutt et al. suggested to use the BSC as an investment decision making tool in the water industry of England and Wales. The same authors examined a number of techniques for investment appraisal and showed that the BSC appears to be the most suited (Tebutt et al., 2003). Fernandes et al. applied BSC to investigate the relations between resources and performance in a Brazilian water company (Fernandes et al., 2003). Bianchi and Montemaggiore developed a dynamic BSC for strategy design in an Italian water company (Bianchi and Montemaggiore, 2008).
4
BSC is also applied by the City of Eugene’s Wastewater Division (a section of the Oregon Public Works Department responsible for the wastewater treatment service), the Charleston CPW (a municipal corporation that provides both water and wastewater treatment services to the City of Charleston), the Sydney Water Corporation (a water utility that runs drinking water and wastewater treatment services in the Sydney region) (EPA and WEF, 2004) and the Water Utility Enterprise in Santa Clara Valley Water District (Water Utility Enterprise, 2005). Other cases of BSC application are Veolia Water North America (Balanced Scorecard Institute, 2009), Anglian Water (Bepp, 2002), Wessex Water (Wessex Water, 2009), and Severn Trent Water (Smith and Connolly, 2008). In this paper, the internal point of view of an organization (WaSC) is replaced by that of regulator bodies, which monitor the WaSCs by means of the four BSC perspectives. The Financial, Customer, Internal Business Process and Learning and Growth perspectives are then contextualized to the specific regulator context as it will be better explained in Section 3.1. However, the fact that the regulator should able to influence the internal business process remains a tricky issue.
3. Merging current PMSs In order to build a common set of key performance indicators, local and regional PMSs are merged according to the following steps: 1. definition of strategic goals according to BSC perspectives; 2. building of the relationship matrix between strategic goals and key indicators of current PMSs; 3. analysis of goals coverage; 4. analysis of key performance indicators redundancy. Each step is described in detail in the following.
3.1 Definition of common strategic goals A list of strategic goals common to the different regulator bodies is structured according to the BSC model. For each BSC perspective, goals have been identified on the basis of national and regional regulations, contracts among regulator bodies and WaSCs, and know-how of the regulator bodies (see Table 1). Figure 2 shows the procedure followed to obtain a shared list of goals. BSC model ensures a homogeneous monitoring of all the performance areas of WaSCs by the regional and local bodies. Table 1 reports the obtained list of strategic goals. Customer perspective considers both external (i.e. final) and internal customers (i.e. employees).
5
Definition of a reference model to identify the performance areas to be monitored (e.g. Balanced Scorecard)
Identification of common reference documents (e.g. national and local regulations, contracts among regulator bodies and WaSC)
Definition/ updating of the list of strategic goals by the regional service Observatory
Sharing of the list with local Authorities
No
Does this list contain all relevant goals? Yes
No
Are all the goals significant and strongly affected by the WaSCs performance? Yes Final list of common strategic goals
Figure 2: Flow chart of the procedure to define common strategic goals.
6
Table 1: Strategic goals for the monitoring of WaSCs (Table 1(a)). Goals are organized according to Balanced Scorecard perspectives (Kaplan and Norton, 1992; 1996; 2001b) basing on the normative documents listed in Table 1(b). The importance is the median value of the weights assigned by regional and local regulator bodies. Legend 5: very important; 4: important; 3: quite important; 2: less important; 1: not important at all. Table 1.(a) – Strategic goals BSC perspectives 1. Financial
2. Customer
3. Internal business process
4. Learning and growth
Strategic goals 1.1 Ensure revenues from billing 1.2 Contain operating costs 1.3 Contain costs of financial supply 1.4 Repay loans 1.5 Payment of fees to local bodies 2.1 Respect Service Charter standards 2.2 Provide safe tap water 2.3 Obtain high customer satisfaction 2.4 Reduce working accidents 3.1 Respect of scheduling of infrastructural investments 3.2 Reduce blockage and flooding incidents from sewers 3.3 Reduce water losses 3.4 Efficiency of energy use (water and wastewater services) 3.5 On time delivery of data from WaSC 3.6 Increase the population served by wastewater treatment plants 3.7 Compliance with normative limit values for discharges of public sewer 4.1 Increase Research and Development activities 4.2 Increase personnel training 4.3 Adopt Quality certification
Importance 3 4 4 5 4 4 5 4 4 5 4 3 3 3 4 5 4 3 2
Table 1(b) – Normative documents used to identify goals Reference documents (1) (2)
(3) (3) (4) (5) (6) (7)
Repubblica Italiana, legge 36/1994. Disposizioni in materia di risorse idriche. Regione Piemonte, legge 13/1997. Delimitazione degli ambiti territoriali ottimali per l’organizzazione del servizio idrico integrato e disciplina delle forme e dei modi di cooperazione tra gli Enti Locali ai sensi della Legge 5 gennaio 1994, n. 36 e successive modifiche e integrazioni. Indirizzo e coordinamento dei soggetti istituzionali in materia di risorse idriche. Repubblica Italiana, Decreto Legislativo n.31/2001. Attuazione della direttiva 98/83/CE relativa alla qualità delle acque destinate al consumo umano. Repubblica Italiana, Decreto Legislativo n.152/2006. Norme in materia ambientale. Autorità d’Ambito n. 2 “Biellese, Vercellese, Casalese”. Convenzione regolante i rapporti tra l’Autorità d’Ambito, il gestore del servizio idrico integrato ed il coordinatore Atodueacque s.c.a.r.l. [Contents of ‘Convenzione’ are very similar for all the A.ATOs in Piemonte]. Autorità d’Ambito n. 2 “Biellese, Vercellese, Casalese”. Disciplinare tecnico allegato alla Convenzione [Contents of this document are very similar for all the A.ATOs in Piemonte]. Carta del servizio idrico Integrato (2006). Regione Piemonte (2007) Piano di Tutela delle Acque (PTA). Sezione C – Norme di Piano.
3.2 Building the relationship matrix The second step of the methodology entailed the building of the relationship matrix between strategic goals and key indicators. This has been obtained by the application of a technique similar to the Quality Function Deployment (QFD) methodology. QFD is a tool for laying project plan of a new product in a structured and finalized way (Akao 1990). It analyzes the relationship between customer needs and technical characteristics of a product or service by means of the so called Relationship Matrix (see Figure 3a). 7
The relationship matrix may be adapted for the development of a PMS (Franceschini et al. 2009) as shown in Figure 3b. Rows describe the strategic goals while columns report performance indicators. By means of qualitative symbols, in each cell is indicated if a strategic goal influences one or more different performance measurements.
Technical characteristics
Customer requirements
Tech1 Tech2 Req1
■
Req2
▲
...
Techj
....
Techm
■
...
▲
Reqi
Key Performance Indicators
(b)
●
...
Ind1
Strategic goals
(a)
Goal1
▲
Goal2
■
Ind2
...
Indj
....
Indm
● ▲
... Goali
●
■
■
...
Reqn
●
▲ ● Relationship Matrix QFD APPROACH
Goaln
▲ ● Relationship Matrix ADAPTED QFD APPROACH
Figure 3: Building of the relationship matrix between strategic goals and indicators. Legend: ■: Strong relation
●: Medium relation ▲: Weak relation
In this application, rows show the strategic goals of Table 1 and columns report the list of all the indicators of the considered PMSs (i.e. the three local Authorities’ PMSs and one regional PMS). The obtained matrix (“raw matrix”) contained more than a thousand indicators. An extract of the raw relationship matrix is reported in Figure 4. It considers the relations between a subset of indicators proposed by different regulator bodies and goals of the Customer perspective. To give an example, indicators on offered service quality have strong relations with goal 2.1 (‘Respect of Service Charter Standards’) and weak relations with goal 2.3 (‘Obtain high customer satisfaction’) (Franceschini et al., 2010). Relations have been defined by the regional Observatory in cooperation with Local Authorities.
8
2.3
Obtain high customer satisfaction
2.4
Reduce working accidents
Percentage of conforming microbiological tests
▲
Average time to fix pipeline breakdowns
Provide safe tap water
■
Opening hours of customer service (phone)
2.2
■
It
Opening hours of customer service (desk)
Respect of Service Charter standards
Customer satisfaction index
2.1
Water supply per customer per day
Customer perspective
Strategic goals
Percentage of scheduled interruptions
I1
Key Performance Indicators A.ATO 2 PMS …. Regional PMS I2 … In I1 I2 I3 …
■
■
■
▲
▲
▲
■ ▲
▲
■
▲
Figure 4: Extract of the relationship matrix between strategic goals and indicators for the Customer perspective. Legend: ■: Strong relation
●: Medium relation ▲: Weak relation
The raw relationship matrix was then refined by means of the coverage and redundancy analyses in order to obtain a final relationship matrix. Applying an adequate synthesis technique, from this matrix we extracted an overall performance dashboard (see Figure 5). Common strategic goals A.ATO 2 PMS, A.ATO 5 PMS, A.ATO 6 PMS, Regional PMS
Raw relationship matrix Coverage analysis
1st revised relationship matrix Redundancy analysis
Final relationship matrix Application of synthesis technique
Performance dashboard
Figure 5: General scheme of the proposed methodology. The performance dashboard is extracted from the final relationship matrix.
3.3 Goals coverage analysis Balanced Scorecard is widely recognized to be an exhaustive framework in describing the performances of an organization. A set of indicators is covering if it monitors all the strategic goals. 9
If one or more strategic goals are not monitored (i.e. covered) by indicators, than new performance measures are introduced in the relationship matrix. We detected uncovered goals simply identifying the rows of the relationship matrix with no relationships. In the current application, for example it emerged that: -
the goal ‘Reduce working accidents’ of the Customer perspective was not monitored (see Figure 4). Even if contracts among regulator bodies and WaSCs cover this aspect, current PMSs did not consider it. For this reason, an appropriate indicator was defined;
-
the goals ‘Increase Research and Development activities’ and ‘Increase personnel training’ of the Learning and Growth perspective were not covered and specific indicators are proposed.
3.4 Redundancy analysis The obtained raw relationship matrix contained all the performance measures of local and regional PMSs despite of redundant indicators. An indicator is redundant when the goal or goals it monitors are already considered by other indicators, or if it is scarcely significant for the monitored goals (Caplice and Sheffi, 1994; Franceschini et al., 2008). Since the raw relationship matrix included about one thousand indicators, the analysis of redundancy was partially automated. We based this activity on the analysis of correlation among indicators. The correlation degree was expressed in qualitative terms and was more extensive than the concept of statistical correlation. Two indicators were considered correlated if variations of the first one induced variations on the second one. If indicators were identical their correlation degree was maximum. The aim of this procedure was that of identifying indicators with a high level of correlation, deleting redundant ones. Correlation on the basis of the content of the relationship matrix was evaluated. It may be observed that correlated indicators often influence the same strategic goals. To give an example, indicators “revenues from billing per cubic metre” and “revenues from billing” are correlated and both have relations with goal “ensures revenues from billing” (see Table 1). In details, we applied an automatic procedure which identified the indicators monitoring the same strategic goals and calculated a qualitative correlation coefficient qij for each couple of indicators i and j (for more details see Anderberg, 1973 and Franceschini et al., 2002, a simple example is also reported in Appendix 1). If qij is close to 1, indicators i and j are potentially correlated and redundant. The analyst considers such indicators and verifies if one of them should be deleted. Again for example, indicators “revenues from billing per cubic metre” and “revenues from billing” have a correlation coefficient qij = 1. In this case we delete “revenues from billing”, since we want to compare WaSCs with different size (in terms of cubic metres of water provided). 10
Synthetically, the steps of the procedure for the correlation analysis are the following: 1. identification of indicators monitoring the same strategic goals; 2. calculation of the correlation matrix. Each matrix element qij ∈ (0, 1) expresses the qualitative level of correlation among indicator i and j. If qij is close to 1 a potential high correlation exists; 3. definition of a threshold k ∈ (0, 1) for the correlation coefficient qij. If qij ≥ k indicators are considered potentially redundant; 4. analysis of potential redundant indicators. Basing on the analyst opinion, redundant indicators are deleted. It is worth noting that the procedure described above identifies only potential redundancies. For example, indicators “Opening hours of customer service (desk)” and “Opening hours of customer service (phone)” influence the same strategic goals (see Figure 4) and, on the basis of the correlation analysis, they have qij = 1. However, they monitor two important and distinct ways for customers to contact the service supplier, so they were not deleted. At the end of redundancy analysis, a final relationship matrix of about 600 indicators was obtained. The threshold k was fixed to 1 in order to exclude only very similar indicators. Adopting a less conservative approach (k < 1) a higher number of indicators may be negleted. The performance dashboard was then extracted from this common base of key indicators.
4. The performance dashboard 4.1 Main approaches for indicators synthesis The performance dashboard was built from the common base of KPI previously identified. In literature several approaches to synthesize the information contained in a large set of indicators are presented (Performance Base Interest Group, 2001; Franceschini et al., 2007; Cabrera Jr., 2001). Two main opposite approaches can be proposed: 1. aggregation procedures to obtain one or more “super indicators” from the original set; 2. distillation procedures to extract the most representative indicators from the original set. In the current paper the second approach is applied. The application of aggregation procedures (e.g.: simple or weighted average, multiplicative models, …) which synthesize the overall WaSC performance in a single aggregated indicator may originate several pitfalls. Some of these are summarized in the next Sections.
11
Costs of data acquisition and aggregation A ‘super-indicator’ is built aggregating a large volume of data. All the basic indicators included in it has to be collected from all the compared WaSCs. This generates high costs and long time for data acquisition and assessment.
Simplicity of use KPIs included into the dashboard must be easy to understand and use. For example, a superindicator IA “Level of offered service” may contain information about water supply (liters per day per capita), length of water service interruption (days), and number of interruptions. Moreover, IA may refer to different services (water supply and sewage). In general, given a certain value of a super-aggregated indicator, it is difficult to associate a precise physical meaning to it.
Effect of normalization of indicators Normalization is a practice often adopted when indicators with different units of measurement are aggregated. In this way, sub-indicators are all expressed on a [0,1] scale. Normalization operates as follows:
I norm =
I actual value − I min value I max value − I min value
∈ [0,1]
(1)
However, this procedure may have some disadvantages. When there are no normative standards, fixing the maximum and minimum thresholds is arbitrary. For example, the maximum value (Imax value)
may be set considering the highest levels of performance among the monitored WaSCs.
However, this value may change over the years and this affects negatively the comparability of performances. In general, the arbitrariness in setting the thresholds for normalization makes the ranking of companies not unique. When the minimum or maximum limits (Imin
value
or Imin
value)
change, the ranking of companies may reverse (Franceschini et al., 2007).
Compensation If changes of sub-indicators compensate each other without making the aggregated indicator value change, then the derived indicator fulfils the property of compensation (Franceschini et al., 2007). Due to the property of compensation, two WaSCs may be considered equally performing even if this is not the case.
12
4.2 Proposal for a distillation procedure
In order to overcome some limitations of the aggregation procedures described in the previous Section, a performance dashboard is constructed using a distillation procedure. The procedure was organized in such a way to consider the correlation among indicators and the coverage of all the strategic goals. In detail the steps were (Franceschini et al., 2009): Step 1) Construction of the correlation matrix among indicators and fixing of a correlation threshold k (see Section 3.4); Step 2) Indicators which have no correlations are removed and included into the Dashboard. Then the following procedure is applied: 2.1) selection of the indicator which has the highest number of correlations. If two indicators have the same number of correlations, then the local and regional bodies identify the most relevant; 2.2) removal from the correlation matrix and inclusion in the dashboard of the selected indicators; 2.3) removal from the correlation matrix of all the other indicators correlated with the indicator selected at step (2.1); 2.4) iteration of the procedure until the correlation matrix is empty (excluding elements on its diagonal). Step 3) If the obtained set is not covering, increase k and go to Step 1), else STOP. The threshold k is fixed on an empirical basis in order to obtain a set of indicators (i.e. the dashboard) covering all the monitored goals. The rationale of the distillation procedure is that the lower is k, the smallest is the set of indicators in the dashboard. k is fixed in order to obtain a coverage of the strategic goals. As an example, Table 4 reports two outputs of the procedure for the performance dashboard of the Customer perspective. With a threshold k = 0.50 the set of indicators was not covering (the goal 2.2 “Provide safety tap water” was not monitored). Then the threshold is set to k = 0.90 and a covering set is obtained since indicator “percentage of conforming microbiological tests” entered in the dashboard. Final dashboard indicators covered all the strategic goals and monitored independent aspects of the service. The proposed heuristic always guarantees a covering (but not necessarily the minimum) subset of indicators.
13
Table 4: Performance dashboard for the Customer perspective. Correlation among indicators is considered. When the correlation threshold k is fixed to 0.90 a covering dashboard is obtained. Dashboard indicators (k = 0.50) 1 Customer satisfaction index 2 Number of working accidents per FTE employee
Covered strategic goals 2.1, 2.3 2.4
Dashboard indicators (k = 0.90) 1 Customer satisfaction index 2 Percentage of conforming microbiological tests 3 Percentage of scheduled water service interruptions 4 Number of working accidents per FTE employee
Covered strategic goals 2.1, 2.3 2.2 2.1, 2.3 2.4
4.3 Performance dashboard for the monitoring of the WaSCs
Applying the distillation technique described in the previous Section, a performance dashboard for each BSC perspective was built (Table 5). In order to improve the consistency of indicators with the considered goals, some of the performance measures were redefined. For example, in the Customer perspective the indicator ‘Percentage of conforming microbiological tests’ (see Table 4) has been replaced by ‘Percentage of conforming microbiological and chemical tests’, since both tests are necessary to consider the water drinkable (D.Lgs. 31/2001). Moreover, the ‘Percentage of scheduled water service interruptions’ (see Table 4) was replaced by the ‘Water interruption index’, which considers the average length of interruptions longer than 12 hours weighted by the number of customers subjected to them. This indicator aims to detect the most critical interruptions for customers according to the Service Charter standards (Carta del Servizio Idrico Integrato, 2006). A card containing the name, identification code, definition, scope, unit of measurement, frequency of data collection and target value was associated to each dashboard indicator. The target value was defined considering the limits imposed by regulations and benchmarking among WaSCs when standards were not explicitly set by regulations. In general, if an indicator does not respect a target value, a warning signal is activated. In this case, the regional and local bodies investigate the causes of underperforming in collaboration with WaSCs. Figure 6 shows an example of comparison of WaSCs performances. Appendix 2 reports the list of dashboard indicators. It is worth noting that the number of indicators in the dashboard may be further reduced decreasing k threshold as explained in Section 4.2.
14
Table 5: Final performance dashboards for the WaSCs monitoring. (a) Financial perspective Indicators I.1 Revenues from billing per cubic meter (final vs. budget) I.2 Operational expenses per cubic meter (final vs. budget) I.3 Financial expense per cubic meter I.4 Net Income per cubic meter I.5 Payment of loans (paid vs. required) I.6 Payment of fees to Local bodies (paid vs. required) (b) Customer perspective Indicators II.1 Water service interruptions index II.2 Customer satisfaction index II.3 Percentage of conforming microbiological and chemical tests II.4 Number of working accidents per FTE employee (c) Internal Business Process perspective Indicators III.1 Built infrastructures (actual vs. planned) III.2 Number of sewers incidents per km III.3 Water losses knowledge index III.4 Cost of energy consumption per Kwh III.5 Total delay of data delivery (days) III.6 Population served by wastewater treatment plants vs. population served by sewage system (%) III.7 Percentage of conforming wastewater tests (d) Learning and growth perspective Indicators IV.1 R&D activities index (actual vs. planned) IV.2 Training hours per employee per year IV.3 Percentage of Quality certifications adopted
Covered strategic goals 1.1 1.2 1.3 All 1.4 1.5
Covered strategic goals 2.1, 2.3 2.1, 2.3 2.2 2.4
Covered strategic goals 3.1, 3.3 3.2 3.1, 3.3 3.4 3.5 3.6 3.7
Covered strategic goals 4.1 4.2 4.3
15
Figure 6: Example of analysis of WaSCs performance for the Customer perspective. In Table II a light grey cell signals that the indicator has a value higher than the target (dark grey on the opposite) while the arrow near the indicator value shows if it is increased or decreased with respect to the previous year. Graphics show: a comparison among Companies on all indicators of the dashboard (A), a comparison among Companies on a single indicator (B) and analysis of trend for each Company (C).
16
5. Conclusions
The monitoring of Water and Sewage Companies (WaSCs) performance is a critical issue because of the natural monopoly tendencies of the service provided. Moreover, in a complex regulatory system where different regional and local bodies share the task of WaSCs monitoring, a common set of key performance indicators is necessary. This paper describes the methodology applied to define a performance dashboard for Water and Sewage Companies operating in Piemonte (Italy). In the considered context, each local and regional regulator body applied its specific set of performance indicators. In order to support the definition of common regional standards for WaSCs performance, the existing Performance Measurement Systems are merged in a structured way. The Kaplan and Norton’s Balanced Scorecard (BSC), a well known and largely applied framework describing organizations performances, is adopted as the reference model. BSC supports the different steps in the building of a performance dashboard which include the definition of common strategic goals, the analysis of goals coverage by indicators, the analysis of redundancy and the distillation of a subset of critical indicators. The obtained performance dashboard enables a synthetic, balanced and exhaustive monitoring of the Water and Sewage Companies. Moreover, the definition of common performance measures reduces the coordination efforts among the regulator bodies. Future work will consider more in detail the impact on water service exerted by the proposed performance dashboard.
Acknowledgments
We would like to acknowledge all the staffs of Regione Piemonte - Direzione Ambiente, Autorità d’Ambito n.2 - Biellese, Vercellese Casalese, Autorità d’Ambito n.5 - Astigiano e Monferrato, Autorità d’Ambito n.6 - Alessandrino. Special gratefulness to Ing. Salvatore De Giorgio, Ing. Orazio Ruffino and Ing. Giorgio EnriettiOslino for their continuous support.
References
Akao, Y. (1990) Quality function deployment. Productivity, Cambridge. Alegre, H., Baptista, J.M., Cabrera Jr., E., Cubillo, F., Duarte, P., Hirner, W., Merkel, W., Parena, R. (2006) Performance indicators for water supply services – 2nd edition, IWA Publishing, London. Anderberg M. R. (1973) Cluster analysis for applications, New York, NY, Academic Press. Autorità d’Ambito n. 2 “Biellese, Vercellese, Casalese”, Convenzione regolante i rapporti tra l’Autorità d’Ambito, il gestore del servizio idrico integrato ed il coordinatore Atodueacque 17
s.c.a.r.l. Available at http://www.ato2piemonte.it/documenti/DOCUMENTI/Convenzione_1206-07.pdf. Accessed 10 June 2011. Balanced Scorecard Institute, Strategy Management Group (2009) Veolia Water uses Balanced Scorecard to Drive North American Strategy. Available at http://www.balancedscorecard.org/LinkClick.aspx?fileticket=8Zup08adIQg%3d&tabid=36 Accessed 1 March 2011. Barraqué, B. (1995) Les politiques de l’eau en Europe. Paris : La découverte. Barrett, G., Wallace, M. (2011) ‘An Institutional Economics Perspective: The Impact of Water Provider Privatisation on Water Conservation in England and Australia’, Water Resources Management, DOI 10.1007/s11269-010-9747-0. Bebb, P. (2002) Draw of the Scorecard. Available at http://www.performancemeasurement.net/news-detail.asp?nID=33. Accessed 1 March 2011. Bianchi, C., Montemaggiore, G.B. (2008) ‘Enhancing strategy design and planning in public utilities through “dynamic” balanced scorecards: insights from a project in a city water company’, System Dynamics Review, Vol. 24, No. 2, pp. 175-213. Cabrera Jr. E., (2001). Diseño de un sistema para la evaluación de la gestión de abastecimientos urbanos. PhD Thesis, Universidad Politecnica de Valencia. Available at http://www.ita.upv.es/formacion/fichatrabajo-en.php?id=125. Accessed 10 June 2011. Caplice, C., Sheffi ,Y. (1994) A Review and Evaluation of Logistics Metrics. The International Journal of Logistics Management, Vol. 5, No. 2, pp. 11-28. Carta del servizio idrico Integrato. Available at http://www.ato2piemonte.it/documenti/DOCUMENTI/Carta_servizio_2006.pdf. Accessed 10 June 2011. EPA (United States Environmental Protection Agency), WEF (Water Environment Federation) (2004) Continual Improvement of Utility Management: A Framework of Integration. Available athttp://www.charlestonwater.com/documents/continual_improvement_in_untility_management .pdf. Accessed 1 March 2011. ERSAR (Entidade Reguladora dos Serviços do Águas e Resíduos) (2009) Relatório Anual do Sector de Águas e Resíduos em Portugal (RASARP), Available at http://www.ersar.pt/website/ViewContent.aspx?SubFolderPath=&Section=MenuPrincipal&Fina lPath=RASARP&FolderPath=%5cRoot%5cContents%5cSitio%5cRASARP. Accessed 10 June 2011. Franceschini F., Galetto M., Maisano D., (2007) Management by Measurement: Designing Key Indicators and Performance Measurements, Berlin, Springer. Franceschini, F. (2002) Advanced Quality Function Deployment, Boca Raton, FL: St. Lucie Press. Franceschini, F., Galetto, M., Turina, E. (2009) ‘Service Quality monitoring by performance indicators: a proposal for a structured methodology’, International Journal of Services and Operations Management, Vol. 5, No. 2, pp. 251-273. Franceschini, F., Galetto, M., Turina, E. (2010) ‘Water and sewage service Quality: a proposal of a new multi-questionnaire monitoring tool’, Water Resources Management, Vol. 24, No. 12, pp. 3033-3050. Franco, M., Bourne, M. (2003) Business performance measurement systems: a systematic review. POMS/EurOMA Conference, Lake Como, June 2003.
18
Gialis, S.E., Loukas, A., Laspidou C.S. (2011) ‘Theoretical Perspectives and Empirical Facts on Water Sector Privatization: The Greek Case Against European and Global Trends’, Water Resources Management, DOI 10.1007/s11269-010-9769-7. Hauser, J., Katz, G. (1998) ‘Metrics: You Are What You Measure!’, European Management Journal, Vol. 16, No. 5, pp.517-528. ISO 2007: 24510 Activities relating to drinking water and wastewater services – Guidelines for the assessment and for the improvement of the service to users. ISO 2007: 24511 Activities relating to drinking water and wastewater services – Guidelines for the management of wastewater utilities and for the assessment of wastewater services. ISO 2007: 24512 Activities relating to drinking water and wastewater services – Guidelines for the management of drinking water utilities and for the assessment of drinking water services. Kaplan, R.S., Norton, D.P. (1992) ‘The balanced scorecard-measures that drive performance’, Harvard Business Review, No. 70, pp. 71-79. Kaplan, R.S., Norton, D.P. (1996) The Balanced Scorecard: Translating Strategy into Action, Cambridge, MA: Harvard Business School Press. Kaplan, R.S., Norton, D.P. (2001a) ‘Marked impact (the balanced scorecard)’, People Management, Vol.2, No. 21, pp. 52-55. Kaplan, R.S., Norton, D.P. (2001b) The Strategy Focused Organisation: How Balanced Scorecard Companies Thrive in the New Business Environment, Boston, MA: Harvard Business School Press. Lepage, H. (1997) Le choix régie publique contre gestion déléguée. Available at http://ami.du.laissez-faire.eu/_lepage2.php5. Accessed 26 July 2011. Lohman, C., Fortuin, L., Wouters, M. (2004), ‘Designing a performance measurement system: A case study’, European Journal of Operational Research, Vol. 156, pp. 267-286. Matos, R., Cardoso, A., Ashley, R., Duarte, P., Molinari, A., Schulz, A. (2003) Performance indicators for wastewater services, IWA Publishing, London. Neto, F. (1998) ‘Water privatization and regulation in England and France : a tale of two models’, Natural Resources Forum, Vol. 22, No. 2, pp. 107-117. Ofwat (2008) Level of service for the water industry in England and Wales. 2006-2007 Report. Available at http://www.ofwat.gov.uk/regulating/reporting/rpt_los_0607.pdf. Accessed 1 March 2011. ONEMA (Office National de l’Eau et des Milieux Aquatiques) (2009) Creation of an observatory on the performance of public water and water-treatment services, Available at http://www.onema.fr/IMG/EV/EV/plus/Fiche-Observatoire.pdf. Accessed 10 June 2011. Performance-Based Management Special Interest Group (PBM SIG) (2001), The PerformanceBased Management Handbook, vol 1, Establishing and Maintaining A Performance-Based Management Program, Oak Ridge Institute for Science and Education, (ORISE) – U.S. Department of Energy. Regione Piemonte (2007) Piano di Tutela delle Acque (PTA). Sezione C – Norme di Piano, Available at http://www.regione.piemonte.it/acqua/pianoditutela/norme/dwd/norme.pdf, Accessed 10 June 2011. Regione Piemonte, legge 13/1997 (1997) Delimitazione degli ambiti territoriali ottimali per l’organizzazione del servizio idrico integrato e disciplina delle forme e dei modi di cooperazione tra gli Enti Locali ai sensi della Legge 5 gennaio 1994, n. 36 e successive 19
modifiche e integrazioni. Indirizzo e coordinamento dei soggetti istituzionali in materia di risorse idriche. Available at http://arianna.consiglioregionale.piemonte.it/ariaint/TESTO?LAYOUT=PRESENTAZIONE&T IPODOC=LEGGI&LEGGE=013&LEGGEANNO=1997. Accessed 1 March 2011. Repubblica Italiana, Decreto Legislativo 3 aprile 2006, n. 152, Norme in materia ambientale. Available at http://www.camera.it/parlam/leggi/deleghe/06152dl.htm. Accessed 10 June 2011. Repubblica Italiana, Decreto Legislativo n.31/2001 (2001) Attuazione della direttiva 98/83/CE relativa alla qualità delle acque destinate al consumo umano. Available at http://www.camera.it/parlam/leggi/deleghe/testi/01031dl.htm. Accessed 1 March 2011. Repubblica Italiana, legge 36/1994 (1994) Disposizioni in materia di risorse idriche. Available at http://www.regione.piemonte.it/bdgiur/download?nomefile=05_01_1994_36.htm. Accessed 1 March 2011. Rocha Fernandes, B.H., Mills, J.F., Fleury, M.T.L. (2005) ‘Resources that drive performance: an empirical investigation’, International Journal of Productivity and Performance Management, Vol. 54, No.5/6, pp. 340-354. Smith, A., Connolly, S. (2008) Implementing lean process management in Severn Trent Water. Institute of Water. Available at http://www.iwo.org.uk/images//eventImages/AndySmithSeanConnolly65.ppt. Accessed 1 March 2011. Tebbutt, R.J., Cochin, R.J., Lester, J.N. (2003) ‘Balanced scorecard investment appraisal in the water industry of England and Wales’, Environmental Technology, Vol. 24, No. 7, pp. 845-854. Water Utility Enterprise. Annual Business Plan Fiscal Year 2005. Available at http://www.valleywater.org/media/pdf/FY05%20WUE%20ABP%20Final.pdf. Accessed 1 March 2011. Wessex Water (2008) Sustainability indicators 2008. Available at http://www.wessexwater.co.uk/WorkArea/showcontent.aspx?id=2684. Accessed 1 March 2011.
20
Appendix 1 – Analysis of correlation
Here follows a simple example of redundancy analysis based on qualitative correlation among indicators (Franceschini et al., 2007).
■: Strong relation ●: Medium relation ▲: Weak relation
Normalization of B column vectors: n ij =
bij n
∑b i =1
2 ij
Encoding of R-matrix symbols:
T
■=9 ●=3 ▲ =1
T
Q = N x N, qij = ni ⋅ nj = cos (ni, nj) ∀ i, j = 1, …, m qij ∈ (0, 1) express the qualitative degree of correlation among indicators. It is the direction cosine of B matrix column vectors. A qij close to 1 indicates a potential high degree of correlation between two indicators.
Choice of a threshold k (0 ≤ k ≤ 1). If qij ≥ k, then i-th and j-th indicators are potentially correlated and a “X” is reported in Q’ matrix. Here k is fixed to 1.
21
Appendix 2 – Dashboard Indicators
Here follows the definitions of dashboard indicators. They all refer to a given year t. CODE I.1
DEFINITION Revenues from billing per cubic meter (final vs. budget)
Rm3 _ FINAL − Rm3 _ BUDGET Rm3 _ BUDGET
I.2
× 100
%
Rm3_FINAL: final revenues of integrated water service (€) per cubic meter Rm3_BUDGET: budget revenues of integrated water service (€) per cubic meter Operational expenses per cubic meter (final vs. budget)
Op expm3 _ FINAL − Op expm3 _ BUDGET Op expm3 _ BUDGET
I.3
×100
%
Payment of fees to local bodies (paid vs. required)
FeesPAID × 100 FeesREQUIRED II.1
€/m3
Vol.: average volume of supplied water and collected and treated wastewater Payment of loans (paid vs. required)
Loans PAID × 100 Loans REQUIRED I.6
€/m3
Vol.: average volume of supplied water and collected and treated wastewater Net Income per cubic meter
Net IncomeFINAL Vol. I.5
%
Op exp m3_FINAL: final operational expenses of integrated water service (€) per cubic meter Op exp m3_BUDGET: budget operational expenses of integrated water service (€) per cubic meter Financial expenses per cubic meter
Financial_expenses Vol. I.4
U.M.
%
Water service interruptions index n
∑t C i
i =1 n
∑C i =1
II.2
i
hours i
ti: water interruption i length (ti ≥12 hours) (i = 1, …, n) Ci: number of customers affected by water interruption i Customer satisfaction index (Franceschini et al., 2010) n
∑A
O &G _ i
i =1
n
∑A i =1
II.3
× 100 %
i
AO&G_i: number of ‘Optimum’ and ‘Good’ answers in questionnaire i; Ai: total number of answers in questionnaire í; n: sample of interviewed customers Percentage of conforming microbiological and chemical tests
Conforming water tests × 100 total number of water tests
%
22
II.4
Number of working accidents per FTE (Full Time Equivalent) employee
Working accidents fte employees III.1
Built infrastructures (actual vs. planned)
Infrastructure ACTUAL × 100 Infrastructure PLANNED III.2
IDISTRICT: number of districts (i.e. portion of the water system monitored for water losses) IDISTRICT_POP: population served by water service in all districts Cost of energy consumption per kWh
Cost of energy consumption Energy consumption III.5
n
days
Population served by wastewater treatment plants (WTP) vs. population served by sewage system (SS)
Population _ servedWTP × 100 Population _ served SS
%
Percentage of conforming wastewater tests
Conforming wastewater tests ×100 total number of wastewater tests IV.1
€/kWh
i
i =1
III.7
No
Total delay of data delivery (deadline index i = 1, …, n)
∑ delay III.6
No/km
Water losses knowledge index
I DISTRICT ∗ I DISTRICT _ POP
III.4
%
Infrastructure ACTUAL: built infrastructures (actual) (€) Infrastructure PLANNED: built infrastructures (planned) (€) Number of sewer incidents per km
Sewer incidents lenght of sewage system III.3
No
%
R&D activities index (actual vs. planned) n
∑ (R & D)
i
i =1
n
IV.2
× 100
R&Di: i-th R&D activity (i = 1, …, n) R&Di = 1 if the i-th R&D activity of a predefined list is realized (n activities in the list) R&Di = 0 else Training hours (H) per FTE (Full Time Equivalent) employee
H fte employees IV.3
%
hours
Percentage of Quality certifications adopted n
∑C i =1
n
i
×100
%
Ci: i-th Quality certification (i = 1, …, n) Ci = 1 if the i-th Quality certification of a predefined list is adopted (n certifications in the list) Ci = 0 else
23