Computer Science and Software Engineering. ISSN: 2277-128X ... Keywordsâclassification, clustering, k-means clustering, density based clustering. I. INTRODUCTION .... The comparison result shows that the Proposed MDBC is having the.
International Journals of Advanced Research in Computer Science and Software Engineering ISSN: 2277-128X (Volume-7, Issue-6)
Research Article
June 2017
Proposed Density Based Clustering with Weighted Euclidean Distance Sunila Godara Assistant Prof., Department of CSE, GJUST, Hisar, Haryana, India
Rishipal Singh Professor, Department of CSE, GJUST, Hisar, Haryana, India
Sanjeev Kumar Assistant Prof., Department of CSE, GJUST, Hisar, Haryana, India
DOI: 10.23956/ijarcsse/V7I6/0190
Abstract- Clustering is an unsupervised classification that is the partitioning of a data set in a set of meaningful subsets. Each object in dataset shares some common property- often proximity according to some defined distance measure. In this paper Simple K-means, the makeDensityBased Cluster are analyzed. Enhancement of makeDensityBased Cluster(MDBC) is proposed. We evaluated the performance of makeDensityBased Clustering, KMeans and proposed MDBC algorithms using the medical datasets on accuracy basis. Proposed algorithm is superior to the existing makeDensityBased Clustering algorithm. Keywords—classification, clustering, k-means clustering, density based clustering. I. INTRODUCTION Clustering is a type of categorization inflicted rules on a group of objects. A broad definition of clustering could be “the process of categorizing a finite number of objects into groups where all members in the group are similar in some manner”. As a result, a cluster is an aggregation of objects. All objects in the same cluster have common properties (e.g. distance) which are different to the objects lying in other clusters [1,11]. Cluster analysis of data is an important task in knowledge discovery and data mining. Cluster analysis aims to group data on the basis of similarities and dissimilarities among the data elements. The process can be performed in a supervised, semi-supervised or unsupervised manner. Different algorithms have been proposed which take into account the nature of the data and the input parameters in order to cluster the data. Data vectors are clustered around centroid vectors. The cluster the data vector belongs to is determined by its distance to the centroid vector. Depending on the nature of the algorithm, the numbers of centroid are either defined in advance by the user or automatically determined by the algorithm. Finding the optimum number of clusters or natural groups in the data is not a trivial task. The popular clustering approaches suggested so far are either partition based or hierarchy based, but both approaches have their own advantages and limitations in terms of the number of clusters, shape of clusters, and cluster overlapping [1] .Some other approaches are based upon hybridization of different clustering techniques and involve optimization in the process. The involvement of intelligent optimization techniques has been found effective to enhance the complex, real time, and costly data mining process. II. CLUSTERING The Clustering is the process of grouping the similar data items. It is the unsupervised learning techniques, in which the class label will not be provided. The Clustering methods are Partitioned clustering, Hierarchical methods, Density based clustering, Sub Space Clustering [2]. Hierarchical algorithms find successive clusters using previously established clusters. These algorithms usually are either agglomerative ("bottom-up") or divisive ("top-down"). Agglomerative algorithms begin with each element as a separate cluster and merge them into successively larger clusters. Divisive algorithms begin with the whole set and proceed to divide it into successively smaller clusters. Partitioned algorithms typically determine all clusters at once, but can also be used as divisive algorithms in the hierarchical clustering [3,12,13]. Density-based clustering algorithms are devised to discover arbitrary-shaped clusters. In this approach, a cluster is regarded as a region in which the density of data objects exceeds a threshold. DBSCAN [6] and OPTICS are two typical algorithms of this kind. Subspace clustering methods look for clusters that can only be seen in a particular projection (subspace, manifold) of the data. These methods thus can ignore irrelevant attributes. The general problem is also known as Correlation clustering while the special case of axis-parallel subspaces is also known as Two-way clustering, coclustering or bi-clustering: in these methods not only the objects are clustered but also the features of the objects, i.e., if the data is represented in a data matrix, the rows and columns are clustered simultaneously [4,12,13]. They usually do not however work with arbitrary feature combinations as in general subspace methods. But this special case deserves the attention due to its applications in the field of bioinformatics. Conceptual clustering is a machine learning paradigm for unsupervised classification developed mainly during the 1980s. It is distinguished from ordinary data clustering by generating a concept description for each generated class [3]. A. K-means clustering The k-means algorithm is most well known partitioning method for clustering. K-means clustering method grouped data based on their closeness to each other according to Euclidean distance. In this clustering approach user decide that how © www.ijarcsse.com, All Rights Reserved
Page | 409
Godara et al., International Journals of Advanced Research in Computer Science and Software Engineering ISSN: 2277-128X (Volume-7, Issue-6) many clusters should be and on the basis of closeness of data vector to the centroid which is mean of the data vector of cluster is assigned to those clusters which show minimum distance. The steps are[11,13]: Calculate the mean value of each cluster, and use this mean value to represent the cluster; Re-distribute the objects to the closest cluster according to its distance to the cluster center and the distance is calculated using Euclidean distance method which is
Where n is the number of variables, and Xi and Yi are the values of the ith variable, at points X and Y respectively. Update the mean value of the cluster, say, calculate the mean value of the objects in each cluster; Calculate the criterion function E, until the criterion function converges.
Usually, the K-mean algorithm criterion function adopts square error criterion, defined as:
Here, E is total square error of all the objects in the data cluster, p is given data object, mi is mean value of cluster Ci (p and m are both multi-dimensional). The function of this criterion is to make the generated cluster be as compacted and independent as possible [5]. B. Make Density Based Clustering The cluster will be constructed based on the density properties of the database are derived from a human natural clustering approach. The clusters and consequently the classes are easily and readily identifiable because they have an increased density with respect to the points they possess. The elements of the database can be classified in two different types: the border points, the points located on the extremities of the cluster, and the core points, which are located on its inner region [8]. DBSCAN is not entirely deterministic it means border points that are reachable from more than one cluster can be part of either cluster, depending on the order the data is processed.The quality of DBSCAN depends on the distance measure used in the function regionQuery(P,ε). The most common distance metric used is Euclidean distance. The "Curse of dimensionality" makes it difficult to find an appropriate value for ε. DBSCAN cannot cluster data sets well with large differences in densities, since the minPts-ε combination cannot then be chosen appropriately for all clusters. III. PROPOSED MAKEDENSITYBASED (MDBC) CLUSTERING The modification took place in two parts: Part 1: K-means clustering method groups data based on their closeness to each other using weighted Euclidean distance [7] instead of Euclidean distance. The rest of the process is same. Now the steps are Calculate the mean value of each cluster, and use this mean value to represent the cluster; Re-distribute the objects to the closest cluster according to its distance to the cluster center and the distance is calculated using Euclidean distance method which is
Where var is the variance of total instances and, n is the number of variables, and Xi and Yi are the values of the ith variable, at points X and Y respectively. Update the mean value of the cluster, say, calculate the mean value of the objects in each cluster; Calculate the criterion function E, until the criterion function converges.
Patr2 : In the phase II, in makeDensityBased Clustering, clusters are constructed based on the density properties of database. The mass is the number of data points in the neighborhood of point p, let us consider mass = 31. The volume is the area of the circle if two dimensions are considered, so volume = π0.52 = π/4. Therefore, our local density approximation at p = is calculated as : density = mass/volume = 31/(π/4) = 124/π ~= 39.5. Estimate the density of a given point using k-NN density estimation[10], we are going to find the distance to the Kth nearest point, dk, and use this as the radius of our neighborhood. Doing this, we obtain a neighborhood in the region of our point with exactly k other points in it. The mathematical equation for the k-Nearest Neighbor estimator is given as: © www.ijarcsse.com, All Rights Reserved
Page | 410
Godara et al., International Journals of Advanced Research in Computer Science and Software Engineering ISSN: 2277-128X (Volume-7, Issue-6)
In this equation, k is number of points we want in our neighborhood, xi is our given point, n is the number of points in the dataset, vd is the volume of the d-dimensional Euclidean ball, and rkd(xi) is the distance to the kth nearest point. Here the modification is carried out by changing the density per instance using KNN assuming normal distribution and weighted Euclidean distance. An overall average runtime complexity of O(n log n) is obtained. The worst case run time complexity remains O(n²). The distance matrix of size (n²-n)/2 can be materialized to avoid distance recomputations. IV. RESULT AND EXPERIMENTAL DETAILS The experimentation detailed in this section was carried out within the Waikato Environment for Knowledge Analysis (WEKA) [9] . The performance of clustering algorithms is evaluated by using the medical datasets. In the first step, the data is applied into the preprocessing techniques. After this preprocessing, the data is applied into the clustering algorithm. Then the performance will be computed by using correctly predicted instance [10,11].
The following result shows the performance of clustering algorithm with correctly and incorrectly instance. Table I: Performance of Clustering Algorithm K-Means
Diabetics Lung Cancer Liver Disorders
56.38 59.38 46.37
makeDensit yBased Cluster 56.13 55.63 42.35
Proposed makeDensity BasedCluster 57.14 61.38 48.12
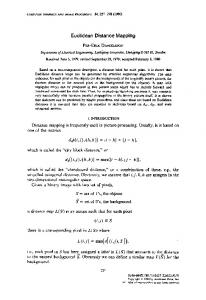
The above table I contains the performance of clustering algorithms. The Proposed MDBC having better performance in comparison to Simple K-means and makeDensityBasedClusterer. The Simple K-means algorithm is having the lowest performance. Figure 1 shows the performance of clustering algorithm on the medical datasets in terms of accuracy. 180 160 140 120 100 80
Liver Disorders
60 40
Lung Cancer
20
0
Diabetics
Figure: 1 Evaluation Graph V. CONCLUSION The result demonstrates that the makeDensityBased clustering algorithm achieve better results after including weighted Euclidean distance . It is found that the proposed approach performed well as compared to K-means and makeDensityBasedCluster in terms of accuracy. The comparison result shows that the Proposed MDBC is having the highest prediction Accuracy. In the future this research can be extended into RBF Neural Networks for RBF center initialization. © www.ijarcsse.com, All Rights Reserved
Page | 411
Godara et al., International Journals of Advanced Research in Computer Science and Software Engineering ISSN: 2277-128X (Volume-7, Issue-6) REFERENCES [1] Singh R.V., Bhatia M.P.S.,“ Data Clustering with Modified K-means Algorithm”, International Conference on Recent Trends in Information Technology, ICRTIT ,IEEE,2011, pp 717-721. [2] Santhi P., Bhaskaran V.M.; “Performance of Clustering Algorithms in Healthcare Database”, International Journal for Advances in Computer Science, March 2010, Volume 2, Issue 1, pp 26-31. [3] Zhao Y., Karypis G., “Evaluation of hierarchical clustering algorithms for document datasets”, the eleventh international conference on Information and knowledge management,2002,pp 515-524. [4] Kumar V., Rathee N., “Knowledge Discovery from Database using an Integration of clustering and Classification”, IJACSA, 2011,Vol 2, No.3,PP. 29-33. [5] Wang J., Su X.; “An improved K-means Clustering Algorithm”, Communication Software and Networks (ICCSN), 2011 IEEE 3rd International Conference, 2011. [6] Madhulatha T. S., “An Overview on Clustering Methods”, IOSR Journal of Engineering, Apr. 2012, Vol. 2(4) pp: 719-725 [7] Fan J., Ji M., Li T., Li Z. “Research On Visualized Data Quality Control Methods Of Ground Object Spectrum In Yanzhou Mining Area”, The International Archives of the Photogrammetry, Remote Sensing and Spatial Information Sciences, Vol. 38, Part II,pp: 212-217 [8] Shah G.H., Bhensdadia C.K., Ganatra A.P., “An Empirical Evaluation of Density-Based Clustering Techniques”, International Journal of Soft Computing and Engineering (IJSCE), March 2012, Volume-2, Issue1,pp: 216-223 [9] Rammimmagadda S., Kanka P.,Yaramala V.B., “Implementation of Clustering Through Machine Learning Tool”, IJCSI International Journal of Computer Science Issues, Vol. 8, Issue 1, January 2011,pp: 395-401 [10] S. Godara and R. Singh, "Evaluation of Predictive Machine Learning Techniques as Expert Systems in Medical Diagnosis", Indian Journal of Science and Technology, vol. 910, 2016. [11] Sunila Godara, Rishipal Singh and Sanjeev Kumar, "A Novel Weighted Class based Clustering for Medical Diagnostic Interface," Indian Journal of Science and Technology Vol 9, Issue 44, Nov.2016. [12] Sunila Godara,, and Ritu Yadav, "Performance analysis of clustering algorithms for character recognition using Weka tool," International Journal of Advanced Computer and Mathematical Sciences Vol 4,Issue 1 , pp.11923,2013. [13] Sunila Godara, Amita Verma, “Analysis of Various Clustering Algorithms”, International Journal of Innovative Technology and Exploring Engineering (IJITEE), Vol. 3, Issue-1, pp.186-9,June 2013
© www.ijarcsse.com, All Rights Reserved
Page | 412