J Musculoskelet Neuronal Interact 2005; 5(4):379-387
Original Article
Hylonome
Proprioception, gait kinematics, and rate of loading during walking: Are they related? J.L. Riskowski1, A.E. Mikesky2,3, R.E. Bahamonde3, T.V. Alvey III2,3, D.B. Burr1,2 1
Department of Biomedical Engineering, Purdue University, Lafaytte, IN, 2Department of Anatomy and Cell Biology, Indiana University School of Medicine, Indianapolis, IN, 3School of Physical Education and Tourism Management, Indiana University-Purdue University at Indianapolis, Indianapolis, IN, USA
Abstract The cyclic nature of walking can lead to repetitive stress and associated complications due to the rate of loading (ROL) experienced by the body at the initial contact of the foot with the ground. An individual’s gait kinematics at initial contact have been suggested to give rise to the ROL, and a repetitive, high ROL may lead to several disorders, including osteoarthritis. Additionally, proprioception, the feedback signaling of limb position and movement, may play a role in how the foot strikes the ground and thus, the ROL. Our goal was to explore the relationship between proprioception, gait kinematics and ROL. Thirty-eight women were recruited for gait analysis, and the gait characteristics 50ms prior to and at initial contact were examined. Two proprioception tests, joint angle reproduction and threshold to detect passive motion were used to examine the subject’s proprioceptive acuity. Our results indicate that individuals with a larger knee angle (i.e., greater extension) 50ms prior to initial contact (IC) experience a higher ROL during gait and have poorer proprioceptive scores. However, it remains unclear whether poor proprioception causes a high ROL or if a high ROL damages the mechanoreceptors involved in proprioception, but the apparent relationship is significant and warrants further investigation. Keywords: Heelstrike, Ground Reaction Force, Knee, Women, Osteoarthritis
Introduction A common activity of daily living is walking, and after the first few years of life, the actions involved in walking are performed with little conscious thought. However, the cyclic nature of walking can impart repetitive stresses on the body, particularly at initial contact (IC), previously referred to as heelstrike1,2. As the leg transitions from the swing phase to the supported stance phase at IC, peak ground reaction forces of 0.5 to 1.25 times body weight can be exerted on the body3. In the 50ms following IC, a ‘shock-wave’ traverses the body with the exchange of energy and momentum from the
Dr. Burr is a consultant for Eli Lilly, Amgen, Procter & Gamble and stock ownership in Eli Lilly; all other authors have no conflict of interest. Corresponding ·uthor: Jody L. Riskowski, c/o Dr. Alan E. Mikesky, School of Physical Education and Tourism Management, Indiana University-Purdue University Indianapolis, 901 W. New York St., Indianapolis, IN 46202, USA E-mail:
[email protected] Accepted 15 August 2005
foot contacting the ground4. As the shock-wave is dissipated through the body, it is thought to cause prosthetic joint loosening, stress fractures, tendonitis, headaches, and joint degenerative diseases, such as osteoarthritis5. Fortunately, the body has several intrinsic structures to help protect it from IC and to attenuate the subsequent shock-wave. These structures include articular cartilage, menisci, and intervertebral discs and are commonly referred to as shock absorbers3. However, by themselves, the shock absorbers cannot withstand the forces of walking, and with repetitive, high forces, they can experience fatigue failure5-7. Moreover, it has been theorized that the limb movements prior to or at IC can affect the ground reaction force and the rate of loading (ROL)8. Some individuals slow down or stop the foot prior to contact, while others seem to allow the ground to stop the foot9,10. In addition to the downward velocity or acceleration of the foot, the angle at the knee joint has been suggested to be a factor in the ROL11,12. This implies limb positioning can serve as a determinant in an individual’s ROL. Another mechanism the body may use to lower the ROL and reduce the energy of the ensuing shock-wave is through 379
J.L. Riskowski et al.: Proprioception and gait Typical Ground Reaction Force
Subject Composition and Comparison Overall Subject Composition
20-29 162.6 60.5 22.8
23.5 (2.6) 162.9 (4.3) 60.8 (10.0) 22.7 (2.5)
BW
Force
Age (years) Height (cm) Weight (kg) BMI (kg/m2)
U.S.A. Median
A
Table 1. Composition of the thirty-eight subjects compared against the USA median value, reported as mean (SEM) for our values23. B
appropriate limb actions and joint positioning. Proper positioning of the knee prior to IC and eccentric contraction of the thigh muscles at IC help to disperse the load and decrease stress on the joint3. Both of these mechanisms require an intact neuromuscular system for controll3,12. The neuromuscular mechanisms theorized to help prevent damage at IC are the short latency stretch reflex, in which the body reacts after IC to lower the ROL, and anticipatory movements prior to IC to prepare the body. The short latency reflex is induced by the muscle spindle Ia fibers and Golgi Tendon Organ Ib afferents during loading at IC13. However, the timing constraint of the stretch reflex poses a problem in controlling the ROL. In walking, the ROL and resulting shock-wave last approximately 50ms, but the short latency stretch reflex activation takes between 34-42ms14. By the time the body has an opportunity to react to the step via the short latency stretch reflex activity, the shock-wave would have passed the powerful leg muscles that could provide a strong attenuating force15,16. The second mechanism of anticipatory movements is contingent on the feedback information of proprioception, defined by Sherrington17 as the body’s awareness to position and movement in space. The feedback information comes from the afferent signals of the mechanoreceptors of the muscle spindles, Golgi Tendon Organs, Pacinian corpuscles, and Ruffini’s endings that respond to limb position and motion18. During the swing phase, the body receives feedback from the mechanoreceptors concerning the movement, and with the anticipation mechanism, the body would use this information to maintain a controlled movement with feedforward signaling in the subsequent actions19-21. Furthermore, it has been reported that if the inertial or initial conditions of the limbs are not considered, the body reacts incorrectly22, and in gait, if the body is not aware of the movements or positions of the limb segments, it may not be able to effectively prepare for the impact and loading at IC. Therefore, we hypothesize that an individual’s proprioceptive acuity, as determined by the threshold to detect passive motion (TDPM) and joint angle reproduction (JAR) tests, may be related to the knee joint position and leg movements prior to IC, which ultimately may relate to the ROL 380
200
400
600
Time (ms)
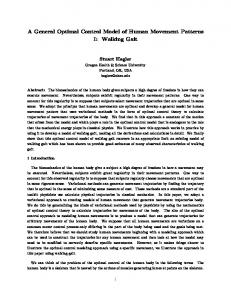
Figure 1. Vertical ground reaction curve demonstrating the heelstrike transient. Point A represents the local maximum force generated within the 50ms after contact. The A/B ratio can be used to classify individuals as heelstrikers or non-heelstrikers. The dashed line represents the portion of the curve used to determine the rate of loading (ROL), and it is normalized by body weight (BW).
experienced. To the authors’ knowledge there is no research explicitly exploring the relationship between an individual’s proprioception with regard to the gait kinematics and ROL. Thus, the purpose of the study was to investigate if gait kinematics during the swing to stance phase transition influence the ROL experienced and to determine if a relationship exists between these actions and proprioception.
Materials and methods A total of thirty-eight healthy young women, ages 18 to 29 [average (SEM): 23.5 (2.60)], were recruited from a previous study cohort of women, the community and the university campus. All were informed of their rights as study participants and signed informed consents approved by the University’s Institutional Review Board. Exclusion criteria included the inability to follow instructions, unstable heart conditions, joint replacements in either of the lower extremities, arthritis, diabetes, vestibular deficits or any type of neuromuscular problems that could prevent subjects from meeting the project requirements of a healthy individual. Subjects were informed they would undergo a series of anthropometric measurements, and proprioception tests, in addition to the gait analysis. Table 1 shows the age and physical characteristics of the subjects, reflecting that they are a representative U.S. sub-population.
J.L. Riskowski et al.: Proprioception and gait
Overall Group (N = 38) Characteristics Knee angle 50ms before IC (Æ) Knee angle at IC (Æ) Ankle vertical velocity 50ms before IC (m/s) Ankle vertical acceleration 50ms before IC (m/s2) Ankle vertical acceleration at IC (m/s2) 70Æ TDPM average (Æ) Total TDPM average (Æ)
176.1 (0.87) 177.1 (0.64) 0.25 (0.017)
Relative error JAR average (Æ) Absolute error JAR average (Æ) Free Speed (m/s)
2.20 (0.53) 3.52 (0.35) 1.31 (0.031)
-1.43 (0.59)
Free Speed ROL (BW/s)
30.2 (3.0)
-6.12 (0.61) 2.22 (0.19) 2.32 (0.21)
Free Speed A/B Ratio Fixed Speed (m/s) Fixed Speed ROL (BW/s)
1.17 (0.042) 1.21 (0.026) 32.7 (2.6)
Table 2. Average gait characteristics of all the subjects (N=38). All values reported as mean (SEM (SD)). IC = initial contact; JAR = joint angle reproduction; ROL = rate of loading; TDPM = threshold to detect passive motion.
Proprioceptive testing Two commonly reported proprioceptive measurement tests of the knee were used to examine the subject’s proprioception: threshold to detect passive motion (TDPM) for joint kinesthesia and joint angle reproduction (JAR) for joint position sense24. Our TDPM test was based on the protocol set by Thompson et al.25. The subject’s right leg was tested using two starting positions: 45Æ and 70Æ of extension from vertical. Twenty TDPM tests were performed at a speed of 0.4Æ/s, ten at each starting angle, and within each of the ten tests, five were flexion and five were extension movements of the knee joint. Prior to testing the first subject, the order of the flexion and extension movements as well as the starting angle was randomized to prevent learning effects or guessing, and the same order was used for all subjects. In our lab, we had a test-retest repeatability value of 0.87 to 0.94 for the TDPM test25. Averages were computed at each angle and between the flexion and extension results, and a total average was found using all twenty trials. For the JAR test, we followed work by Baker et al.26. The subject’s right leg was tested at target angles of 45Æ and 70Æ extension from vertical. The difference between the target and actual angles to the nearest ±0.5 degrees was determined with a Leighton flexometer (Leighton Flexometer, Inc., Spokane, WA, USA). The angles were recorded as absolute error the number of degrees off the target angle, and as relative error using positive degrees off target to represent overshoot and negative degrees to indicate angles and undershoot. Five trials at each target angle were tested for a total of ten trials. Prior to testing, the trial target angles were randomized by interchanging the order of target angles to prevent learning effects, and the same predetermined order was used for all the subjects. In the JAR test, the test-retest reliability was 0.84-0.87 for our laboratory25. Gait analysis A six-component, 1000-Hz AMTI force plate (Advanced Mechanical Technology Inc., Newton, MA, USA) was used
to collect the ground reaction force. Subjects were barefoot and instructed to walk normally. To eliminate targeting of the platform, subjects wore special goggles to reduce peripheral vision. Ten successful walking trials were performed per subject, with a successful trial having the entire right foot land on the force plate. The first five of the measured trials were at a "natural pace," similar to a pace the subject would use to cross a street. To eliminate the velocity-dependent effects, the last five trials were performed at a speed of 1.22 ±5% m/s (i.e., between 1.17 and 1.29 m/s), as it is a common speed for most individuals1. The walking speed was monitored via two telemetric photo cells (Brower Infrared Timing System, Salt Lake City, UT, USA) placed three meters apart adjacent to the walkway, and subjects were informed of their speed after each trial, which allowed them to make speed adjustments on the subsequent trial. Each subject had to perform five trials within the given speed range, and trials in which the subject did not walk within the range were not used for the analysis. Gait kinematic data was recorded with a 60-fps video camera (Panosonic Model AG-450, Matsushita Electric Industrial Co, Ltd, Okayana, Japan) positioned to the right of the subject. Reflective markers were attached to the subject’s right leg at the greater trochanter, center of the lateral knee joint line, lateral malleolus, heel and fifth metatarsal phalangeal joint. The position data of the markers were digitized using the PEAK5 Motion Analysis System (Peak Performance Technologies, Englewood, CO, USA). A MATLAB (The MathWorks Incorporated, Natick, Massachusetts, USA) program was created to calculate various gait kinematics. The program calculated the following knee and ankle kinematic variables: joint angles, joint velocities, joint accelerations, radial velocities, and radial acceleration at 50ms prior to initial contact (IC) and at IC. We chose to calculate the above variables at 50ms prior to IC because that approximates a typical neuromuscular response time, and it also corresponds to a difference of 3 video frames prior to the IC video frame. 381
J.L. Riskowski et al.: Proprioception and gait
Intragroup Comparisons ExKA ≤-1 S.D. Knee angle 50ms before IC (Æ) Knee angle at IC (Æ) Ankle vertical acceleration at IC (m/s2) 70Æ TDPM Ave (Æ) Total TDPM Ave (Æ) Relative error JAR Ave (Æ) Absolute error JAR Ave (Æ) ROL (BW/s) A/B Ratio Composition (non-heelstrikers / heelstrikers)
167.8 (1.8)**## 174.0 (1.0) -3.5 (0.90) 1.55 (0.07)*# 1.58 (0.10)*# 0.34 (0.80)**# 2.22 (0.22)*# 24.0 (3.1)* 1.18 (0.044)* 4/2
ExVA ≥+1 S.D.
≤-1 S.D.
ExROL ≥+1 S.D.
183.8 (1.3)***## 180.9 (1.7)* 173.5 (1.2)** 177.1 (1.9) 181.3 (0.29) 177.0 (1.7) -5.4 (2.0) -12.3 (1.4)**## -1.56 (1.4)**## 3.05 (0.42)*# 3.41 (0.60)*# 3.61 (1.2)**# 4.48 (0.68)**# 47.7 (1.9)*# 1.28 (0.056)* 0/6
2.58* (0.82) 2.60 (0.81) 1.97(1.7) 3.96 (0.80) 38.9 (2.5)* 1.29 (0.10) 2/4
1.55 (0.11)*# 1.68 (0.16)# 1.18 (1.8) 3.53 (0.95) 27.1 (2.4)* 1.21 (0.032) 4/2
≤-1 S.D.
≥ +1 S.D.
172.0 (1.0)*# 175.1 (1.1)* -5.21 (0.34)
179.5 (2.2)* 181.1 (0.75)* -6.30 (1.2)
1.67 (0.13)*# 3.50 (0.18)*# 1.76 (0.080)*# 3.41 (0.48)* 1.12 (0.8)*# 4.68 (2.3)*# 3.31 (1.2) 5.51 (1.0) 15.1 (1.3)**# 54.5 (2.1)**## 1.03 (0.012)*# 1.33 (0.09)*# 6/0 1/5
* 0.05 ≥ p value > 0.001 between extremes in group; ** p value ≤ 0.001 between extremes in group; # 0.05 ≥ p value > 0.001 between total and extreme group; ## p value ≤ 0.001 between total and extreme group. Table 3. Gait characteristics and proprioceptive measurement scores of individuals in the extreme groups. All values are reported at free speed and as mean (SEM). ExKA = extreme knee angle group; ExROL = extreme rate of loading group; ExVA = extreme ankle vertical acceleration group; IC = initial contact; JAR = joint angle reproduction; ROL = rate of loading; TDPM = threshold to detect passive motion.
Rate of loading (ROL) and heelstrike classification The rate of loading (ROL) was calculated from the vertical ground reaction force curve (Figure 1) as the slope from point of IC to the initial peak, point A, which represents the local maximum force generated within the 50ms after contact. The ROL was normalized based on body weight (BW) to allow for comparisons between individuals regardless of weight. The vertical ground reaction forces were also used to classify certain individuals as heelstrikers if they had the ratio of A/B≥1.2, where point B is the subsequent local minimum force after A27. In our study, 16 of the 38 subjects were considered heelstrikers. Statistical analysis Initially, we found the mean and standard deviation for the gait kinematic variables for the overall group (N=38). Using the overall group data, we generated a correlation matrix using Sigma Stat 2.0 (SPSS, Chicago, IL, USA), and as the research was exploratory in nature, we used forward stepwise regressions to determine which gait variables most related to ROL and proprioception28. The flow chart in Figure 2 illustrates the analysis method. Gait kinematic variables identified from the forward stepwise analysis were used to establish extreme groups. To form the extreme groups, the subjects were rank ordered according to the specific parameter of interest (i.e., knee angle 50ms prior to IC, ankle acceleration 50ms prior to IC, or 382
ROL). For each parameter the top and bottom six individuals in the ranking comprised the extreme groups, for a total of twelve individuals per group. Additionally, a group of individuals with an extreme rate of loading was created in the same manner as the kinematic groups. The locomotor extremes are often used to study animal locomotion because they provide clearer examples of structure-function relationships29. When differences in performance are exaggerated, the relationships, if any, can be made more evident. We also performed intragroup cross-sectional student’s t-tests to compare gait kinematics, proprioception test scores, and ROL between the locomotor extremes. The significance level was p