tone and non-tone languages in pitch change over the duration of the sentence and the word .... files of the same type were available for testing in nine of the languages. 2.2. .... decay 8 + average pitch slope; English vs. Mandarin differ in tone ...
PROSODIC FEATURES IN AUTOMATIC LANGUAGE IDENTIFICATION REFLECT LANGUAGE TYPOLOGY Ann Thymé-Gobbel and Sandra E. Hutchins Natural Speech Technologies ABSTRACT Results from a prosody-based automatic language discrimination (LID) system suggest that the difficulties reported by other sites in incorporating prosodic information into LID systems may have been caused by their not using appropriate task-specific features. Running averages and correlations of prosodic features capturing syllable pitch and amplitude contours, duration and phrase location were evaluated by deriving a LLR function for each feature and language pair, then evaluating the effectiveness of that function as a discriminator. Data consists of speech in 11 languages (OGI database) representing a cross-section of traditional typological categories and relationships. Results show that prosody is highly useful in LID if complex perceptual events are broken down into simpler physical events and features are chosen based on task. Prosodic features can distinguish between language pairs as predicted by language typologies, suggesting that new languages can be classified using existing models of similar languages. 1. INTRODUCTION 1.1. Other LID studies Past approaches to automatically identifying the language spoken in a conversational context have used broad phonetic features, detailed acoustic features, raw waveforms, pitch contours, vocabulary, etc. [4, 8]. The utility of prosodic cues like stress and rhythm realized as a function of three acoustic parameters (pitch, amplitude, duration) was unclear and therefore was typically not pursued in most studies. A few earlier attempts to use prosodic features found them only marginally successful: speech rate and syllable timing offered small improvements [5]; some differences were found between tone and non-tone languages in pitch change over the duration of the sentence and the word [6]. We would argue that prosodic features can be useful only if the appropriate features are used and that the lack of successful uses of such features in the earlier studies can be traced to not relying on task-appropriate features. It is not enough to derive a large set of general prosodic features because much more than language identity is encoded in the prosodic information. Suprasegmental features also encode discourse structure, emotion, native language and dialect, stylistics (e.g. read, spontaneous, lecture), utterance purpose (e.g. threaten, inform, persuade, flatter), speaker identity, etc. Since each aspect is encoded by a complex set of overlapping features, it is better to derive a smaller set that is maximally reliable for the task. A recent pairwise language discrimination study using only two prosodic features – F0 and amplitude envelope modulation – to discriminate between five languages with a recurrent neural network has produced some of the most encouraging results for prosodic LID to date [1]. The network was able to find generalizations in the temporal patterns of the
page 29
data; error distributions reflected traditional rhythm-related language classes. Our earlier work on pairwise discrimination between English, Spanish, Japanese and Mandarin used a much larger set of prosodic features than [1] and showed that those features can be very successful in LID [7]. We showed that the strengths of particular prosodic features and classes of features—primarily pitch, secondarily duration and location—reflect differences between the languages as predictable from prosodic classifications. 1.2. Prosodic language categories The results from [1] and [7] suggest that a familiarity with the variation found in prosody and an understanding of the relationships between physical measurements and perceived events help in effectively identifying appropriate features, particularly if training data is limited, and predicting the discrimination success of specific language pairs. Most indepth cross-linguistic prosodic studies have focused on a small set of languages, on controlled speech, on particular theoretical claims, or are purely descriptive and the standard prosodic classification recognizes categories of pitch use (pitch-accent, tonal, non-tonal languages) and rhythm (syllable-timing, stresstiming, mora-timing). Pitch-related language categories differ with respect to amount of overall pitch variation, location of pitch change within a phrase, presence/absence of specific pitch contour types, pitch contours at different locations within a phrase, correlations between pitch and amplitude or duration features, and so on. Rhythm is crucial in parsing and intelligibility; however, there seems to be no simple measure of rhythm. Isochronous stresses or syllables are perceived and may be measurable in read speech or poetry reciting but are apparently not usually physically present in unplanned speech other than as tendencies. A solution is to break complex perceptual phenomena into simpler easy-to-measure interacting properties. A study comparing five languages differing in timing and tone concluded: “The difference between stress-timed and syllabletimed languages has to do with differences in syllable structure, vowel reduction, and the phonetic realization of stress and its influence on the linguistic system.” [2] The suggested existence of preferred tempos in the 1.4-2.0 Hz range [3] may also interact with syllable structure, vowel reduction and pitch use to explain a language's choice between salience of distance between syllables or stressed syllables. This suggests that by measuring simpler features such as distance between syllable onsets, between syllable nuclei, and between prominent stresses we should be able to identify differences between rhythmically different languages. In general, we expect languages that are more similar in pitch use and/or timing-related structure to be more difficult to differentiate automatically.
ICPhS99
San Francisco
2. METHODS 2.1. Data We used data from the Oregon Graduate Institute MultiLanguage Telephone Speech Corpus [5], a set of responses to prompts by native speakers of one of eleven languages: English, Farsi, French, German, Hindi, Japanese, Korean, Mandarin, Spanish, Tamil, and Vietnamese. These languages provide a good cross-section of language types, representing stress-timed, syllable-timed, mora-timed and phrase-timed languages, tone languages and pitch-contour languages, differing amounts of diachronic relationship, and variation in syllable structure, with stress-timed languages having more complex syllable structure than syllable-stressed languages, which in turn tend to have more complex syllable structure than tone languages. In this study, we used only the 50-second unrestricted open-topic monologue segments typically involving descriptions of vacations, place of residence, or occupation. We divided that data into two batches: TR (the original OGI training data; 50 files/language) and DF (the OGI devtest and final data; 40 files/language). An additional 20 files of the same type were available for testing in nine of the languages. 2.2. Model Architecture Our prosody-based LID system differs from most other LID systems in that no manual tagging of training data is necessary. The system consists of an acoustic front end which extracts pitch and amplitude information as a function of time, a prosodic analysis unit which performs syllable segmentation (where a syllable is simply a segment with smooth pitch, low frication, and rising+falling amplitude) and extracts pitch and amplitude contour information on a syllable-by-syllable basis, a statistical module which computes inter-syllable timing-related relationships in the pitch and amplitude information, a training module which collects histograms of features, and a discrimination module which computes log likelihood ratio (LLR) functions from the histograms and uses the LLR functions to evaluate unknown input in pairwise discrimination. In calculating the LLR of a feature or feature pair on a pair of data sets, we use the LLR to identify regions in which the two data sets (Language A and Language B) have differing distributions. If the distribution (or joint distribution) for a feature (feature pair) is given by p(x) then the LLR(x) is given by equation (1):
feature. Originally only a small subset of features or feature pairs appropriate for the task was used in the training and discrimination modules—our modified system automatically derives large sets of features. Features can be divided into eight descriptive classes: Pitch Contour (slope and shape of pitch contour on a syllable); Differential Pitch (inter-syllabic pitch differences); Size (syllable duration, distance between syllable onsets); Differential Size (differenced log syllable distance and log syllable duration); Amplitude (slope and shape of amplitude contour on a syllable); Differential Amplitude (inter-syllabic amplitude differences); Rhythm (low frequency FFT of amplitude envelope; syllables per second in a breath group); Phrase Location (estimated location in breath group based on syllable distance ratios and silence). Within each class are running averages, deltas (difference of current value and running average), and standard deviations. In evaluating features for a language pair, we looked at the minimum and average over four cross-validation runs of the percent-correct and a figure of merit (FOM) derived on a speaker-by-speaker basis. Given the TR and DF data for two languages, A and B, the cross-runs involve the four possible assignments of train and run sets to the two languages in which the run data does not equal the train data. The FOM of a feature x for a pairwise discrimination of a set of speakers drawn from two languages A and B is the difference in the means of the LLR for x given each language divided by the sum of the standard deviations of the LLR for x given each language, as shown in equation (2): (2) (E(LLR(x | A)) - E(LLR(x | B)) ) / (StD(LLR(x | A)) + StD(LLR(x | B)) ) Evaluating features according to the minimum in crossvalidation runs allows us to eliminate features that are unreliable for LID due to influence by stylistics or emotion. 3. RESULTS 3.1. Experiment 1: Best single feature Using cross-runs, we isolated the single best feature or featurepair for each pair of languages, "best" being defined as the feature with the highest minimum percent correct (min%) across the 4 runs. This is a simple way to avoid unstable features. It also gives a baseline that should be close to a lowest expected result on similar test data. Results are shown in Table 1.
(1) log( p(x | Language A) / p(x| Language B) ) The distributions (p(x)) are approximated by gathering histograms on the training data. The histograms are subjected to smoothing and backfill before being normalized for the LLR calculation. If the feature is a single feature, x enumerates the bins in its histogram. If the feature involves a joint distribution of two features, x enumerates the bins in the joint (two dimensional) histogram. Based on our own research and research reported in the linguistic and phonetic literature, we implemented a large set of possible prosodic feature measurements designed to capture pitch and amplitude contours on a syllable-by-syllable basis that would be potentially useful for LID but could also be used for other tasks including emotion and stylistics detection. The statistical module measures 224 individual features that can be used individually or in pairwise combination with any other
page 30
en ge fr sp fa hi ta ja ko m vi en 62 70 71 80 74 72 73 77 83 73 ge 70 72 82 75 79 79 81 89 72 fr 62 79 74 65 81 73 87 79 sp 69 66 69 77 68 86 75 fa 63 73 84 72 89 80 hi 61 76 72 84 80 ta 75 69 88 79 ja 73 78 85 ko 81 78 m 78 vi Table 1. Percent correct pairwise LID best single feature
ICPhS99
San Francisco
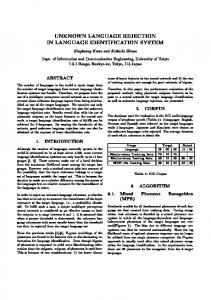
The results reflect prosodic similarities between languages through lower percent correct for more similar languages and higher percent correct for less similar languages. Plotting percent correct against FOM, Figure 1 illustrates how language pairs tend to separate into groups corresponding to traditional linguistic rhythm-related categories based on degree of prosodic similarity. The best feature is also representative of the area of greatest dissimilarity between the languages, e.g. English vs. Spanish differ in timing and syllable structure: the best feature pair is the delta log distance between syllables at decay 8 + average pitch slope; English vs. Mandarin differ in tone, timing and syllable structure: the best feature pair is the delta log distance between syllables + pitch change over the first half of the syllable; Japanese vs. Spanish differ in pitch use more than in timing: best feature pair is the pitch change over the last half of the syllable + the difference between start and end pitch for the syllable. 1.3 1.1
.90
The results show that for almost all language pairs the results are better with task-specific features. In some cases the improvement is large, e.g. English vs. French (+22%). Only for one pair, English vs. German, does the generic set clearly outperform the task-specific set (-16%). Since English and German are prosodically similar in both syllable structure and timing, it is not surprising that the percent correct is low and the higher score for the generic set may be a fluke for this particular dataset. Again, the features that perform best reflect the prosodic differences between the languages: detection of tone languages involves pitch contour and pitch slope features and syllable distance features against stress-timed languages; detection of stress-timed languages involves rhythm features, pitch, syllable distance and syllable size to varying degrees depending of the type of the other language in the pair; detection of syllable-timed languages involves pitch and rhythm depending on the other language. A comparison of cross-runs of feature sets vs. a single feature in 8 pairs of English vs. other languages showed a good alignment, suggesting that the min% of the single best feature is a lower bound to feature set performance. Only English vs. Hindi disappoints by being 5% lower as a set than the single best. A comparison of the min% from cross-runs of the single best feature to the final percent correct in the test data in the same 8 pairs of English vs. Other_language showed that 4 of the 8 final pairs scores are close to the min% and 4 final scores give higher results, suggesting that the best min% is a fair lower bound to performance.
.70
.50
.30
60
65
70
75
80
85 %corr
tone/tone stress-/syllable-timed stress-/stress-timed tone/syllable-timed tone/stress-timed syllable-/syllable-timed Figure 1. Percent-correct and FOM for pairwise LID by type 3.2. Experiment 2: Generic vs. task-specific feature sets The purpose of the second experiment was two-fold: to verify expectations that (1) a single set of features manually chosen from the best performers among a representative subset of languages does not yield results as good as task-specific features, and (2) a set of features is stronger and more robust than a single feature since sufficient difference between data sets means we cannot predict which feature will perform best on a new data set. The "generic" set consisted of 15 features found to be among the best for the pairs English/Spanish/Japanese/Mandarin. The task-specific set was chosen by cross-runs on the 90 original files and pared down to a set of 5-15 features through a heuristic involving minimum FOM and range of FOM as well as the min% from cross-runs. Discrimination was performed with a set of 20 reserved similar files from a representative subset of languages. Results are shown in Table 2.
page 31
language generic task-spec. change pair %corr %corr in % EN/GE 73 61 –12 EN/FR 53 75 +22 EN/SP 77 85 + 8 EN/TA 68 85 +17 EN/JA 93 90 – 3 EN/MA 77 85 + 8 EN/VI 55 70 +15 JA/MA 72 75 + 3 JA/SP 93 95 + 2 MA/SP 89 95 + 6 Table 2. Percent-correct for generic and task-specific features 4. DISCUSSION Results from both experiments suggest that the prosodic similarity between languages is reflected both in the percent correct with similar (by family relationship or synchronic category) languages scoring lower and in what features contribute most to the score. Complex timing structures can be broken down into combinations of simpler features involving segment duration and pitch. Tone languages have strong pitch contour features, stress- and syllable-timed languages are differentiated through features involving rhythm and segment/gap duration reflecting differences in syllable structure, etc. The fact that the strongest features match linguistic expectations suggests that our prosodic system captures the appropriate relationships between languages of all types, allowing a categorization by type. New languages on which no training has been performed are expected to behave in discrimination similarly to the prosodically most similar trained language. The results further showed that to use
ICPhS99
San Francisco
prosodic features successfully it is crucial to identify which features are encoding what aspect of speech so that only taskappropriate features are used—cross-validation runs and a figure of merit were found to be simple but useful tools in identifying those features. We are currently working with an automatic feature selection process that lets us select useful features from a much larger set than we had been using for the manual and semi-automatic evaluations discussed in this paper. Through this selection process, we are modifying the heuristic feature ordering process to favor a greater variety of feature classes by preferring feature pairs that introduce new features and feature classes. Previous analyses indicated that a variety of features and feature classes led to better overall results and early results show a slight (< 5%) increase in performance over representative language pairs. We suspect that the reason that many earlier systems did not find prosodic features useful is that they did not attempt to differentiate between the large number of different possible features to use only those that are appropriate for LID. Since prosodic variation within a language can be larger than across languages due to emotional or stylistic variation, some technique for choosing features is crucial to the success of the system. In general, then, computationally efficient prosodic measures can provide a semi-independent noise resistant source of information for LID without any need for costly handtagging of training data. Our system could provide a very quick categorization of unknown language data. For best LID results, prosodic measures should be combined with other information, such as segmental distribution or word recognition. For discrimination in a multi-language context where the number and identity of the present languages are unknown, a good use of our fast prosody-based LID system can be to do an initial decision and a paring down of possible languages. Based on the prosodic categorization, an appropriately limited set of segment-based language models can be applied for the final LID decision. REFERENCES [1] Cummins, F., Gers, F., and Schmidhuber, J. 1999. Automatic discrimination among languages based on prosody alone. IDSIA Technical Report IDSIA-03-99, Lugano, Switzerland. [2] Dauer, R. 1983. Stress-timing and syllable-timing re-analyzed. Journal of Phonetics, 11, 51-62. [3] Fraisse, P. 1982. Rhythm and Tempo. In Deutsch, D. (ed.) The Psychology of Music. Academic Press Inc. [4] Muthusamy, Y.K., Barnard, E., and Cole, R.A. 1994. Reviewing automatic language identification. IEEE Signal Processing Mag. 11 (4), 33-41. [5] Muthusamy, Y.K. 1993. Segmental approach to automatic language identification. Ph.D. thesis. Oregon Graduate Institute of Science & Technology. [6] Savic, M., Acosta, E., and Gupta, S. An automatic language identification system. 1991. In Proceedings IEEE International Conference on Acoustics, Speech and Signal Processing 91, Toronto. [7] Thymé-Gobbel, A. and Hutchins, S.E. 1996. On using prosodic cues in automatic language identification. In Proceedings of the 1996 International Conference on Spoken Language Processing . 3, 17681771. [8] Zissman, M. Comparison of Four Approaches to Automatic Language Identification of Telephone Speech. 1996. I E E E Transactions on Speech and Audio Processing. 4 (1) 31-44.
page 32
ICPhS99
San Francisco