of the FTIR spectroscopy to investigate both protein structure and function .... consequence IR spectroscopy is a specific technique to study protein ... NMR, and the analysis of vibrational spectra remains an extremely complex to ..... native and non-native structures during the folding reaction being an ... Data shows that the.
Vol. 109 (2006)
ACTA PHYSICA POLONICA A
No. 3
Proceedings of the XL Zakopane School of Physics, Zakopane 2005
Protein Structure and Function in the Time-Domain of Vibrational Spectroscopies. The Promising Applications of IR Synchrotron Radiation Micro-Spectroscopy A. Marcelli INFN, Laboratori Nazionali di Frascati, P.O. Box 13, 00044 Frascati, Italy Fourier Transform Infrared (FTIR) spectroscopy is a fundamental technique capable to characterize proteins and to investigate their conformation and dynamics in real physiological environments. Actually, a FTIR spectrum is characterized by many features, which may be correlated to the different components of the protein structure. In the last decade many relevant results have been achieved with this technique in terms of chemical imaging of proteins at subcellular level and in the investigation of cooperative phenomena. This contribution presents a few examples that illustrate the capability of the FTIR spectroscopy to investigate both protein structure and function and the opportunities offered by IR synchrotron radiation sources. Indeed the high source brilliance of these sources enables FTIR micro-spectroscopy to be performed with spatial and time resolution not available with standard sources. Moreover, the combination of synchrotron radiation and new two-dimensional detectors open new opportunities to investigate in the IR energy domain different protein processes in real time and with proteins in their native environments. PACS numbers: 87.14.Ee, 87.15.Cc, 07.57.Ty, 07.85.Qe, 78.30.–j
1. Introduction The development of theoretical and experimental techniques capable to visualize a three-dimensional (3D) model of a protein is certainly one of the main revolutions of the last decades. Scientists have now tools capable to understand subtle details of the structure of these biological systems and many new possibilities to predict the results of an experiment or design ad hoc experiments to investigate the relation between the structure of a protein and its function. Nowadays the most important and accurate method for detailed protein structure analysis (287)
288
A. Marcelli
is the synchrotron radiation (SR) single crystal X-ray diffraction (XRD) method. Despite the growing number of different protein crystals the bottleneck of protein X-ray diffraction analytical technique mainly depends on the availability of those 3D crystal, a goal that is very hard to achieve for many proteins. For instance, a fraction corresponding to 30% of total proteins is expressed on or is associated with cell membranes in eukariotic cells. These proteins are extremely difficult to isolate and to crystallize although these proteins can be obtained in large amounts by expressing them in bacteria. Moreover, many proteins obtained by DNA recombinant technologies do not exactly fit protein structure because post-translational modifications (e.g. protein glycosilation) cannot occur in procariotes (e.g., Escheria coli) or are not quite the same. The SR sources have been essential for making impressive advances in this field and a work on the voltage-dependent potassium channel based on the structural investigation of a membrane protein has been awarded in 2003 by the Nobel Prize for chemistry [1]. Nuclear magnetic resonance (NMR) spectroscopy is also a well-recognized technique capable of determining the 3D structure of a protein and to investigate time dependent phenomena as protein folding. Both XRD and NMR are capable to return the relative positions of the atoms inside a macromolecule. Actually, XRD provides the atomic coordinates of all non-hydrogen atoms whereas from NMR we determine the positions of all atoms including hydrogen. Therefore, molecular weight and solubility of a protein as well as the availability of its suitable crystals actually limit the choice of the method. However, the precision and the accuracy of these methods are affected by many different parameters. For proteins and proteins complexes with molecular weights above 50–100 kDa or less, XRD is the first choice, as it returns more precise structural information [2]. For molecules hard to crystallize and that which can be maintained in solution at reasonably high concentration NMR is the only alternative. Although XRD and NMR can provide complementary information, NMR can explore the protein dynamics at near atomic resolution since it works with protein in solution and data may be collected in several different conditions applied to the system such as T , pH and salt concentration to closely mimic a given physiological fluid [3]. Considering that XRD and NMR have a resolution of a few tenth of ˚ A, three relevant questions may be addressed introducing the infrared vibrational spectroscopy. The first is connected to the method. FTIR spectroscopy is indeed a very old but reliable technique, applied for the first time to protein investigations in 1952 [4], before any detailed X-ray results on proteins were available. Why IR spectroscopy is still a useful technique to investigate protein, as well as conformation and dynamics? Moreover, crystallographic images are static and NMR allows also the investigation of the dynamics of proteins. Therefore, where is the specific time-domain interest of the infrared vibrational spectroscopy? And finally the question concerning the spatial resolution of IR spectroscopy arises. At 3 ˚ A the folding and unfolding of a polypeptide chain can be detected, and interatomic
Protein Structure and Function . . .
289
˚, while moving to exdistances can be measured down to a resolution of ±0.5 A ˚ periments giving results at 1 A resolution, atoms are well distinguished and their position is measured with a precision of a few hundredths of angstrom. With the most brilliant synchrotron radiation sources and a confocal microscope, a spatial resolution down to the diffraction limit is actually achievable in the mid-IR domain. However, such spatial resolution is three or four orders of magnitude larger than the one available using XRD. How IR spectroscopy can be considered a competitive method to analyze 3D structures of protein? A fundamental axiom of biology is that structure and function are closely related in proteins. However, the understanding of this relationship is more complex in most cases, not only because the function(s) of many proteins is only partially understood and/or still unknown but also because resolving a protein structure does not immediately clarify its molecular mechanism or its biological roles. Moreover, as different structural protein domains can contribute to a unique molecular mechanism, the need is to develop complementary techniques providing information on protein structure–function relationships in biological systems, although characterized by a lower spatial resolution. Proteins are typically characterized by more than 20000 vibrational degrees of freedom, e.g., the normal modes of vibration that may be correlated with internal coordinates such as bond lengths and bond angles [5]. IR light excites many of the molecular vibrational modes, as a consequence IR spectroscopy is a specific technique to study protein conformations and dynamics. Although this is a low resolution technique compared to XRD or NMR, and the analysis of vibrational spectra remains an extremely complex to decipher because of the many overlapping vibrational bands, it remains a useful method also for proteins with a known 3D structure because it can be performed in real physiological environments [5]. In fact, a protein spectrum is characterized by two main features: the Amide I and Amide II bands that arise from specific stretching and bending vibrations of the peptide backbone. It is now well established that the band intensity and the frequency of the Amide I band are sensitive to the protein secondary structure. In the last decade many relevant results have been achieved with the FTIR micro-spectroscopy in terms of chemical imaging of living cells and investigations of cellular processes so that the future of this old spectroscopy is promising as ever [6, 7]. By using SR as the source of IR light the secondary and tertiary structures of a protein can be resolved with unprecedent resolution in space and time. The high source brilliance of SR (defined as the photon flux or power emitted per source area and solid angle) enables FTIR spectroscopy and micro-spectroscopy to be performed within few minutes, with spatial resolution of just a few microns, a size scale appropriate for investigating individual living cells. This represents a considerable advantage considering that cells and tissues are extremely complex structures exhibiting very large differences in composition. However, when considering the available spatial resolution of FTIR, three issues should be taken into
290
A. Marcelli
account. The first one is an acceptable signal-to-noise ratio (S/N), which decreases as apertures are closed to confine the IR beam to small areas. The second issue is the diffraction limit, allowing aperture settings smaller than the wavelength of light that can be used by synchrotron radiation. Thus for proteins (e.g. at the Amide I absorption band wavelength), the diffraction-limited spatial resolution is approximately 6 micron but experiments up to 3 micron of diameter have been already performed. The last issue is the time resolution. Synchrotron radiation has a time structure that ranges from hundreds of ps to ns, e.g., comparable with the time of molecular vibrations and several times faster than conformational changes or protein folding phenomena, so that with new bidimensional detectors the possibility to monitor protein processes in real time and in their native environments seems really possible [8]. 2. Experimental details IR micro-spectroscopy is a unique technique that combines microscopy and spectroscopy for purposes of microanalysis. Although limited in spatial resolution, when compared to the resolution achievable with X-rays, IR is able to resolve chemistry using the contrast method. This technique is a microanalytical and imaging method, which achieves contrast tuning specific intramolecular vibrational modes [9]. The method is the same as used in X-ray microscopy where contrast is achieved recording spectra before and after the absorption edges of an element contained in the specimen with the unique advantage that several different vibrational modes can be considered obtaining many different images and contrast. While in visible light microscopy image contrast is achieved with the use of staining or fluorescent materials, with IR the use of chemical reagents is not necessary. Image contrast is simply produced from intrinsic IR absorption bands. Indeed, FTIR micro-spectroscopy allows spatially resolved local chemical analysis in situ from small portions of the microscopic field. A FTIR spectrometer coupled with a microscope capable of providing excellent spatial resolution was available since early 1980s [10], but the spectrum of a single red blood cell with and without carbon monoxide was reported only in 1988 using a microscope connected to a conventional FTIR spectrometer [11]. Thanks to the unique properties of IRSR such as its high brilliance, the lack of thermal noise, the extreme collimation, the polarisation and the spatial resolution, experiments may be now collected with high S/N ratio at 2–4 cm−1 of resolution in wave number, on a timescale of 10–100 s up to areas of 3 × 3 µm2 [7]. These huge advancements transformed the infrared spectroscopy in a widely used and competitive method to investigate the structure of the large majority of proteins and, in particular, of the secondary structure of a protein. FTIR spectroscopy is fast, yields a strong signal using only a few micrograms of sample amount, and using crystals and polarized radiation it may return information about the orientation of different parts of the molecule under investigation.
Protein Structure and Function . . .
291
In contrast to X-ray and NMR, FTIR does not give a precise 3D spatial information at the atomic scale, but as above mentioned, proteins can be investigated in a wide variety of conditions, e.g., as aqueous or organic solutions, as hydrated films or as inhomogeneous dispersion or as solids. As solids (e.g., after liophylization), proteins can be deposited on a transparent substrate, or pressed into a pellet, and measured in transmission mode, using photoacoustic IR spectroscopy or with attenuated total reflection (ATR) techniques [12]. Moreover, this method is not limited by the size of proteins or by the nature of the environment. FTIR spectroscopy studies the interaction of electromagnetic radiation with a chemical substance. The nature of the interaction depends upon the properties of the substance. When IR radiation passes through a sample (solid, liquid or gas), the whole molecules and their characterizing functional groups absorb certain frequencies of the radiation leading to characteristic molecular or functional group vibrational changes. The frequency distribution of absorbed radiation is unique for each molecule or each functional group thus the characteristic of a substance can be detected. These vibrational modes strongly depend on the physical state of the sample: more close physiological conditions in the sample and more representative the spectral transitions of molecule(s) under investigations, and more complex data interpretation. As a consequence, an FTIR spectrum of a single cell or of a tissue collected in a nearly physiological environment (assuming no interaction with the solvent), and collected with a high S/N, after the subtraction of the aqueous buffer signals will give us the vibrational spectrum of the whole system accounting for different components (e.g., proteins, lipids, nucleic acids, and carbohydrates in a cell). However, information about single component can be achieved because of the peculiar vibration transition mode of chemical groups characterizing each different molecule [13, 14]. As concerns proteins, FTIR spectroscopy may also investigate protein systems that exist in a dynamic equilibrium between varieties of structural forms with short lifetimes. Proteins are polymers composed of 20 different aminoacids joined with each other by a planar peptide bond and different functional chemical groups characterize different side chains in aminoacids. After synthesis, growing linear polypeptides assumes the most thermodynamically appropriate protein folding that in most cases is stabilized by the formation of disulfide bonds between two cysteine residues allowing a globular aspect. At physiological temperatures and in very diluted aqueous solution, denatured proteins can refold into the original folding. Because proteins are complex and flexible, there are many vibrational bands characteristics of peptide groups and side chains that can be used to extract direct information on the structure and the dynamics of these macromolecules [15, 16]. Actually, the infrared spectra of proteins exhibit absorption bands associated with their characteristic amide group, the structural unit common to all molecules of this type. The peptide bond is planar and fairly rigid, due to the partial double
292
A. Marcelli
bond character, and therefore it affects all aspects of protein structure and function. It can form at least two hydrogen bonds and it is present in the majority of cases in trans configuration. These conditions place severe restrictions on the possible conformations of the polypeptide chain. The isolated planar amide group is characterized by 5 in-plane modes and one out-of-plane normal mode due to C–N torsion [17]. The in-plane contributions are due to the different C=O, C–N, and N–H stretching modes and to the O–C–N bending. As a consequence, the characteristic bands of protein chains are composed by nine amide bands called, in order of decreasing wave numbers: Amide A, B, and Amides I–VII. To extract useful structural information from these bands, the first step is the analysis after a deconvolution for the intrinsic band widths, to identify the overlapping band component. Then, the original band is decomposed into the different components using a suitable mathematical procedure or fit. Alternatively, vibrational spectroscopy can be used for the investigation of proteins via the analysis of the ligand-induced changes observed during their functional cycles [18]. More recently, 2D correlation analysis of IR spectra has been also applied to proteins. This is an intriguing idea put forward in the field of NMR spectroscopy about 30 years ago. By spreading spectral peaks over the second dimension, one may simplify the visualization of complex series of spectra consisting of many overlapped peaks. With this method it is possible to obtain the spectral intensity as a function of 2 independent spectral variables. The introduction of the concept of the perturbation-based 2D spectroscopy to optical spectroscopy, such as IR and Raman was proposed first by Noda in 1986 [19]. The 2D IR spectrum consists of much sharper and resolved peaks than the corresponding 1D spectrum. This enhancement of the resolution is a direct consequence of spreading overlapped IR peaks along the second dimension. Moreover, the appearance of positive and negative cross-peaks located at the off-diagonal positions of a 2D spectrum indicates various forms of correlated features among IR bands, e.g., correlations among the same chemical group, or groups strongly interacting. Nevertheless, the major advancements of IRSR are the ones following the coupling of FTIR technique with an optical microscope. Actually, in the last decade IRSR micro-spectroscopy revolutioned and still continues to push forward the state of the art of the vibrational spectroscopy [20]. It has improved the spectral quality and the reproducibility of many different kinds of experiments, including the ones performed on biological systems. FTIR is routinely used to produce images or to detect, follow, and discriminate changes induced in the overall molecular framework of the biosystem under investigation. This technique using Globars, the intense conventional sources available in the mid-IR domain, has been widely used to characterize bulk systems with a focusing area of about 100 × 100 µm2 with high S/N ratio. The aperture can be reduced, but with a significant increase in noise and acquisition time. On the contrary, the brilliance
Protein Structure and Function . . .
293
gain offered by a synchrotron source is of two or three orders of magnitude higher because of the small size of the source and the limited emission angle of the radiation. SR based microscopy allows performing spectroscopy down to the diffraction limit with a S/N ratio orders of magnitude higher than a conventional source and acquisition time in the scale of a few minutes [6, 7]. The combination of these two unique capabilities allows exploring the dynamic of proteins. The structure associated to a protein is usually described in terms of an organizational hierarchy [15] with a primary sequence, e.g. the linear sequence of aminoacids comprising a protein, and a secondary structure that corresponds to the regular patterns of hydrogen bonding with two almost well-defined structures: the α-helix and the β-sheet. Two other structures can be recognized in a protein: the tertiary (when interaction between α-helix and plated sheets occurs) and the quaternary structure when more than one aminoacid chain exists. As a consequence proteins, except the linear sequence of their peptide bonds, are not rigid and static systems and many different interactions occur also triggered by external excitations. Protein motions can be approximately classified as shown in Table. Actually proteins are “semi-liquid” because the movements of their atoms are larger than those typically observed in solids but smaller than the ones characteristic of a liquid-like water [21]. TABLE Approximate characteristics of the different types of protein motion. Displacement [˚ A]
Time domain [s]
0.01 to 1
10−11 ÷ 10−15
collective motions
0.01 to > 5
10−12 ÷ 10−3
conformational changes
0.5 to > 10
10−9 ÷ 103
atomic and molecular vibrations
The rearrangements of a protein structure may be faster than the time resolution achievable during an XRD experiment. Fast atomic fluctuations, interatomic or molecular vibrations, or very slow movements such as those involving conformational changes of whole domains are all present. The understanding of protein conformational changes is a critical issue not only for future bioengineering applications but also for many therapeutic researches. Since conformational changes are correlated to the vibrational modes induced by the large scale motion, these modes are confined in the far IR and up to the THz region, an energy domain where the IRSR sources exhibit a brilliance two or three orders of magnitude higher than a mercury lamp. Although the long wavelengths of IR radiation limit the spatial resolution that can be achieved [22] using synchrotron radiation, source micro-spectroscopy in the far-IR spectral range has been already performed [23] and time dependent phenomena in proteins could be investigated on the ns timescale [24].
294
A. Marcelli 3. Results
The number of protein investigations performed with FTIR spectroscopy is really impressive and a summary of these researches or of the many achievements obtained using this technique is out of the scope of this contribution. In the following just few selected examples are presented, in order to outline the capabilities of the modern FTIR techniques and the way to obtain spatially resolved chemical and structural information in different conditions, including extreme conditions. Moreover, we will underline the great advantages offered by IR synchrotron radiation sources for spectroscopy and micro-spectroscopy applications in proteins, in view of the non-invasive nature of this technique. Indeed, recent X-ray studies have shown serious damages of the protein structure induced by XRD experiments [25]. As a first example, protein aggregation is a phenomenon that involves medical as well as biotechnological aspects so that analysis of the structural changes of proteins during folding, unfolding, and misfolding pathways is important not only to understand proteins structure and behaviour but also to imagine future biomedical applications. The first study selected is an investigation on protein folding e.g., the search for a single native structure within a large ensemble of conformations that are accessible to the polypeptide chain after its biosynthesis. FTIR spectroscopy can be used to discriminate between the various structures and to distinguish between native and non-native structures during the folding reaction being an effective time resolved spectroscopy sensitive to the secondary structure of proteins. Troullier et al. [26], using a fast-mixing stopped-flow (SF) device, was able to investigate with FTIR spectroscopy the refolding of α-lactalbumin, a 123-residue protein with an α-domain containing 4 α-helices, and a β-domain containing a small β-sheet and a 310 -helix [27]. This work illustrates how it is possible to understand the possibility to detect and characterize at the same time, native and non-native secondary structures during the refolding of this denaturated calcium-binding protein. Major information on the protein secondary structures are contained in the Amide I band, but because each type of secondary structure gives specific components within the Amide I band region, a deconvolution procedure has been applied to resolve the various contributions. From the difference of the integral intensity between different absorbance spectra, subtle secondary structural changes were detected and assigned to specific interactions of the calcium ion in agreement with the available X-ray structure [27]. The same SF-FTIR has been applied also to the refolding kinetics of the α-lactalbumin and because of the numerous information contained in the FTIR spectra more intermediates than detected by other methods have been resolved. This work monitored the FTIR spectra vs. time in the presence and absence of calcium so that the difference spectrum clearly showed that a formation of a significant amount of secondary structure occurred in the early stage of the refolding of the α-lactalbumin. The occurrence of a few interactions with a calcium ion is then important to drive the formation of the
Protein Structure and Function . . .
295
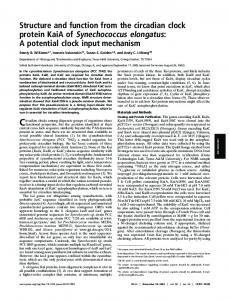
native structure of this protein. The structure of the early kinetic intermediate is native-like but presents flexible secondary structure and no stable tertiary structure. This FTIR analysis also showed that without calcium, the stabilization of the secondary structure and the formation of the tertiary structure is a slow and complex process with formation of intermediate structures. As suggested by refolding studies of other proteins, calcium ions may induce a nucleation mechanism so that cooperative phenomena occur and the folding reaction is faster. All protein folding/unfolding investigations address the question whether this process is fully cooperative or if it contains sequential elements. Time resolved FTIR is not only a powerful method to investigate folding and refolding processes, complementary to other techniques but is able to identify and characterize the structure of a transient intermediate along the folding pathway [26]. The myoglobin secondary structure was the subject of a recent FTIR investigation of Meersman et al. [28]. This work is an accurate comparison of cold-, pressure-, and heat-induced unfolding and aggregation of myoglobin. This experimental FTIR study clearly shows that the pathways of cold- and pressureunfolding are different from heat-unfolding. The analysis has been performed focusing to two typical protein absorption bands: the Amide I and the Amide II, the first one mainly due to the C=O stretching vibration of the backbone chain and sensitive to the protein secondary structure [29]. Because the band is a broad structure, deconvolution and fitting procedures are both necessary to visualize the components and then to assign them to specific types of secondary structures [30]. The main component of FTIR data is the α-helix (1650 cm−1 ) that accounts to almost 3/4 of the secondary structure in agreement with XRD data [31]. In Fig. 1 there are compared FTIR data from Ref. [28] of three different unfolding processes of this protein, focusing on the variation in the wave number region 1600–1700 cm−1 . The main effect of the cooling process (left panels) is an evident decrease in the α-helix (1650 cm−1 ) component with a transition midpoint at about −12.7◦ C, while it is clear that the Amide II band does not disappear completely also at lower temperature (see curve at −25◦ C). Data shows that the process is not completely reversible, and the system looks as a heterogeneous ensemble of refolded and unfolded species. The effect of pressure on myoglobin is outlined in the curves of the central panels of Fig. 1. Upon increasing the pressure, and because of the significant loss of α-helix structure (1650 cm−1 ) and the increase in the random structure component, the Amide I band broadens. Additional structures can be also detected and correlated to protein structural changes during unfolding triggered by pressure (a process that appears to be not reversible). Moreover, looking at the plot of the intensity behaviour of the main component vs. p, two transitions are visible around 4 and 6 kbar respectively, so indicating the existence of an intermediate configuration. The third unfolding process investigated in myoglobin by Meersman et al. [28] is driven by temperature. It is nice to observe in this case (Fig. 1
296
A. Marcelli
Fig. 1. Comparison among three different unfolding processes of myoglobin. All data refer to the deconvoluted Amide I band in the 1600–1700 cm−1 wave number range. In the top left panel there is shown, from bottom (20◦ C) to top (−28◦ C), a stacked plot of the cold unfolding process (all curves are taken at p = 2 kbar excluding the spectra a and d both collected at ambient pressure and 20◦ C). The top central panel is the stacked plot of the pressure unfolding process from bottom (0.7 kbar) to top (10 kbar). The top curve was taken after decompression at 1 kbar. The top right panel is the stacked plot of the temperature unfolding process. From bottom to top the temperature increases from 20◦ C to 90◦ C while the top curve is the spectrum taken at ambient conditions after cooling. In the bottom, from left to right the three panels report the experimental behaviour of the intensity of the band at 1650 cm−1 decreasing temperature, increasing pressure and increasing temperature, respectively (reprinted by permission of Biophysical Society, courtesy of K. Heremans; Ref. [28]).
— right panels) how the main band at 1650 cm−1 disappears above the unfolding temperature, while two new bands, characteristics of intermolecular antiparallel β-sheet aggregation, appear at the transition and further increase with temperature. The intensity of the Amide I band vs. T is a curve with a sharp transition, whose midpoint is located at about 72.3◦ C. These bands are correlated with the partial loss of the original secondary structure which however remains stable up to about 70◦ C. After cooling, the original shape is not recovered and the small shift of the two new bands address only the strengthening of the hydrogen bonds induced by the low temperature. Without entering into the details of the complex mechanism of unfolding and aggregation observed in myoglobin, this study addresses the concept that in proteins cold-, pressure-, and heat-induced unfolding do not follow the same pathway [28]. Moreover, it demonstrates the sensitivity of
Protein Structure and Function . . .
297
the FTIR spectroscopy to the different extreme conditions and its capability to distinguish between different behaviours of the protein components. However, in vitro folding-refolding experiments on isolated purified proteins do not take into account the role of protein crowding within the cell and the existence of specific protein system to maintain proteins in a correct folding or in driving misfolded proteins to degradation. Therefore protein folding-refolding processes studied in vitro might not fit in vivo conditions and therefore also results on intact biological system could not be comparable to those in vitro. As addressed by many experimental researches, changes in protein secondary structure can be correlated to specific diseases. This is one of the most promising aspects of the future research on proteins. Indeed, in the last years a huge effort has been devoted to the research on neurodegenerative disorders affecting the brain and nervous system. Diseases such as scrapie e.g., transmissible spongiform encephalopathies (TSE), bovine spongiform encephalopathy (BSE) and Creutzfeldt– Jakob are all fatal disorders that can be identified by accumulations of the pathological form of the prion protein. Recently Kneipp et al. [32], using a synchrotron radiation IR source and in situ FTIR micro-spectroscopy, have been able to collect IR images of protein structures at a subcellular resolution. Using an IR microscope, protein structures were imaged in individual neurons from the dorsal ganglia of 263 K scrapie-infected Syrian hamster trying to identify disease-related protein structural differences within tissue sections of individual neurons. Images were collected by raster scanning with a step of 4 µm, with a S/N of about 600 co-adding 256 interferograms using a microscope aperture of 10 × 10 µm2 . The high brilliance of the synchrotron radiation source used for the experiments allowed collection of IR images based on the characteristic frequency of the Amide I band at subcellular resolution, resolving the altered protein secondary structure in the scrapie-infected nervous tissue, e.g., clarifying the role of conformational protein changes of these prion protein diseases. In this kind of experiments a high spatial resolution is required because the size of the misfolded aggregates may change with pathologies and disease stages but it is confined to a few microns, a value that approaches the diffraction limit of the radiation at the mid-IR wave numbers (Amide I band — 1650 cm−1 , ≈ 6 µm). Analyzing the IR images obtained by plotting the characteristic frequency of the Amide I band and the ratio of the intensities of the α-helical and β-sheet components of the Amide I band, this work provided evidence that cellular regions that show considerable variations in the protein structure exist. In particular, in these regions the increase in the β-sheet content and the decrease in the α-helical contributions are correlated to the disease status because it has never been observed in the images of control cells. A detailed analysis of the IR spectra showed also that the shift of the Amide I absorption peak is correlated to the intensity of the β-sheet band, a behaviour observed also in IR spectra of Alzheimer’s neuritique plaques [33], while the new band component observed at 1631 cm−1 has
298
A. Marcelli
been correlated to β-sheets with strong hydrogen bonds typical of prion protein aggregates. Although the mechanisms behind the disease process remains unclear, and additional experiments and combined analysis have to be performed to isolate the “signal” of a pathological prion protein, this work demonstrates again that IR spectro-microscopy may detect changes correlated to conformational changes or misfolding of these aggregates. Coming back to protein dynamics, a key issue in the understanding of protein folding/unfolding mechanism is to distinguish between the cooperative or sequential nature of the process. To address this relevant question, two specific experimental capabilities of IR spectroscopy are needed: the sensitivity to detect minor changes of the protein structure and the capability to correlate non-cooperative changes to a sequence of events. As shown by a previous example on protein dynamics, researchers need accurate tools capable to detect not only small differences in individual spectral features, but also to correlate them to a sequence of events that may be induced by an external perturbation. For many applications 2D IR correlation spectroscopy may represent the necessary tool. Actually, the 2D correlation methodology for an analysis of IR spectra (or other types of spectra) was proposed by Noda [19] and later developed to emulate a technique used in NMR. However, vibrational relaxation rates are orders of magnitude faster than the typical spin relaxation rates of NMR (typically ps vs. µs), and therefore, ordinary IR spectrometers cannot provide the rapid excitation and detection necessary for such experiments. Waiting for the availability of a new generation of detectors and spectrometers to generate 2D IR correlation spectra, a slower relaxation process must be introduced to perturb the molecular system of interest. The present 2D IR correlation approach exploits deviations of spectral intensities from an expected value, when IR spectra are collected sequentially as a function of a perturbing parameter (i.e., T , p, pH, etc.) and compared at two discrete and independent wave numbers [34]. The main advantages of 2D correlation spectroscopy in the analysis of a set of dynamic spectra are the following: a) spectral resolution is enhanced by spreading spectral peaks over the second dimension so that overlapping bands can be resolved; b) intra- and intermolecular interactions can be understood through the correlation analysis of the vibrational components; c) kinetics of molecular vibrations can be investigated by probing the specific order of the spectral intensity changes; d) spectral assignments can be performed taking into account the observed correlations among bands. The 2D correlation analysis can be represented by fishnet plots or contour maps such as those shown in Fig. 2 [35], in terms of both synchronous and asynchronous spectra. The first kind of plot reflects the correlation of the simultaneous change of spectral intensity. Synchronous spectra (top panel of Fig. 2) are sym-
Protein Structure and Function . . .
299
metric with respect to the panel diagonal line. The peaks located at the diagonal are called autopeaks. One is visible in Fig. 2, lying on the diagonal (dashed) line. These peaks have always a positive intensity, because they represent the autocorrelation functions of the spectral intensity variations. In these spectra cross-peaks are located in off-diagonal positions and represent the synchronicity of the spectral variations between two different spectral coordinates, e.g., they reflect the existence of a cooperation or interaction between different molecular groups. Asynchronous spectra are antisymmetric with respect to the diagonal so that no autopeaks are present, while the presence of asynchronous cross-peaks indicates the sequential changes of the spectral intensities. The sign of the asynchronous peak may be positive or negative, e.g., if the intensities of two spectral variables increase (or decrease) together, the sign of the cross-peak is positive. On the other hand, the sign is negative if one variable increases while the other decreases.
Fig. 2. Examples of 2D correlation spectra: synchronous (a) and asynchronous (b) contour maps showing a typical autopeak and a cross-peak. In the maps grey areas refer to negative values (courtesy of P. Innocenzi see Ref. [35]).
Kinetic intermediates have been observed for a number of proteins on folding but rarely during unfolding processes. Two-dimensional IR correlation spectroscopy has been applied in protein researches to investigate whether the folding/unfolding process is fully cooperative or exhibits a sequential structure. To
300
A. Marcelli
address this question, Fabian et al. [36] performed a 2D correlation analysis on the IR spectra of the Cro-V55C dimmer of the λ Cro repressor, a small DNA-binding protein, one of the rare proteins whose thermal unfolding proceeds through stable equilibrium intermediates. This investigation demonstrated the capability of FTIR to detect a potential sequence of events in response to an external perturbation such as temperature. In the specific case of the λ Cro repressor, the experiments performed between 20◦ and 95◦ C provided the evidence for sequential events in the formation and, in addition, the unfolding of the stable intermediate. Although the quaternary structure of the intermediate is not determined, the process of the sequential unfolding of the Cro-V55C repressor protein can be described as a three-step reversible process with an intermediate complex (at 60◦ C) of two associated dimers that dissociate, at higher temperature, into two unfolded dimers connected by a disulfide bridge. The sophisticated 2D-correlation analysis, extremely sensitive to small differences in individual spectral features, indicated also that the observed transition occurs in a complex way and, thanks to the capability to detect the sequence of events in response to the external perturbation applied to the system, only after certain secondary structures have been changed. To improve the quantitative description of the degree of coherence between spectral intensity changes and the sequence of molecular events in a set of dynamic spectra, a new method of correlation has been recently introduced [37] and applied to the study of protein structure to probe the conformational intermediates [38]. 4. Conclusions The manuscript has been dedicated to the broad applicability and versatility of IR micro-spectroscopy in protein researches. However, this contribution is far to be exhaustive and to conclude it is necessary to outline the areas where significant advancements are expected in the next years. The first is correlated to the use of brilliant synchrotron radiation source in the far IR domain down to the THz region (1 THz = 33 cm−1 ). Because this is the spectral region where collective vibrational and rotational modes of molecules lie, modes in this region are related to dynamics of biomolecules in particular proteins and DNA. Since it is known that the residue group dominates the electric and dielectric properties of a protein, spectroscopic studies of the excitations observed in this energy region will yield in the future important information [39–41]. Recently, changes in IR spectra have been correlated with the biochemistry of disease in biological tissue. Indeed, a single IR spectrum contains information about the molecular structure, intermolecular interactions, and band components so that IR imaging contains much more information than a single spectrum, it is more flexible and chemical and structural information are presented in a form readily comprehensible also to non-spectroscopists. Moreover, despite the still limited number of researches, the works performed on tissue specimens clearly demonstrate that IR protein signatures can be correlated to histological and pathological
Protein Structure and Function . . .
301
characteristics of the sample under investigation at subcellular resolution [42–44]. Actually, the differentiation of tissue types based on variations of band positions, intensities and halfwidths in the Amide I, Amide II manifolds may return precious information in protein abundance as well as changes in protein secondary structure. This information will be certainly applied in the future in medicine as diagnostic tools, as soon as the actual limitations, associated with the complex methodology required to resolve the dense manifold of IR states, will be overcome. This goal is correlated also with the concomitant development of new pre-treatment procedures and classifications, using improved multivariate data reduction techniques such as hierarchical clustering and artificial neural network (ANN) analysis. In the last decade the huge improvements of FTIR micro-spectroscopy are associated also to spatial resolution capabilities. The limit to the resolution in optical imaging techniques is directly related to the wavelength of the radiation and it is impossible to focus light onto a spot smaller than half of its wavelength. However the high brightness of IRSR allows probing with high S/N ratio [45] regions smaller than the wavelength, in agreement with diffraction theory [46]. With such small apertures the mapping of an area as large as a fraction of millimetre can require some hour with a conventional source, and the synchrotron radiation is the only reliable alternative. However, using new systems that offer a homogeneous illumination over the field of view [6] and an array of IR detectors called focal plane array (FPA) an image with high spatial resolution, determined by the pixel size of the detector, can be collected without the use of an aperture. Each individual detector (pixel) of the array collects an IR spectrum and combining the multichannel detection of an FPA with the spectral multiplexing advantage of FTIR, an entire sample field of view can be imaged in the same time of a single spectrum. Because the FPAs now available for spectroscopic imaging were originally developed for military applications or astronomical researches, they are not optimized for FTIR spectro-microscopy with synchrotron radiation [9]. The state of the art in this field is then represented by a system composed of a microscope with an FPA and synchrotron radiation. This setup already enhances all FTIR capabilities but in the future we will certainly see new integrated systems designed to match the projected size of the synchrotron radiation source in order to preserve the SR brilliance and allowing faster data acquisition [47, 48]. Fast data collection is already one of the most relevant aspects of FTIR spectroscopy for protein dynamics but when new detectors or detection schemes will be available, it will be possible to take advantage also of another relevant feature of the synchrotron radiation: the time structure. Indeed, synchrotron radiation is a pulsed emission with a bunch length that depends on the storage rings characteristics, typically in the subnanosecond time domain. Time-resolved spectroscopy can be performed with different data acquisition methods: but while step-scan mode is the fastest option for repeatable events, the rapid scan mode only allows, without affecting the data collection, fast data acquisition for transient
302
A. Marcelli
events [35]. Time-resolved spectroscopy in imaging modality has been recently introduced using an FPA, and represents certainly one of the most important and versatile option for future improvements in the observation of dynamic phenomena in proteins, of biological molecules, reaction and binding mechanisms, etc. [49]. In the post-genomic era, the concept that a correlation between structure and function exists is well established. However the understanding of the function of proteins, even if we know their structure, is not simple because proteins are nanosystems with a dynamic behaviour characterized by a high efficiency at input energies comparable with the thermal energy. IR spectro-microscopy is today already a reliable and mature technique for the investigations of these nanosystems, but the expected improvements in detectors and sampling techniques, molecular biology methods, and software related developments guarantee that in the next years vibrational spectroscopy will remain a fundamental tool for protein researches. Acknowledgments Sincere thanks are due to G. Bellisola, G. Cibin, and G. Cinque. A special thank is due to P. Innocenzi who introduced me to the 2D correlation spectroscopy and to W. Kwiatek for his enthusiasm and patience. References [1] Y. Jiang, A. Lee, J. Chen, V. Ruta, M. Cadene, B.T. Chait, R. MacKinnon, Nature 423, 33 (2003). [2] A. Wlodawer, R. Bott, L. Sjolin, J. Biol. Chem. 257, 1325 (1982). [3] Q. Braun, Rev. Biophys. 19, 115 (1987). [4] G.B.B.M. Sutherland, Adv. Pro. Chem. 5, 291 (1952). [5] A. Barth, C. Zscherp, Quart. Rev. Biophys. 35, 369 (2002). [6] I.W. Levin, R. Bhargava, Ann. Rev. Phys. Chem. 56, 429 (2005). [7] P. Dumas, L. Miller, Vibrat. Spectrosc. 32, 3 (2003). [8] C.M. Snively, C. Pellerin, J.F. Rabolt, D.B. Chase, Anal. Chem. 76, 1811 (2004). [9] P. Colarusso, L.H. Kidder, I.W. Levin, J.C. Fraser, J.F. Arens, E.N. Lewis, Appl. Spectrosc. 52, 107A (1998). [10] A.J. Sommer, in: Handbook of Vibrational Spectroscopy, Eds. J.M. Chalmers, P.R. Griffiths, Wiley, Chichester 2002, p. 1369. [11] A. Dong, R.G. Messerschmidt, J.A. Reffner, W.S. Caughey, Biochem. Biophys. Res. Commun. 156, 752 (1988). [12] Handbook of Vibrational Spectroscopy, Eds. J.M. Chalmers, P.R. Griffiths, Wiley, Chichester 2002. [13] J.R. Powell, F.M. Wasacz, R.J. Jakobsen, Appl. Spectrosc. 40, 339 (1986). [14] F. Dousseau, M. Therrien, M. Pezolet, Appl. Spectrosc. 43, 538 (1989). [15] G.A. Petsko, D. Ringe, Protein Structure and Function, New Science Press Ltd, London 2004.
Protein Structure and Function . . .
303
[16] H.H. Mantsch, D. Chapman, Infrared Spectroscopy of Biomolecules, Wiley, New York 1996. [17] B. Stuart, Biological Applications of Infrared Spectroscopy, Wiley, Chichester 1997. [18] J.L.R. Arrondo, F.M. Goi, Prog. Biophys. Mol. Biol. 72, 367 (1999). [19] I. Noda, Bull. Am. Phys. Soc. 31, 520 (1986). [20] A. Marcelli, P. Calvani, Nucl. Sci. Technol. 14, 93 (2003). [21] F.N. Keutsch, R.J. Saykally, Proc. Natl. Acad. Sci. USA 98, 10533 (2001). [22] G.L. Carr, G.P. Williams, SPIE Conf. Proc. 3153, 51 (1997). [23] L. Miller, M. Sullivan, J. Toomey, N. Marinkovic, G.L. Carr, G.P. Williams, M.R. Chance, Synchr. Radiat. Instrum. 521, 47 (1999). [24] G.L. Carr, Vibrat. Spectrosc. 19, 53 (1999). [25] J. Yano, J. Kern, K.-D. Irrgang, M.J. Latimer, U. Bergmann, P. Glatzel, Y. Pushkar, J. Biesiadka, B. Loll, K. Sauer, J. Messinger, A. Zouni, V.K. Yachandra, Proc. Natl. Acad. Sci. USA 102, 12047 (2005). [26] A. Troullier, D. Reinst¨ adler, Y. Dupont, D. Naumann, V. Forge, Nature Struct. Biol. 7, 78 (2000). [27] A.C. Pike, K. Brew, K.R. Acharya, Structure 4, 691 (1996). [28] F. Meersman, L. Smeller, K. Heremans, Biophys. J. 82, 2635 (2002). [29] M. Jackson, H.H. Mantsch, Crit. Rev. Biochem. Mol. Biol. 30, 95 (1995). [30] D.M. Byler, H. Susi, Biopolymers 25, 469 (1986). [31] S.V. Evans, G.D. Brayer, J. Mol. Biol. 213, 885 (1990). [32] J. Kneipp, L.M. Miller, M. Joincic, M. Kittel, P. Lasch, M. Beekes, D. Naumann, Biochem. Biophys. Acta 1639, 152 (2003). [33] L.P. Choo, D.L. Wetzel, W.C. Halliday, M. Jackson, S.M. LeVine, H.H. Mantsch, Biophysical J. 71, 1672 (1996). [34] I. Noda, A.E. Dowrey, C. Marcott, G.M. Story, Y. Ozaki, Appl. Spectrosc. 54, 236A (2000). [35] P. Innocenzi, L. Malfatti, T. Kidchob, P. Falcaro, M. Cestelli Guidi, M. Piccinini, A. Marcelli, Chem. Commun. 18, 2384 (2005). [36] H. Fabian, H.H. Mantsch, C.P. Schultz, Proc. Natl. Acad. Sci. USA 96, 13153 (1999). [37] D.L. Elmore, R.A. Dluhy, J. Phys. Chem. B 105, 11377 (2001). [38] S. Shanmukh, P. Howell, J.E. Baatz, R.A. Dluhy, Biophys. J. 83, 2126 (2002). [39] S.W. Smye, J.M. Chamberlain, A.J. Fitzgerald, E. Berry, Phys. Med. Biol. 46, R101 (2001). [40] B.M. Fischer, M. Walther, P. Uhd Jepsen, Phys. Med. Biol. 47, 3807 (2002). [41] L.M. Miller, G.D. Smith, G.L. Carr, J. Biol. Phys. 29, 219 (2003). [42] P. Lasch, M. Bose, A. Pacifico, M. Diem, Vibrat. Spectrosc. 28, 147 (2002). [43] P. Lasch, W. Haensch, E.N. Lewis, L.H. Kidder, D. Naumann, Appl. Spectrosc. 56, 1 (2002). [44] B.R. Wood, L. Chiriboga, H. Yee, M.A. Quinn, D. McNaughton, M. Diem, Gynecol. Oncol. 93, 59 (2004).
304
A. Marcelli
[45] J.A. Reffner, P.A. Martoglio, G.P. Williams, Rev. Sci. Instrum. 66, 1298 (1995). [46] G.L. Carr, Rev. Sci. Instrum. 72, 1 (2001). [47] S.W. Huffman, R. Bhargava, I.W. Levin, Appl. Spectrosc. 56, 965 (2002). [48] C.M. Snively, C. Pellerin, J.F. Rabolt, D.B. Chase, Anal. Chem. 76, 1811 (2004). [49] C.M. Snively, S. Katzenberger, G. Oskarsdottir, J. Lauterbach, Opt. Lett. 24, 1841 (1999).