Proteomic Patterns and Prediction of Glomerulosclerosis and Its Mechanisms Baogang J. Xu,* Yu Shyr,† Xiubin Liang,‡ Li-jun Ma,‡ Ellen M. Donnert,‡ Jeremy D. Roberts,† Xueqiong Zhang,† Valentina Kon,§ Nancy J. Brown,储 Richard M. Caprioli,¶ and Agnes B. Fogo‡§储 Departments of *Cancer Biology, †Biostatistics, ‡Pathology, §Pediatrics, 储Medicine, and ¶Biochemistry, Vanderbilt University Medical Center, Nashville, Tennessee Protein expression profiles linked to sclerosis in the 5/6 nephrectomy (Nx) rat model of focal segmental glomerulosclerosis were investigated. Sections of control glomeruli from normal baseline Nx tissue and nonsclerotic and sclerotic glomeruli from 12 wk after 5/6 Nx were isolated by laser capture microdissection. Protein profiles were acquired directly by matrix-assisted laser desorption/ionization time-of-flight mass spectrometry. Classification accuracy was 99.2% for distinguishing normal versus sclerotic glomeruli and 96.7 and 97.8% for nonsclerotic versus normal and sclerotic glomeruli, respectively. The proteomic pattern of the nonsclerotic glomeruli was more similar to sclerotic than normal glomeruli (P < 0.0001). Thymosin 4, a protein with relevant interactions with plasminogen activator inhibitor-1, angiogenesis, and wound healing, was identified as a key differentially expressed protein. Thymosin 4 immunostaining was increased in sclerotic glomeruli, predominantly in endothelial cells. Downregulation of thymosin 4 by RNAi in cultured glomerular endothelial cells decreased angiotensin II–induced plasminogen activator inhibitor-1 expression. In conclusion, proteomic patterns can accurately distinguish normal versus nonsclerotic versus sclerotic glomeruli. The closely related proteomic patterns of nonsclerotic and sclerotic glomeruli suggest early activation of prosclerotic mechanisms even in seemingly intact glomeruli. Thymosin 4 is a marker of such early events and may even contribute to sclerosis. J Am Soc Nephrol 16: 2967–2975, 2005. doi: 10.1681/ASN.2005030262
P
rogression of focal segmental glomerulosclerosis (FSGS) from early injury to overt sclerosis involves injury to all glomerular cell types (1,2), through multiple complex mechanisms. With the advancement of proteomic techniques (3,4), simultaneous examination of hundreds of proteins related to kidney disease holds promise in unraveling novel underlying mechanisms of progression and thus identifying possible targets for intervention in FSGS. To obtain protein expression profiles from a localized area, laser capture microdissection (LCM) has been combined with matrix-assisted laser desorption/ionization mass spectrometry (MALDI MS) for tissue protein profiling (5,6). LCM is an important tool in biologic research, enabling the isolation of specific cell populations from a heterogeneous tissue section (7). The technique of direct protein profiling from the laser capture microdissected sample using MALDI MS is fast, sensitive, and accurate. This technique has been applied in several studies, including those of human breast carcinoma (5), mouse epididymis (8), and human lung carcinoma (9). This technique enables the determination of protein expression profiles from even minute tissue structures within limited samples.
Received March 9, 2005. Accepted June 23, 2005. Published online ahead of print. Publication date available at www.jasn.org. Address correspondence to: Dr. Agnes B. Fogo, MCN C3310, Department of Pathology, Vanderbilt University Medical Center, Nashville, TN 37232. Phone: 615-322-3114; Fax: 615-343-7023; E-mail:
[email protected] Copyright © 2005 by the American Society of Nephrology
The focal segmental nature of sclerosis in FSGS raises the question of whether at a given time point the remaining nonsclerotic glomeruli are already programmed to sclerotic pathways or, alternatively, whether these remaining nonsclerotic glomeruli have less prosclerotic activation and thus may be more susceptible to therapy. We therefore sought to examine proteomic profiles from the nonsclerotic glomeruli in FSGS and compare profiles from them with normal glomeruli and glomeruli with established sclerosis. We aimed first to establish the sensitivity of LCM and MALDI MS techniques to differentiate sclerosis from normal and, second, to investigate whether nonsclerotic glomeruli have a prosclerotic phenotype at the protein level. We also sought to identify key differentially expressed protein markers to advance our understanding of mechanisms and possible intervention in progressive renal disease.
Materials and Methods FSGS Model Adult male Sprague Dawley rats (n ⫽ 6; 250 to 300 g; Charles River Laboratories, Wilmington, MA) were studied. Rats were housed under normal conditions with a 12-h light/dark cycle, at 70°F, with 40% humidity, and with 12 air exchanges per hour and received normal rat chow and water ad libitum (5001 diet; Purina Laboratory [St. Louis, MO] Rodent diet; 23.4% protein, 4.5% fat, 6.0% fiber, 0.40% sodium). Rats underwent 5/6 nephrectomy (Nx) under pentobarbital anesthesia by right unilateral Nx and ligation of branches of the left renal artery, producing a total of 5/6 renal ablation. FSGS was well developed by 12 wk after 5/6 Nx, and rats then were sacrificed. Glomerulosclerosis was ISSN: 1046-6673/1610-2967
2968
Journal of the American Society of Nephrology
defined as collapse and/or obliteration of glomerular capillary tuft accompanied by hyaline material and/or increase of matrix (10). In the remnant kidney, glomeruli with normal histology (“nonsclerotic” glomeruli) and sclerotic glomeruli were analyzed. Glomeruli from nephrectomized right kidneys that were obtained at time of induction of 5/6 Nx were used as normal control glomeruli.
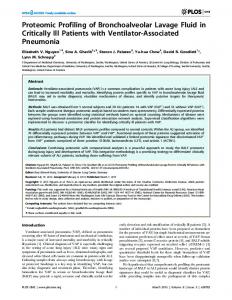
LCM Frozen kidney samples from 5/6 Nx and normal baseline were partially embedded in OCT, and 5-m-thick cryostat sections were cut and dehydrated as follows: 70% ethanol 30 s, 95% ethanol 1 min, 100% ethanol 1 min ⫻2, xylene 2.5 min ⫻2, and air dried. LCM phase microscopy, using the Arcturus PixCell II LCM system (Mountain View, CA) with a focused 30-m laser beam, was used to precisely identify and dissect glomeruli without surrounding tissue (Figure 1). Glomeruli were identified by phase microscopy as (1) normal in baseline kidney (Figure 1A) and (2) sclerotic (Figure 1B) or (3) nonsclerotic in 5/6 Nx kidney. These three groups of glomeruli were captured separately onto different LCM caps (Mountain View, CA). On average, 50 normal glomerular sections from different glomeruli were captured from the baseline nephrectomy kidneys for each rat. From the remnant kidneys 12 wk after 5/6 Nx, 30 nonsclerotic and 50 sclerotic glomerular sections from different glomeruli were obtained from each rat using LCM, except for one rat, which did not have sufficient nonsclerotic glomeruli present in the ablated kidney. All six rats with 5/6 Nx had sufficient sclerotic glomeruli for LCM analysis.
MALDI Mass Spectrometry Protein expression profiles were obtained directly from laser-microdissected cells using MALDI MS (5). The LCM thermoplastic films with captured cells were peeled from the LCM cap using forceps and mounted on a MALDI target plate using a conductive double-sided tape (Digi-Key, Thief River Falls, MN). Sinapinic acid (Sigma, St. Louis, MO) solution (20 mg/ml, 50/50/0.3 [vol/vol/vol] acetonitrile/water/ TFA,) was microspotted on the captured cells under microscope visualization using pulled fine-glass capillaries. Upon solvent dehydration, the matrix and proteins co-crystallized together. MALDI MS analyses were performed in the linear mode under the optimized delayed extraction condition on an Applied Biosystems DE-STR Voyager mass spectrometer (Framingham, MA). The crystals were irradiated by a
Figure 1. Laser capture microdissection (LCM) of normal (top) and sclerotic glomeruli (bottom). (A and B) The normal and sclerotic glomeruli can be recognized clearly. (C and D) The remaining tissue section after the glomerulus was microdissected. (E and F) The microdissected glomeruli on the LCM film. The nonsclerotic glomeruli had the same morphology as the normal glomeruli. Bar ⫽ 100 m.
J Am Soc Nephrol 16: 2967–2975, 2005 series of pulsed light from a nitrogen laser ( ⫽ 337 nm) in a high vacuum, resulting in the desorption and ionization of the proteins from the surface of the tissue. Predominately singly charged protonated ions of the form [M⫹H]⫹ were formed, in which M was the protein molecular weight. The protein ions were accelerated in the ion source and subsequently separated in a time-of-flight (TOF) mass analyzer. Each mass spectrum was obtained averaging signals from 250 consecutive laser shots from five microdissected glomerular sections. After internal calibration, the mass spectra were baseline subtracted and normalized using the software developed in our laboratory before statistical analysis.
Protein Identification Remaining frozen kidney cortex from the same samples investigated by LCM was homogenized in 500 l of protein extraction buffer using an ice-chilled Duall glass homogenizer. The protein extraction buffer was composed of 0.25 M sucrose (J.T. Baker, Phillipsburg, NJ), 0.01 M Tris-HCl (J.T. Baker), and 0.1 mM PMSF (Sigma). The homogenate was centrifuged according to the following sequence: 10 min at 680 ⫻ g, 10 min at 10,000 ⫻ g, and 1 h at 100,000 ⫻ g. The final supernatant was filtered using a Millipore Ultrafree-MS 30,000 nominal molecular weight limit centrifugal filter device (Bedford, MA). A volume of 150 l of filtrate was separated on a Vydac 259VHP5415 polymeric column (Hesperia, CA) at 40°C using a Waters Alliance HPLC system (Milford, MA). Solvent A contained 0.1% TFA (Burdick and Jackson, Muskegon, MI) in water, and solvent B contained 0.085% TFA in acetonitrile (Fisher Scientific, Fair Lawn, NJ). A flow rate of 1 ml/min was used with a gradient started from 5% B for 5 min, then in 55 min to 60% B, then in 10 min to 95% B and held at 95% B for 10 min. The fractions were collected every minute and then completely dried using a Thermo Quest Savant Speedvac (Holbrook, NY). Dried HPLC fractions were reconstituted in 10 l of 5/5/0.3 (vol/vol/vol) acetonitrile/water/TFA and analyzed by MALDI-TOF MS. The fractions that contained target protein markers, identified by statistical analysis (see below) from LCM samples, were completely lyophilized again and reconstituted with 10 l of 0.4 M ammonium hydrogen carbonate (Sigma). These fractions were reduced with 5 l of 45 mM dithiothreitol (Sigma) in incubation at 60°C for 15 min, followed by alkylation with 5 l of 100 mM iodoacetamide (Sigma) in the dark for 15 min. One microliter of 1 g/l sequencing-grade trypsin (Promega, Madison, WI) was added, and the digestion allowed to proceed for 4 h at 37°C. The digested fractions were subjected to liquid chromatography tandem mass spectrometry (LC-MS/MS) analysis using a ThermoFinnigan LTQ mass spectrometer (San Jose, CA). Two microliters of sample were loaded into a 100-m internal diameter self-packed microcapillary reverse-phase column packed with Monitor C18-Spherical Silica from Column Engineering Inc (Ontario, CA). The mobile phase A was 0.1% formic acid (EM Science, Darmstadt, Germany) in water, and phase B was 0.1% formic acid in acetonitrile. The gradient for mobile phase B started at 0% for 3 min, to 5% in 2 min, to 50% in 45 min, and to 90% in 5 min. The flow rate at the source was 700 nl/min. The fragment ion mass spectra were used to search the National Center for Biotechnology Information rat protein database using the SEQUEST algorithm (11).
Immunohistochemistry For immunostaining, rat kidney tissue was fixed in 4% paraformaldehyde overnight at 4°C, routinely processed, and embedded in paraffin. Four-micrometer sections were treated with 3% hydrogen peroxidase for 10 min and Powerblock (BioGenex Laboratories, San Ramon, CA) for 45 min, incubated with primary rabbit anti-thymosin 4 anti-
J Am Soc Nephrol 16: 2967–2975, 2005
Proteomic Patterns and Prediction of Glomerulosclerosis
body (Biodesign, Saco, ME) for 1 h at 37°C, and rinsed twice with PBS. Horseradish peroxidase (HRP)-conjugated swine anti-rabbit antibody (Dako, Carpinteria, CA) was added and incubated for 45 min at room temperature. After rinsing three times with PBS, diaminobenzidine was added as a chromagen. Slides were counterstained with hematoxylin. Infiltrating macrophages were detected with doublestaining for thymosin 4 and mouse mAb to ED1 (BioSource International, Camarillo, CA), a macrophage marker, followed by biotinylated goat anti-mouse IgG (BioGenex) for 30 min and alkaline phosphatase-streptavidin conjugate (BioGenex) for 30 min. Sections were developed with Sigma fast red TR/Naphthol AS-MX for 5 min, then counterstained and coverslipped. Glomerular endothelial cells (GEN) and mesangial cells were identified on serial sections by immunostaining with anti–RECA-1 antibody (Abcam, Cambridge, MA) and mouse anti-rat CD90 (Thy-1) antibody (BD Pharmingen, San Diego, CA), respectively. Negative controls omitting the primary antibody and using nonspecific Ig showed no staining. Positive control using rat spleen showed the expected distribution of thymosin 4 (12).
scrambled control was used for the subsequent experiments. Results were compared with normal GEN as baseline control.
Cell Culture GEN, derived from SV40 mice (gift from Dr. Michael Madaio, University of Pennsylvania, Philadelphia) were grown in 10% FBS that had been heat-inactivated at 56°C for 1 h, with DMEM:Ham F12 media (low-glucose DMEM, 6 mM) in a 3:1 ratio, with l-glutamine 2 mM and HEPES 10 mM added (13). The cells were grown at 37°C with 5% CO2 under humid conditions in Corning flasks. The cells showed CD31 expression, confirming endothelial cell phenotype. Primary cultures of podocyte were performed as follows: Rat kidney cortex was isolated and minced, and glomeruli were isolated by sieving (sieve pore size 180 ⫻2, 75 ⫻1). Glomeruli then were suspended in DMEM/Ham’s F-12 (2:1) that contained 0.2-m-filtered 3T3-L1 supernatant, 5% heatedinactivated FCS, ITS solution, and 100 /ml penicillin-streptomycin. The cells then were plated onto collagen type I– coated flasks and incubated at 37°C, room air with 5% CO2. After 4 d, cell colonies began to sprout around the glomeruli. Cells showed an epithelial morphology with a polyhedral shape when confluence was reached at day 7. The cells were characterized as podocytes by detection of podocyte-specific markers synaptopodin and nephrin by immunofluorescence staining.
siRNA Design and Transfection Control siRNA and siRNA (antisense and sense strands) for thymosin 4 (Thym) were designed as suggested by the manufacturer (Invitrogen, San Diego, CA). The sense strand sequences for four different siRNA and scrambled controls were as follows: Thym 1, 5⬘-CCGATATGGCTGAGATCGAGAAATT; Thym 2, 5⬘-GAGAAGCAAGCTGGCGAATCGTAAT; Thym 3, 5⬘-TCAAAGAATCAGAACTACTGAGCAG; Thym 4, 5⬘-GGGAGATGATGAAATAGAGAGGAAA; control Thym 1, 5⬘-CCGGGTAAGTCCTAGAGAGATAATT; control Thym 2, 5⬘-GATCCATGCAGCGTATCCGATGAAT; control Thym 3, 5⬘-TCATAAGAGACATCAAGTCGAACAG; and control Thym 4, 5⬘-GGGATGATGAAATAGAGAGGAGAAA. In vitro transfections were performed using Lipofecta 2000 Reagent (Invitrogen) according to the manufacturer’s instructions. In brief, GEN were seeded on to six-well plates 1 d before transfection. Transfection with siRNA was done when cells were above 50% confluent. A total of 100 pmol of siRNA was used for 5 ⫻ 105 cells in 2 ml of medium. Cells were washed 48 h after transfection. Angiotensin was used to stimulate GEN as a model of sclerosis mechanisms. GEN were stimulated with angiotensin II (Ang II; 10⫺6 M) for 24 h, with or without concomitant transfection with siRNA or control siRNA. Because all four designed siRNA achieved equal downregulation of thymosin 4 in pilot experiments, only one set of siRNA and its
2969
Western Blot Analysis For thymosin 4 Western blot analysis, 100 g of cell lysate from cultured GEN, podocytes, or muscle or spleen tissue homogenates was separated by electrophoresis on 4 to 20% Tris-glycine gel (BioRad). Equal protein loading was confirmed by Coomassie blue staining of duplicate gels after electrophoresis. The gels were incubated for 1 h in PBS that contained 10% glutaraldehyde (Sigma), washed three times for 20 min in PBS, and incubated further in a blotting buffer that contained 1⫻ Tris-glycine transfer buffer (Invitrogen) and 20% methanol for 30 min at room temperature. Proteins were transferred to a nitrocellulose membrane (BioRad) by electrotransfer. The membrane was preincubated for 2 h in PBS that contained 5% skim milk and 0.05% Tween 20 (PBS-T), incubated for 1 h at room temperature in PBS-T with specific antibody (rabbit polyclonal anti-thymosin 4; 1:1000; Biodesign), washed five times with PBS-T, and incubated with HRP-conjugated secondary antibody (Amersham Biosciences, Buckinghamshire, UK) for 1 h at room temperature. The membranes were washed five times with PBS-T, and bound antibody was detected with an enhanced chemiluminescence detection kit (Amersham Biosciences). Mouse spleen and muscle tissues were used as positive and negative controls, respectively. For Western blot analysis of plasminogen activator inhibitor-1 (PAI1), GEN cell lysate was separated by electrophoresis on 10% Trisglycine gel (BioRad). After the transfer of protein, the membrane was incubated with antibody specific for sheep anti-mouse PAI-1 antibody (1:250; American Diagnostica Inc., Greenwich, CT). After incubation with HRP-labeled anti-sheep IgG secondary antibody (1:1000 dilution in 5% milk TBS-T), the protein bands on Western blots were visualized as above and developed on film. The membranes were restripped for -actin, used as a housekeeping control protein (Sigma) (14).
Statistical Analyses The primary objectives of this study were to identify protein patterns that correlate with biologic groups and assess the protein patterns’ closeness among three biologic groups. The intrasample variability of all of the mass spectra obtained within these three different groups was analyzed using Pearson correlation coefficient analysis. The statistical analyses for identifying a set of proteins expressed differentially between biologic groups were focused on the following steps: (1) Selection of important proteins that were differentially expressed among the study groups. The selection was based on Kruskal-Wallis test, Fisher exact test (dichotomize the expression level as present or not), permutation t test, Significance Analysis of Microarrays (15), Weighted Gene Analysis (16), and the modified info score method (17,18). The proteins were ranked on the basis of the results from all six methods. (2) The Weighted Flexible Compound Covariate Method (WFCCM) (19 –22) was used in the class-prediction model based on the ranked proteins to verify whether the proteomic patterns could be used to classify study samples into two classes according to the chosen parameter, e.g., normal versus nonsclerotic. The WFCCM method was designed to combine the most significant proteins associated with the biologic status from each analysis method, and it reduced the dimensionality of the problem using a new covariate obtained as a weighted sum of the most important predictors. We estimated the misclassification rate using leave-oneout as well as 10-fold cross-validated class prediction methods based on the WFCCM. (3) The agglomerative hierarchical clustering algorithm was applied to investigate the pattern among the statistically significant
2970
Journal of the American Society of Nephrology
discriminator proteins as well as the biologic status using M. Eisen’s software (23). The statistical analyses for assessing the profile closeness between biologic groups were focused on the following steps: First, the profile difference between two biologic groups was measured using the Weighted Gene Analysis method for each individual protein. This method is based on the between- and within-group Euclidean distance. After the profile difference was estimated, the assessment of the overall closeness among three biologic groups was completed using the restricted/residual maximal likelihood– based mixed-effect model to test the significance of the closeness among three groups. The comparison of quantitative analysis of thymosin 4 among three classes of glomeruli and the comparison of PAI-1 expression in GEN were completed using the General Linear Model (ANOVA) to test the mean difference. All of the tests of significance were two-sided, and the differences were considered statistically significant at P ⬍ 0.05.
Results Protein Profiles Obtained by MALDI-TOF Mass Spectrometry Each MALDI mass spectrum was obtained from an average of five microdissected glomerular sections averaging signals from 250 consecutive laser shots. From the six rats, a total of 60, 30, and 60 mass spectra were obtained from approximately 300 normal, 150 nonsclerotic, and 300 sclerotic 5-m-thick glomerular sections, respectively. Approximately 200 protein signals were detected per spectrum in the mass range of 2000 to 70,000 Da, with the signals under 20,000 Da yielding the best resolution. Differentially expressed signals were found among the three different classes of glomeruli (Figure 2). The intraindividual variability of all of the mass spectra obtained within these three different groups was obtained. For normal glomeruli, the average R2 was 0.84; for the nonsclerotic glomeruli, the average R2 was 0.80. The average R2 for the sclerotic group was 0.77. These data indicate that the sclerotic glomeruli have more variable proteomic patterns than the nor-
Figure 2. Mass spectra obtained from three groups of glomeruli: Normal baseline glomeruli obtained from the nephrectomized kidneys (A), nonsclerotic glomeruli from the remnant kidney 12 wk after 5/6 nephrectomy (Nx; B), and sclerotic glomeruli from the remnant kidney 12 wk after 5/6 Nx (C). The mass spectrometry (MS) peaks corresponding to thymosin 4, a key protein marker identified, are shown with the arrow.
J Am Soc Nephrol 16: 2967–2975, 2005
mal control glomeruli, which is expected, as the total degree of sclerosis is variable within each pool of five glomeruli for each mass spectra profile. The intraindividual variability was assessed by using the Intraclass Correlation Coefficients and Variance Component Analysis. The mean intraindividual variability was ⬍30% of the overall variability (intra ⫹ inter). These results indicate low intraindividual variability and further validate our results.
Glomerular Proteomic Pattern Comparisons A total of 1473 distinct peaks across all of the spectra were obtained. However, all of these peaks may not be significant, as some of the peaks were expressed in only a few spectra. A total of 251 significantly differentially expressed protein signals were selected for the comparisons. Among these 251 protein markers, 154 protein markers were expressed only in one group, 93 protein markers were expressed in two groups, and four protein markers were expressed in all three groups. Using the WFCCM statistical analysis, we were able to classify the normal and sclerotic glomeruli proteomic pattern with 99.2 and 98.3% accuracy according to the top 102 differentially expressed MS signals using the leave-one-out and 10-fold crossed validation classification, respectively. Similarly, 96.7 and 86.7% classification accuracy was obtained for the comparison of normal glomeruli versus nonsclerotic glomeruli according to the top 166 differentially expressed MS signals using the leave-one-out and 10-fold crossed validation classification, respectively. We obtained 97.8 and 86.7% classification accuracy for nonsclerotic glomeruli from sclerotic glomeruli according to the top 84 differentially expressed MS signals using the leave-one-out and 10-fold crossed validation classification, respectively (Table 1). The agglomerative hierarchical clustering algorithm was used to investigate the protein expression patterns among the significant differentially expressed proteins with Eisen’s software. The selected proteomic pattern distinguished all of the normal glomeruli from nonsclerotic glomeruli with 100% classification accuracy (Figure 3A). We obtained 99.2% classification accuracy in distinguishing normal versus sclerotic glomeruli (Figure 3B) and 92.2% classification accuracy for nonsclerotic glomeruli versus sclerotic glomeruli (Figure 3C). We also constructed a cluster dendrogram of all differentially regulated proteins and all of the samples displayed (Figure 3D). The normal (blue) and sclerotic (red) glomeruli are segregated at opposite ends of the dendrogram, whereas nonsclerotic (green) glomeruli are dispersed in the middle of the two groups, which further supports the classification power of the differentially expressed peaks. The overall proteomic patterns detected from the three different types of glomeruli were compared to investigate the protein expression similarity closeness among the three types of glomeruli. The proteomic patterns of nonsclerotic glomeruli were more similar to sclerotic than to normal glomeruli (P ⬍ 0.0001), suggesting that the phenotype of nonsclerotic glomeruli is pathophysiologically closer to the sclerotic than to the normal glomeruli.
J Am Soc Nephrol 16: 2967–2975, 2005
Proteomic Patterns and Prediction of Glomerulosclerosis
2971
Table 1. WFCCM was used to select the statistically significant peaks that allowed classification of the three groups of samples according to their proteomic patternsa Classification (Sample Size)
No. of Differentially Expressed Peaks
Leave-One-Out Classification Accuracy (%; No. of Misclassified Samples)
10-Fold Crossed Validation Classification Accuracy (%; No. of Misclassified Samples)
Probability of Random Permutations with Misclassifications
Normal glomeruli (60) versus sclerotic glomeruli (60) Nonsclerotic glomeruli (30) versus normal glomeruli (60) Nonsclerotic glomeruli (30) versus sclerotic glomeruli (60)
102
99.2 (1)
98.3 (2)
⬍0.0001
166
96.7 (3)
86.7 (12)
⬍0.0001
84
97.8 (2)
86.7 (12)
⬍0.0001
a The misclassification rate was calculated using the leave-one-out and 10-fold cross-validation class prediction methods. WFCCM, weighted flexible compound covariant method.
Identification of Thymosin 4 We next aimed to identify one of the protein markers that statistically contributed most to differential classification of our three groups of glomeruli. After tissue homogenization and HPLC separation steps, three fractions that contained the peak of m/z value 4963.8, one of the target proteins, were found using MALDI MS (Figure 4A). With LC-MS/MS analysis of the resulting tryptic peptides, thymosin 4 was identified as the target protein marker. Multiple MS/MS spectra were found to be consistent with the thymosin 4 tryptic peptides: [TETQEKNPLPSK]20-31, [KTETQEKNPLPSK]19-31, [TETQEKNPLPSKETIEQEK]20-38, and [KTETQEKNPLPSKETIEQEK]19-38. The SEQUEST cross-correlation scores for these sequences were 3.42, 3.89, 4.95, and 4.69, respectively, showing a strong correlation between the MS/MS spectra and the amino acid sequences. As an example, the MS/MS spectrum for [TETQEKNPLPSK]20-31 is shown in Figure 4B. These sequences composed 44% of the total amino acid sequence of thymosin 4. Considering the previously reported N-terminal acetylation (24), the theoretical average molecular weight for thymosin 4 is 4963.5 Da, in good agreement with the experimentally determined protein molecular weight. The signal intensities of thymosin 4 from the mass spectra for normal glomeruli, nonsclerotic glomeruli, and sclerotic glomeruli are shown in Figure 5. Thymosin 4 expression levels were increased approximately threefold in sclerotic versus normal glomeruli (P ⬍ 0.01) on the basis of the MS intensities and were intermediate in nonsclerotic glomeruli (P ⬍ 0.01). The MS intensity was not statistically different in nonsclerotic versus sclerotic glomeruli, further indicating their relatively closer proteomic relationship compared with normal.
Thymosin 4 Expression In Vivo and In Vitro Immunohistochemistry was performed to confirm the increased level of thymosin 4 in glomerulosclerosis. Thymosin 4 was increased in sclerotic glomeruli versus nonsclerotic or normal glomeruli (Figure 6). Furthermore, thymosin 4 was found predominantly expressed in endothelial cells identified by serial section staining with RECA-1, whereas mesangial cells stained with anti-rat Thy-1 did not show strong thymosin 4
staining. Podocytes, identified anatomically, and macrophages, doublestained with ED1, were negative for thymosin 4. Further analyses were performed in vitro to assess thymosin 4 expression in two different glomerular cell lines (Figure 7). Western blots from cultured GEN and podocyte cells confirmed endothelial expression of thymosin 4, with no protein detected in podocytes. GEN showed a strong immunoreactive band at 4.9 kD, corresponding to the expected molecular weight of thymosin 4. Mouse spleen and muscle, used as positive and negative controls of thymosin 4 immunohistochemistry and Western blot expression, showed expected results.
Thymosin 4 and Sclerosis Mechanisms
We next assessed whether modulation of thymosin 4 mRNA affected sclerotic responses. Ang II is a key profibrotic molecule, and its inhibition ameliorates progressive kidney diseases. Ang II promotes sclerosis by inducing hypertension, increasing extracellular matrix (ECM) synthesis, and also inhibiting ECM degradation. The last results in part is from Ang II induction of PAI-1 expression in vivo and in vitro (14,25). Furthermore, application of synthetic thymosin 4 increases PAI-1 expression in endothelial cells (26). We therefore assessed whether endogenous thymosin 4 affected PAI-1 expression in response to Ang II. We designed siRNA and control siRNA for thymosin 4 to induce gene knockdown in GEN, the cell type implicated as a contributor to increased thymosin 4 in our studies. Thymosin 4 protein expression was knocked down successfully by approximately 90% using siRNA. We next assessed the effect of this downregulated thymosin 4 on the Ang II–induced prosclerotic response by assessing expression of PAI-1 in these cells. Neither siRNA nor control siRNA affected baseline PAI-1 expression. Angiotensin II (10⫺6 M) increased thymosin 4 over baseline and concurrently dramatically upregulated PAI-1 expression in normal GEN. Transfection with siRNA for thymosin 4 significantly decreased the Ang II– induced PAI-1 expression. The scrambled control siRNA had no effect on thymosin 4 expression or on Ang II–induced PAI-1 expression (Figure 8). These data indicate that thymosin 4 is a modulator of Ang II–induced PAI-1 expression and thus can have an impact on sclerosis.
2972
Journal of the American Society of Nephrology
J Am Soc Nephrol 16: 2967–2975, 2005
Figure 4. Identification of thymosin 4 as a marker for sclerosis. (A) The matrix-assisted laser desorption/ionization mass spectrum of an HPLC fraction that contains the target peak at 4963.76 m/z. (B) The MS/MS spectrum consistent with one of thymosin 4’s tryptic peptides, [TETQEKNPLPSK]20-31.
Figure 3. Hierarchical cluster analysis of three different groups of glomeruli on the basis of the top differentially expressed protein patterns. Each column represents an individual sample, and each row represents an individual proteomic signal. The dendrogram at the top shows the similarity in protein expression profiles of the samples. Substantially raised expression of the proteins is represented in red. (A) Classification of 60 normal glomeruli and 60 sclerotic glomeruli according to proteomic patterns of 102 distinct MS signals. (B) Classification of 30 nonsclerotic glomeruli and 60 normal glomeruli according to proteomic patterns of 166 distinct MS signals. (C) Classification of 30 nonsclerotic glomeruli and 60 sclerotic glomeruli according to proteomic patterns of 84 distinct MS signals. (D) Classification of all samples according to all differentially regulated proteins. The normal (blue) and sclerotic (red) glomeruli are segregated at opposite ends of the dendrogram, whereas nonsclerotic (green) glomeruli are dispersed in the middle.
Discussion Our results show that LCM and MALDI-TOF MS can classify accurately the proteomic profiles of normal versus nonsclerotic versus sclerotic glomeruli. Using proteomic pattern similarity comparisons, we found nonsclerotic glomeruli from the rem-
Figure 5. Thymosin 4 intensity levels based on MS signal intensities in the three different glomerular groups. Statistical significance of the differences was determined for normal versus nonsclerotic glomeruli (P ⬍ 0.01), normal versus sclerotic glomeruli (P ⬍ 0.01), and nonsclerotic versus sclerotic glomeruli (P ⬎ 0.05) comparisons. The error bars correspond to 95% confidence intervals.
nant kidney to have more similarities to sclerotic glomeruli than to normal glomeruli. Thymosin 4 was identified as one of the key differentially expressed protein markers upregulated both in nonsclerotic and in sclerotic glomeruli in the 5/6 Nx model. Immunohistochemistry confirmed elevated expression levels of thymosin 4 in sclerotic glomeruli that localized particularly to endothelial cells. Using RNAi technology, we determined that thymosin 4 regulates a key pathway in sclerosis, namely Ang II–induced PAI-1 expression. Normal and sclerotic glomeruli represent the two extremes in the evolution of glomerulosclerosis. In this study, we con-
J Am Soc Nephrol 16: 2967–2975, 2005
Proteomic Patterns and Prediction of Glomerulosclerosis
2973
Figure 6. Thymosin 4 (brown) was not detectable in normal glomeruli (left) but was increased in sclerotic glomeruli (middle). Staining was not present in macrophages (anti-thymosin 4, brown; ED1, red). Staining on a serial section (right) with endothelial (RECA-1, brown) and mesangial (Thy-1, red) markers confirmed predominantly endothelial localization (anti– RECA-1, brown; anti–Thy-1, red). Magnification, ⫻200.
Figure 7. Western blot of thymosin 4 expression in cultured glomerular endothelial cells (GEN) and podocytes. Mouse muscle and spleen tissues were used as negative and positive controls, respectively.
firmed, as expected, that proteomic patterns for normal and sclerotic glomeruli are markedly different. Although our study found perfect or near-perfect predictors of sclerosis, there are some statistical limitations that need be addressed. First, because the study sample size is relatively small, a larger-scale study is necessary to confirm our findings. In addition, the number of features reported in this article is not based on the smallest number of features that could discriminate the classes but based on the statistical evidence; thus, there is the possibility of achieving similar misclassification rates based on different subsets of peaks. In addition, the near-perfect discrimination obtained using the agglomerative hierarchical clustering is not surprising as it uses covariates that were themselves chosen to have maximal discriminating power. It is ideal to evaluate the marker set in a different sample, the test set, and then to determine the sensitivity and the specificity of the marker set in an independent population. In our study, because the same sample cohort was used to test the selected protein markers, overestimation of the prediction accuracy is possible. Therefore, the major limitation of this study is that the results were not tested on a test cohort. The observation units used in this study are individual protein
Figure 8. (Top) Representative Western blot of replicate experiments of thymosin 4 and angiotensin II (Ang II)-induced plasminogen activator inhibitor-1 (PAI-1). GEN were stimulated with Ang II (10⫺6 M) for 24 h, with or without concomitant transfection with siRNA or control siRNA for thymosin 4. Normal GEN at baseline expressed thymosin 4 (lane 1), which was knocked down successfully approximately 90% using siRNA (lanes 2 and 5 versus lane 3). Neither siRNA nor control siRNA affected baseline PAI-1 expression (lane 1 versus lanes 2 and 3). Ang II dramatically upregulated PAI-1 in normal GEN (lane 4). Transfection with siRNA markedly dampened this Ang II induction of PAI-1 (lane 5). Control siRNA had no effect (lane 6). (Bottom) Average PAI-1 protein expression of replicate Western blot experiments, normalized to -actin.
profiles from five glomeruli tissue sections. The observation unit in our study was initially defined by combining the samples from each animal to one data point. We obtained perfect classifications quickly with this approach. However, because the animal numbers for these kinds of classifications were relatively small (six normal rats, five nonsclerotic rats, and six sclerotic rats), we chose each individual protein profile as an observation unit. Because of limitations of the MS technology, tissue from five glomerular sections was the minimum amount of sample that allowed us to obtain abundant protein signaling using MALDI mass spectrometer. Therefore, five glomerular sections were chosen as an observation unit to improve the statistical classification accuracy reliability and to be in accordance with the sensitivity limitation of the instrument. Of interest is our finding that nonsclerotic glomeruli in the setting of progressive renal scarring also have an altered proteomic profile that is more closely related to sclerotic than normal glomeruli. Nonsclerotic glomeruli are recognized to have struc-
2974
Journal of the American Society of Nephrology
tural alterations, such as foot process effacement. Foot process effacement occurs in all glomeruli in FSGS, regardless of whether sclerosis is present in a specific glomerulus or not. Thus, podocyterelated molecules would be expected to be altered in both nonsclerotic and sclerotic glomeruli compared with normal baseline. It is possible that such proteins, perhaps of higher molecular weights, not detected by our LCM and MALDI MS approach, would also be differentially upregulated in both nonsclerotic and sclerotic glomeruli versus normal. However, podocyte effacement per se does not correlate with progressive sclerosis. In human disease, both FSGS and minimal-change disease (MCD) are characterized by diffuse foot process effacement. However, sclerosis does not develop in MCD, and prognosis is excellent. In contrast, FSGS is characterized by initial podocyte injury that is followed by progressive scarring that involves induction of injury in all glomerular cell types, including mesangial and endothelial cells, culminating in sclerosis (1). In human renal biopsies that provide limited tissue sampling, it may be difficult to differentiate between MCD and FSGS if the defining segmental sclerotic lesion is not sampled. Differential downregulation of glomerular basement membrane ␣- and -dystroglycan by immunostaining in MCD but not FSGS has been proposed as a tool to distinguish these two entities (27). We hypothesize that increased thymosin 4 may be an additional marker that allows identification of early sclerotic processes. Our data further indicate that the nonsclerotic glomeruli in FSGS have activated prosclerotic mechanisms. These findings have important implications for therapy, suggesting that these nonsclerosed glomeruli are already more activated toward sclerosis than suggested by standard light microscopy and electron microscopy, and more targeted, aggressive therapy might be needed to effect remission or even regression of sclerosis (2). We postulate that identification of the differentially expressed protein markers in the early, prosclerotic stage of progression could advance our understanding of mechanisms of sclerosis and possibly suggest novel targets for therapies for progressive kidney diseases. Currently, using the inherently limited tissue left for protein extraction in the remnant kidney model, we identified thymosin 4 as one key differentially expressed molecule in sclerotic and nonsclerotic glomeruli versus baseline. Thymosin 4 is a highly conserved protein that has a wide range of functions. Thymosin 4 is an intracellular cytoplasmic or nuclear G-actin sequestering protein (28,29) and plays a role in wound healing, apoptosis, inflammatory responses, angiogenesis, and endothelial cell migration and differentiation (30). Extracellular thymosin 4 may also serve as a specific glutaminyl substrate of transglutaminases, which can cross-link it to fibrin, collagen, and actin (31). Thymosin 4 enhances repair in a mouse cardiac injury model by increasing Akt and enhancing survival of cardiac cells (32). These data suggest a multiplicity of functions for thymosin 4. Furthermore, thymosin 4 may have divergent effects depending on the type of initial injury and the organ involved, promoting repair in the infarcted heart and fibrosis in the chronically scarring kidney. Of relevance to sclerosis, exogenous thymosin 4 increases PAI-1 expression at both the mRNA and protein levels in endothelial cells (26). PAI-1 inhibits tissue-type plasminogen activator and urokinase-type plasminogen activator, preventing the activation of plasminogen to plasmin. Plasmin degrades
J Am Soc Nephrol 16: 2967–2975, 2005
not only fibrin but also ECM (33). PAI-1 also inhibits urokinasetype plasminogen activator–induced matrix metalloprotease-2 activation, thus further inhibiting ECM degradation. PAI-1 is induced by angiotensin II in vivo and in vitro and is tightly linked to glomerulosclerosis (34). Conversely, PAI-1 downregulation is linked to amelioration or even regression of glomerulosclerosis (2). Therefore, upregulation of thymosin 4 could promote sclerosis via upregulation of PAI-1. To explore further the role of thymosin 4 in this sclerotic pathway, we modulated its endogenous expression in cultured endothelial cells. Our results show that downregulation of thymosin 4 by RNAi did not alter baseline PAI-1 expression in endothelial cells. In contrast, knockdown of endogenous thymosin 4 prevented Ang II–induced PAI-1 expression. Previous data have shown that Ang induces PAI-1 upregulation via c-Fos/c-Jun binding to Sp1 and activated protein-1 sequences in the PAI-1 promoter (35). Of note, thymosin 4 enhances c-Fos/c-Jun DNA-binding activity to the activated protein 1 element (26). These findings imply that Ang actions may be mediated in part via thymosin 4 activation of this signaling pathway. In the setting of chronic progressive kidney disease, our data indicate that thymosin 4, via effects on PAI-1, is not only a marker but also potentially a contributor to glomerulosclerosis. Thus, thymosin 4 could be a novel target for treatment of glomerulosclerosis. In conclusion, using LCM combined with MALDI MS technology, we obtained specific proteomic patterns that accurately classified normal versus nonsclerotic or sclerotic glomeruli in FSGS. The proteomic pattern of nonsclerotic glomeruli in a fibrosing kidney was found to be more similar to the proteomic pattern of sclerotic glomeruli than to normal glomeruli, suggesting that these nonsclerotic glomeruli have early activation of prosclerotic mechanisms. As a discovery tool, our proteomic study further found thymosin 4 to be a key protein marker of glomerulosclerosis and possibly even a contributor to progression by promoting Ang-induced PAI-1 expression.
Acknowledgments This work was supported by National Institutes of Health Grants DK 56942, DK 44757, HL 67308, and GM 58008; the Vanderbilt-Ingram Cancer Center; and the Robert J. and Helen C. Kleberg Foundation. We thank Pamela Adams and Dr. Pierre Chaurand for excellent technical assistance.
References 1. Fogo A, Hawkins EP, Berry PL, Glick AD, Chiang ML, MacDonell RC Jr, Ichikawa I: Glomerular hypertrophy in minimal change disease predicts subsequent progression to focal glomerular sclerosis. Kidney Int 38: 115–123, 1990 2. Fogo AB: Glomerular hypertension, abnormal glomerular growth, and progression of renal diseases. Kidney Int 75: S15–S21, 2000 3. Klein JB, Thongboonkerd V: Overview of proteomics. Contrib Nephrol 141: 1–10, 2004 4. Arthur JM: Proteomics. Curr Opin Nephrol Hypertens 12: 423– 430, 2003 5. Xu BJ, Caprioli RM, Sanders ME, Jensen RA: Direct anal-
J Am Soc Nephrol 16: 2967–2975, 2005
6.
7.
8.
9.
10.
11.
12.
13.
14.
15.
16.
17.
18.
19. 20.
ysis of laser capture microdissected cells by MALDI mass spectrometry. J Am Soc Mass Spectrom 13: 1292–1297, 2002 Palmer-Toy DE, Sarracino DA, Sgroi D, LeVangie R, Leopold PE: Direct acquisition of matrix-assisted laser desorption/ ionization time-of-flight mass spectra from laser capture microdissected tissues. Clin Chem 46: 1513–1516, 2000 Emmert-Buck MR, Bonner RF, Smith PD, Chuaqui RF, Zhang Z, Goldstein SR, Weiss RA, Liotta LA: Laser capture microdissection. Science 274: 998 –1001, 1996 Chaurand P, Fouchecourt S, DaGue BB, Xu BJ, Reyzer ML, Orgebin-Crist M-C, Caprioli RM: Profiling and imaging proteins in the mouse epididymis by imaging mass spectrometry. Proteomics 3: 2221–2239, 2003 Bhattacharya SH, Gal AA, Murray KK: Laser capture microdissection MALDI for direct analysis of archival tissue. J Proteome Res 2: 95–98, 2003 Ikoma M, Kawamura T, Kakinuma Y, Fogo A, Ichikawa I: Cause of variable therapeutic efficiency of angiotensin converting enzyme inhibitor on glomerular lesions. Kidney Int 40: 195–202, 1991 Eng JK, McCormack AL, Yates JR III: An approach to correlate tandem mass spectral data of peptides with amino acid sequences in a protein database. J Am Soc Mass Spectrom 5: 976 –989, 1994 Mora CA, Baumann CA, Paino JE, Goldstein AL, Badamchian M: Biodistribution of synthetic thymosin beta4 in the serum, urine, and major organs of mice. Int J Immunopharmacol 19: 1– 8, 1997 Akis N, Madaio MP: Isolation, culture, and characterization of endothelial cells from mouse glomeruli. Kidney Int 65: 2223–2227, 2004 Kerins DM, Hao Q, Vaughan DE: Angiotensin induction of PAI-1 expression in endothelial cells is mediated by the hexapeptide angiotensin IV. J Clin Invest 96: 2515–2520, 1995 Tusher VG, Tibshirani R, Chu G: Significance analysis of microarrays applied to the ionizing radiation response. Proc Natl Acad Sci U S A 98: 5116 –5121, 2001 Hedenfalk I, Duggan D, Chen Y, Radmacher M, Bittner M, Simon R, Meltzer P, Gusterson B, Esteller M, Kallioniemi OP, Wilfond B, Borg A, Trent J: Gene-expression profiles in hereditary breast cancer. N Engl J Med 344: 539 –548, 2001 Kaminiski N, Friedman N: Practical approaches to analyzing results of microarray experiments. Am J Respir Cell Mol Biol 27: 125–132, 2002 Ben-Dor A, Friedman N, Yakhini Z: Scoring Genes for Relevance, Technical Report AGL-2000-13, Palo Alto, Agilent Labs, Agilent Technologies, 2000. http://www.labs.agilent.com/ resources/techreports.html. Accessed 2003. Tukey JW: Tightening the clinical trial. Control Clin Trials 14: 266 –285, 1993 Shyr Y, Kim K: Weighted flexible compound covariate method for classifying microarray data. In: Practical Approach to Microarray Data Analysis, edited by Berrar D, Dubitzky W, Granzow M, Norwall (Mass), Kluwer Academic Publishers, 2003, pp 186 –200
Proteomic Patterns and Prediction of Glomerulosclerosis
2975
21. Yamagata N, Shyr Y, Yanagisawa K, Edgerton M, Dang TP, Gonzalez A, Nadaf S, Larsen P, Roberts JR, Nesbitt JC, Jensen R, Levy S, Moore JH, Minna JD, Carbone DP: A trainingtesting approach to the molecular classification of resected non-small cell lung cancer. Clin Cancer Res 9: 4695– 4704, 2003 22. Yanagisawa K, Shyr Y, Xu BJ, Massion PP, Larsen PH, White BC, Roberts JR, Edgerton M, Gonzalez A, Nadaf S, Moore JH, Caprioli RM, Carbone DP: Proteomic patterns of tumour subsets in non-small-cell lung cancer. Lancet 362: 433–439, 2003 23. Eisen MB, Spellman PT, Brown PO, Botstein D: Cluster analysis and display of genome-wide expression patterns. Proc Natl Acad Sci U S A 95: 14863–14868, 1998 24. Stoeckli M, Chaurand P, Hallahan DE, Caprioli RM: Imaging mass spectrometry: A new technology for the analysis of protein expression in mammalian tissues. Nat Med 7: 493–496, 2001 25. Ma L-J, Nakamura S, Whitsitt JS, Marcantoni C, Davidson JM, Fogo AB: Regression of sclerosis in aging by an angiotensin inhibition-induced decrease in PAI-1. Kidney Int 58: 2425–2436, 2000 26. Al-Nedawi KNI, Czyz M, Bednarek R, Szemraj J, Swiatkowska M, Cierniewska-Cieslak A, Wyczolkowska J, Cierniewski CS: Thymosin beta4 induces the synthesis of plasminogen activator inhibitor 1 in cultured endothelial cells and increases its extracellular expression. Blood 103: 1319 –1324, 2004 27. Good KS, O’Brien K, Schulman G, Kerjaschki D, Fogo AB: Unexplained nephrotic-range proteinuria in a 38-year-old man: A case of “no change disease.” Am J Kidney Dis 43: 933–938, 2004 28. Safer D, Golla R, Nachmias VT: Isolation of a 5-kilodalton actin-sequestering peptide from human blood platelets. Proc Natl Acad Sci U S A 87: 2536 –2540, 1990 29. Huff T, Rosorius O, Otto AM, Mueller CSG, Ballweber E, Hannappel E, Mannherz HG: Nuclear localisation of the G-actin sequestering peptide thymosin b4. J Cell Sci 117: 5333–5343, 2004 30. Grant DS, Rose W, Yaen C, Goldstein A, Martinez J, Kleinman H: Thymosin beta4 enhances endothelial cell differentiation and angiogenesis. Angiogenesis 3: 125–135, 1999 31. Huff T, Otto AM, Mueller CSG, Meier M, Hannappel E: Thymosin beta4 is released from human blood platelets and attached by factor XIIIa (transglutaminase) to fibrin and collagen. FASEB J 16: 691– 696, 2002 32. Bock-Marquette I, Saxena A, White MD, Dimaio JM, Srivastava D: Thymosin beta4 activates integrin-linked kinase and promotes cardiac cell migration, survival and cardiac repair. Nature 432: 466 – 472, 2004 33. Eddy AA: Plasminogen activator inhibitor-1 and the kidney. Am J Physiol 283: F209 –F220, 2002 34. Ma L-J, Fogo AB: Role of angiotensin II in glomerular injury. Semin Nephrol 21: 544 –553, 2001 35. Chen H-C, Feener EP: MEK1,2 response element mediates angiotensin II-stimulated plasminogen activator inhibitor-1 promoter activation. Blood 103: 2636 –2644, 2004
See related editorial, “Role of Podocytes in Focal Sclerosis: Defining the Point of No Return,” on pages 2830 –2832.