Proteomic Profiling of Cholangiocarcinoma: Diagnostic Potential of SELDI-TOF MS in Malignant Bile Duct Stricture Christopher J. Scarlett,1 Alex J. Saxby,1 AiQun Nielsen,1 Cameron Bell,2 Jaswinder S. Samra,1 Thomas Hugh,1 Robert C. Baxter,3 and Ross C. Smith1 Proteomic techniques promise to improve the diagnosis of cholangiocarcinoma (CC) in both tissue and serum as histological diagnosis and existing serum markers exhibit poor sensitivities. We explored the use of surface-enhanced laser desorption/ionization time-of-flight mass spectrometry (SELDI-TOF MS) to identify potential protein biomarkers of CC. Twenty-two resected CC samples were compared with adjacent noninvolved bile duct tissue. Serum from patients with CC (n ⴝ 20) was compared with patients with benign disease (n ⴝ 20), and healthy volunteers (n ⴝ 25). Samples were analyzed on hydrophobic protein chips via SELDI-TOF MS, and classification models were developed using logistic regression and cross-validation analysis. Univariate analysis revealed 14 individual peaks differentially expressed between CC and bile duct tissue, 4 peaks between CC and benign disease, and 12 peaks between CC and sera of healthy volunteers. The 4,462 mass-to-charge serum peak had superior discriminatory ability to carbohydrate antigen 19.9 (CA19.9) and carcinoembryonic antigen (CEA) (P ⴝ .004; receiver operating characteristic [ROC] area under the curve [AUC] ⴝ 0.76, 0.73, and 0.70, respectively). The training models developed panels of peaks that distinguished CC from bile duct tissue (92.5% sensitivity, 92.3% specificity; ROC AUC ⴝ 0.96), CC from benign serum (65.0% sensitivity, 70.0% specificity; ROC AUC ⴝ 0.83), and CC from sera of healthy volunteers (75.0% sensitivity, 100% specificity; ROC AUC ⴝ 0.92). Serum results were further improved with the inclusion of CA19.9 and CEA (ROC AUC ⴝ 0.86 and 0.99 for CC vs benign and healthy volunteer serum, respectively). In conclusion, biomarker panels are capable of distinguishing CC from nonmalignant tissue; serum markers have important diagnostic implications for unknown bile duct stricture. (HEPATOLOGY 2006;44:658-666.)
C
holangiocarcinoma (CC) is a rare but devastating neoplasm that accounts for 3% of all gastrointestinal cancers and 15% of all primary liver cancers worldwide.1 Five thousand new cases are diagnosed on Abbreviations: CC, cholangiocarcinoma; SELDI, surface-enhanced laser desorption/ ionization; TOF-MS, time-of-flight mass spectrometry; CA19.9, carbohydrate antigen 19.9; CEA, carcinoembryonic antigen; ROC, receiver operating characteristic; AUC, area under the curve; m/z, mass-to-charge ratio; CV, coefficient of variation. From the Departments of 1Surgery and 2Gastroenterology and the 3Kolling Institute of Medical Research, University of Sydney, Royal North Shore Hospital, St. Leonards, New South Wales, Australia. Received December 6, 2005; accepted June 3, 2006. Supported by the Cure Cancer Australia Foundation and the Cancer Surgery Research Foundation (CanSur). Christopher J. Scarlett is the recipient of a University of Sydney Postgraduate Award and is a Cancer Institute NSW Scholar. Christopher J. Scarlett and Alex J. Saxby contributed equally to this study. Address reprint requests to: Ross C. Smith, University of Sydney, Department of Surgery, Royal North Shore Hospital, St Leonards, NSW, 2065, Australia. E-mail:
[email protected]; fax: (61) 2-9437-3522. Copyright © 2006 by the American Association for the Study of Liver Diseases. Published online in Wiley InterScience (www.interscience.wiley.com). DOI 10.1002/hep.21294 Potential conflict of interest: Dr. Baxter advises Tissue Therapies Pty Limited. Dr. Smith is chairman of, and received funding from, CanSur Pty Limited. He is also chairman of Mictocatheters Pty Limited. 658
average per year in the United States, and the incidence is rising.2 Northeast Thailand sees the highest incidence, with 96 cases per 100,000.1 Surgical resection is the only current chance of cure, with no proven adjunctive therapy; however, this approach has a mortality rate of 5% to 10%.3 Even with margin-free resection, 5-year survival figures only reach 20% to 40%.3,4 Unresectable disease is usually fatal within 6 months to 1 year, and over one third of patients present at a stage too late for resection.3 This confirms the need for earlier and more accurate diagnostic processes. At present, diagnosis of CC relies on imaging of the biliary tree with computed tomography or ultrasonography in the presence of high clinical suspicion. Tissue diagnostic confirmation is possible for intrahepatic tumors but is very difficult in more distal and more common (2/3 of cases) extrahepatic cases. These frequently present as a stricture of the common bile duct, which can be further characterized by means of endoscopic retrograde cholangio-pancreatography.5 Using this technique, tissue diagnosis can be made via brush cytology and intraductal
HEPATOLOGY, Vol. 44, No. 3, 2006
biopsies, but these procedures have poor sensitivities (⬇50%) due to the high desmoplastic nature of the neoplasm.4,5 Consequently, clinicians often seek other methods of confirming diagnoses, and serum tumor markers provide valuable additional clues to the malignant nature of such strictures. Established serum tumor markers associated with CC include carbohydrate antigen 19.9 (CA19.9) and carcinoembryonic antigen (CEA); however, these markers are not always helpful, with sensitivities of approximately 70% and 50%, respectively.6 Consequently, there is a need for new markers of the disease. Proteomic profiling of serum has been used with a number of other malignancies to discover potential biomarkers.7,8 In particular, affinity-based arrays—such as the protein chips analyzed via surface-enhanced laser desorption/ionization time-offlight mass spectrometry (SELDI-TOF MS) used in this study— have been used to successfully identify malignant patterns in serum from ovarian,9-11 pancreatic,12-14 head and neck,15,16 prostate,17 transitional cell,18 renal cell,19,20 and breast21 cancers. TOF-MS separates ions derived from proteins or protein fragments that are differentially detected according to their mass-to-charge ratio. The human proteome, which is an order of magnitude greater than its parent genome, is a rich source of potential biomarkers.8 SELDI-based proteomics has major advantages over more traditional methods such as gel electrophoresis, with low molecular weight resolution (down to 2,500 kd) and high sensitivity (in the femtomolar range) combined with a high throughput and the versatility to sample almost any body fluid or tissue.7 Subsequent comparison of spectra from malignant and nonmalignant samples enables both individually significant proteins as well as patterns of protein expression to be identified. We used protein chip technology coupled with SELDI-TOF MS to assess CC, in both tissue and serum, to determine if any potential individual biomarkers or biomarker panels could identify malignant cases.
Materials and Methods Sample Collection Tissue samples were collected at the time of surgical resection, with prior informed consent, as approved by the Northern Sydney Health Human Research Ethics Committee. Resected tissues were immediately taken to a pathologist, who sampled both the tumor itself and adjacent normal-appearing bile duct. Both samples were then snap-frozen in liquid nitrogen within 10 minutes of removal from the patient and stored at ⫺80°C. Twentytwo CC samples were collected, 13 of which had additional adjacent normal bile duct samples. The remaining 9 cases did not have adjacent bile duct samples
SCARLETT ET AL.
659
Table 1. Patients’ Clinicopathological Data for Bile Duct Tumor Tissue and Serum Samples n (Mean Age; Range)
Bile duct tissue samples Male Female Cholangiocarcinomas Extrahepatic Intrahepatic Klatskin UICC stage Stage II Stage III Stage IV Adjacent bile duct tissue Serum samples Male Female Cholangiocarcinoma Stage II Stage IV Benign biliary disease Cholelithiasis Benign fibrous stricture Primary sclerosing cholangitis Healthy volunteers
22 (65.9; 36-84) 14 8 22 (65.9; 36-84 ) 10 5 7 6 1 15 13 65 37 28 20 3 17 20 16 3 1 25
(67.3; 36-84) (63.1; 32-89)
(67.2; 36-89)
(66.5; 33-85)
(57.3; 32-85)
Abbreviation: UICC, Union Internationale Contre le Cancer.
due to insufficient, visually normal bile duct in the resected sample. Table 1 shows the patients’ clinicopathological details. The histological diagnoses of the CCs were Klatskin tumors (n ⫽ 7), intrahepatic CCs (n ⫽ 5), and extrahepatic CCs (n ⫽ 10). The 22 CC samples were classified into pathological stages according to the Union Internationale Contre le Cancer tumor node metastasis classification of staging. They comprised 6 early-stage (stage II) and 16 late-stage (stage III, n ⫽ 1; stage IV, n ⫽ 15) samples.22 Serum samples were collected from 10 of the surgical cases (stage II, n ⫽ 3; stage IV, n ⫽ 7) and additionally from 10 patients undergoing endoscopic retrograde cholangio-pancreatography (stage IV, n ⫽ 10), via simple venipuncture, prior to their procedure. A control group consisted of 20 patients with jaundice undergoing endoscopic retrograde cholangio-pancreatography for a benign biliary condition (cholelithiasis, n ⫽ 16; benign fibrous stricture, n ⫽ 3; primary sclerosing cholangitis, n ⫽ 1). A second control group comprised serum from 25 healthy volunteers who had had no general practitioner visit or hospital admission for 6 months and no history of cancer (Table 1). All serum samples were analyzed via SELDI-TOF MS and also underwent biochemistry tests to measure the amounts of total protein and albumin, as well as liver function tests, including alkaline phosphatase, aspartate aminotransferase, alanine aminotransferase, ␥-glutamyl-
660
SCARLETT ET AL.
transpeptidase, bilirubin, lipase, C-reactive protein, and the tumor markers CA19.9 and CEA. Preparation of Samples for SELDI-TOF MS Analysis Tissue Preparation. Approximately 50 mg of tissue (CC or adjacent bile duct) was prepared for analysis using SELDI-TOF MS as previously described.23 Briefly, the tissue was solubilized via pestle homogenization in 0.5 mL of lysis buffer (9.5 mol/L urea/2% CHAPS/1% DTT) then added to a QiaShredder spin column (Qiagen, Hilden, Germany) and centrifuged (12,000 rpm for 5 min) to remove insoluble material. The tissue homogenate was further diluted 1:5 with 10% acetonitrile/0.1% trifluoroacetic acid and applied to the hydrophobic protein chip array surface (ProteinChip; Ciphergen Biosystems, Fremont, CA) as described below. Serum Preparation. Serum was diluted 1:1 with denaturing buffer (8 mol/L urea/1% CHAPS, vortexed for 1 minute, then placed on ice for 10 minutes. Following centrifugation (12,000 rpm for 5 min), the supernatant was further diluted 1:10 with binding buffer (10% acetonitrile/0.1% TFA). This solution was then added to the hydrophobic protein chip array surface as described in the next paragraph. Protein Chip Preparation. Hydrophobic protein chip arrays were pre-equilibrated with binding buffer (50% acetonitrile/0.5% TFA) for 30 minutes at room temperature in a humidified chamber. The binding buffer was then wicked off and 5 L of sample (either tissue or serum as prepared above) was added to each spot. The arrays were then incubated in a humidified chamber at room temperature for 45 minutes, washed 3 times in binding buffer for 5 minutes each time, rinsed twice in Milli-Q water, and allowed to air-dry. Each spot was treated with 1 L of sinapinic acid (sinapinic acid, 50% saturated in 50% acetonitrile/0.5% TFA), and allowed to air dry, and the process was repeated. The protein chip arrays were then analyzed using the Ciphergen Protein Biological System IIc ProteinChip Reader (Ciphergen Biosystems) as previously described.23 SELDI-TOF MS Analysis Mass spectra were generated for each sample in the mass/charge (m/z) range of 2,500-50,000 with a laser intensity setting of 208-218 (arbitrary units). The laser was optimized for data collection between 3,000 and 30,000 m/z, with detector sensitivity set at 7-8; peaks ⬍1,000 m/z were deflected away from the detector. Data were averaged from 65 spectra evenly distributed across each spot. Each sample from a single patient was run in duplicate, and the mean values from these two spectra were used in
HEPATOLOGY, September 2006
any subsequent analyses. The m/z value for each of the peaks was determined using external calibration with known standards (Sigma, St. Louis, MO): bovine insulin (5,734.51 ⫹1H), equine cytochrome c (12,361.96 ⫹1H), equine apomyoglobin (16,952.27 ⫹1H), and rabbit muscle aldolase (39,212.28 ⫹1H). All spectra were analyzed using Ciphergen ProteinChip Software Version 3.1 (Ciphergen Biosystems). Following calibration, spectra were baseline-subtracted and normalized using the total ion current between 2,500 and 50,000 m/z. Peak detection was performed using Biomarker Wizard Version 3.1 (Ciphergen Biosystems) conforming to the following parameters: signal/noise ratio ⬎5; present in ⬎20% of spectra; mass range 0.3%. Statistical Analysis Univariate analysis of individual peaks was performed using the nonparametric Mann-Whitney U test; a P value ⬍.05 was considered statistically significant. The discriminatory power for each putative marker was further described via receiver operating characteristic (ROC) area under the curve (AUC) analysis using SPSS Version 12.0 software (SPSS Inc., Chicago, IL). Multivariate Analysis. As with our previous study,23 training models were developed using multivariate binary logistic regression to determine which peaks were able to best predict CC tissue from adjacent bile duct tissue, or serum from patients with CC versus benign disease or from a cohort of healthy volunteers. For each analysis, the models were validated using the 10-fold cross-validation approach as described by Ambroise and McLachlan.24 This repeated random sampling procedure allows for the use of all samples within the data set to be tested as well as for the correction of any selection bias. Briefly, the 10-fold cross-validation approach divides the entire randomized data set into 10 nonoverlapping data sets of roughly equal size. The model is trained on 9 of these subsets and then tested on the remaining subset to obtain prediction values. This process is repeated in turn for each of the remaining subsets, and as such, each subset in the model is tested on an independent sample that was not included in the development of the training model. This enables the calculation of unbiased estimates of sensitivity and specificity, overall accuracy, and ROC AUC values of the candidate tumor biomarker panels. Ambroise and McLachlan24 emphasize that to obtain an unbiased estimate, it is important to avoid selection bias—that is, it is important to allow the cross-validation of the prediction rule to be external to the selection process. Consequently, different peaks may be selected in each training model, thereby accommodating the selection bias. This is a direct consequence of the test set playing no part in the selection
HEPATOLOGY, Vol. 44, No. 3, 2006
SCARLETT ET AL.
661
of the peaks. To assess whether the data within the logistic model were a good fit, the Hosmer and Lemeshow Goodness of Fit test was applied (SPSS Version 13.0 software; SPSS Inc.). This external cross-validation approach ensures that for each subset the test samples were not included in the development of the training models. Reproducibility The coefficient of variation (CV) for peak intensity and mass accuracy was calculated between different protein chips (inter-assay/chip to chip CV) using a serum pool as a quality control sample on every chip used in the experiment. CVs were calculated for a selection of peaks across the repeated spectra and displayed as an overall mean. Peaks were auto-detected using Biomarker Wizard (Ciphergen Biosystems) set to a signal/noise ratio ⬎5 and present in 100% of spectra. A similar protocol was used to assess intra-assay (spot-to-spot) reproducibility by analyzing pooled quality control serum on multiple spots of the same protein chip. In this study, the intra-assay (spot-tospot) CV was 13.5% for peak intensity and 0.08% for mass accuracy. The inter-assay (chip-to-chip) CV was 27.5% for peak intensity and 0.15% for mass accuracy.
Results Tissue Group Within the mass region analyzed (2,500 to 20,000 m/z), 29 individual protein peaks were identified common to CC and adjacent bile duct. Nonparametric univariate analysis of these peaks revealed that 14 were differentially expressed (P ⬍ .05): 4 were upregulated (m/z 9,760, 10,096, 10,311, and 11,664) and 10 were downregulated (m/z 5,078, 5,734, 5,933, 6,105, 6,632, 7,939, 8,468, 8,691, 8,905, and 16,089) in the cancer subgroup. The single most significant peak with highest discriminatory power was at m/z 10,311 and was upregulated in the cancer group (P ⬍ .001; ROC AUC 0.89) (Fig. 1A). Biomarker Panels. Development of training set. A 10-fold cross-validation approach was applied to the multivariate logistic regression analysis of the protein peaks that were differentially expressed using univariate analysis. This resulted in a reduced panel of peaks that were best able to distinguish CC tissue from adjacent bile duct tissue with an improved sensitivity, specificity, overall accuracy, and ROC AUC value compared with the most discriminatory individual marker (m/z 10,311). These training models correctly classified a mean of 90.0% of CC tissue and 85.3% of adjacent bile duct tissue samples (Table 2). The Hosmer and Lemeshow Goodness of Fit
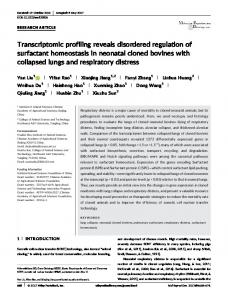
Fig. 1. ROC curves for the performance of the most discriminating univariate biomarker and the multivariate candidate biomarker panels (derived from 10-fold cross-validation) to discriminate CC from adjacent bile duct tissue, and from serum from patients with benign disease or healthy volunteers. (A) CC versus BD tissue. AUC values ⫽ 0.89 for the m/z 10,311 peak (solid line) and 0.96 for the 3-peak biomarker panel (dashed line). (B) CC versus benign serum. AUC values ⫽ 0.76 for the m/z 4,462 peak (solid line), 0.83 for the 2-peak biomarker panel (dashed line), and 0.86 for the panel including CEA (dotted line). (C) CC versus healthy volunteer serum. AUC values ⫽ 0.87 for the m/z 11,535 peak (solid line), 0.92 for the 3-peak biomarker panel (dashed line), and 0.99 for the panel including CEA and CA19.9 (dotted line). CC, cholangiocarcinoma; BD, bile duct; B, benign; HV, healthy volunteer.
test was applied to determine which regression step—and thus which protein peaks— best fit the logistic model. Classification of CC tissue. When the training model was tested, 81.8% of CC and 69.2% of adjacent bile duct tissue were correctly classified using a combination of 7
662
SCARLETT ET AL.
HEPATOLOGY, September 2006
Table 2. Logistic Regression and 10-fold Cross-Validation Using Only SELDI-Derived Peaks or SELDI-Derived Peaks ⴙ CEA ⴙ CA19.9 to Distinguish Cholangiocarcinoma From Adjacent Bile Duct Tissue, Cholangiocarcinoma From Benign Disease Serum, and Serum From Healthy Volunteers Cholangiocarcinoma Versus Adjacent Bile Duct Tissue
SELDI-derived peaks Sensitivity (%) Specificity (%) Overall accuracy (%) ROC AUC SELDI-derived peaks ⴙ CEA ⴙ CA19.9 Sensitivity (%) Specificity (%) Overall accuracy (%) ROC AUC
Cholangiocarcinoma Versus Benign Serum
Cholangiocarcinoma Versus Healthy Serum
Training
Test
Training
Test
Training
Test
90.0 (85.0-100) 85.3 (75.0-91.7) 90.2 (83.9-96.8) 0.92 (0.78-1.00)
81.8 69.2 77.1
63.0 (61.1-72.7) 83.3 (77.8-88.9) 73.0 (69.4-77.8) 0.83 (0.68-0.91)
65.0 75.0 70.0
75.9 (72.2-83.3) 94.1 (90.9-100) 87.2 (85.0-90.2) 0.91 (0.75–1.00)
75.0 92.0 84.4
ND ND ND ND
ND ND ND
75.9 (72.2-83.3) 77.8 (72.2-88.9) 77.2 (72.2-83.3) 0.86 (0.72-0.98)
70.0 80.0 75.0
90.7 (72.2-94.4) 95.6 (87.0-95.7) 91.1 (82.5-95.1) 0.95 (0.75-1.00)
70.0 88.0 80.0
NOTE. Data are expressed as the mean (range) of each of the 10 subsets within the 10-fold cross-validation approach. Abbreviation: ND, no data.
peaks. Sensitivity, specificity, overall accuracy, and ROC AUC values are shown in Table 2. The 8,468, 9,760, and 10,311 m/z peaks were selected in the majority of crossvalidation folds. The discriminatory power of this 3-peak putative biomarker panel was assessed and correctly classified in 95.5% (21/22) of CC tissue and 92.3% (12/13) of adjacent bile duct tissue (ROC AUC ⫽ 0.96) (Fig. 1A). Serum Group Comparison of General Serum Biochemistry. The benign group had liver function abnormalities that were similar to those of the CC group (Fig. 2), with no significant differences observed in the albumin or liver function test levels (including alkaline phosphatase, aspartate aminotransferase, alanine aminotransferase, ␥-glutamyltranspeptidase, and bilirubin). Bilirubin levels were
Fig. 2. Serum biochemistry results from CC (dark grey bars), benign (striped bars), and healthy volunteer (light grey bars) groups. Bars represent the mean for each group with error bars set to ⫾1 SE. Units are as follows: total protein (TP), g/L; albumin (Alb), g/L; alkaline phosphatase (ALP), U/L; aspartate aminotransferase (AST), U/L; alanine aminotransferase (ALT), U/L; ␥-glutamyltranspeptidase (GGT), U/L; bilirubin (BILI), mol/L; C-reactive protein (CRP), mg/L; lipase, U/L. Note that the difference in bilirubin levels between CC and benign groups are not statistically significant (P ⫽ .099).
elevated for both the benign and CC patients (mean ⫾ SD: 30.3 ⫾ 39.6 and 91.2 ⫾ 151.6 mol/L, respectively) when compared with the healthy volunteers (mean ⫾ SD: 11.9 ⫾ 6.8 mol/L). These patients had jaundice, and any differences observed in bilirubin levels between benign and CC groups were not significant (P ⫽ .099) (Fig. 3). Predictably, this was not true when comparing cancer or benign disease groups with the healthy volunteer group (Fig. 2). Statistically significant differences in bilirubin levels were seen in CC versus healthy volunteers (P ⬍ .001) and benign versus healthy volunteers (P ⫽ .027). CA19.9 was raised (⬎37.0 U/mL) in 11/20 cancer cases, 5/20 benign cases, and 2/25 healthy volunteers, yielding a sensitivity of 55% and a specificity of 84% for the overall group. CEA was elevated (⬎3.0 g/L) in 11/20 cancer cases, 2/20 benign cases, and 1/25 healthy volunteers, resulting in an overall sensitivity of 55% and an overall specificity of 93%. Differentially Expressed CC-Associated Serum Proteins. Protein chip technology coupled with SELDITOF MS demonstrated clear differences in expression of protein profiles between CC, benign biliary disease, and healthy volunteer serum using the hydrophobic protein chip array. An example from a segment of the protein mass profile between 4,000 and 7,000 m/z is shown in Fig. 3. Cancer Versus Benign Serum. Thirty-one individual peaks were found in the mass region explored (2,500 to 20,000 m/z), 4 of which were differentially expressed (m/z 4,462, 4,560, 5,382, 17,266; P ⬍ .05). Of these, 2 were upregulated and 2 were downregulated in the cancer subgroup when compared with benign disease serum. The most significant peak with the highest discriminatory power was at m/z 4,462 and was upregulated in the cancer group (P ⫽ .004; ROC AUC 0.76) (Fig. 1B). The ROC
HEPATOLOGY, Vol. 44, No. 3, 2006
Fig. 3. A segment of the protein mass profile between m/z 4,000 and 7,000 highlighting the differentially expressed peaks between serum from healthy volunteers, benign biliary disease, and CC patients. The pseudogel profile (bottom) is useful to compare peak intensity across multiple spectra. *The m/z 4,462 peak is upregulated in cancer patients when compared with benign patients and healthy volunteers.
AUC value for this peak was more discriminatory than either CA19.9 or CEA alone (ROC AUC 0.73 and 0.70, respectively). The 10-fold cross-validation/multivariate logistic regression approach was applied to CC versus benign serum samples in the same manner as the tissue analysis. The training model correctly classified 63.0% and 83.3% of CC and benign disease samples, respectively. When this model was tested, 65.0% of CC samples and 75% of benign samples were correctly classified using a combination of 4 peaks. Sensitivity, specificity, overall accuracy, and ROC AUC values are shown in Table 2. The peaks with m/z 4,462 and 5,382 were selected in every crossvalidation fold and were subsequently applied as a 2-peak biomarker panel. When the discriminatory power of this panel was assessed, 65.0% of CC (13/20) and 70.0% (14/20) of benign serum samples were correctly classified (ROC AUC ⫽ 0.83) (Fig. 1B). Addition of CA19.9 and CEA. The discriminatory power of this approach was further improved by including the tumor markers CA19.9 and CEA. In the training phase, 75.9% of CC samples and 77.8% of benign sam-
SCARLETT ET AL.
663
ples were correctly classified, while 70% and 80%, respectively, were correctly classified when tested. Sensitivity, specificity, overall accuracy, and ROC AUC values are shown in Table 2. When the final panel was assessed (CEA and m/z 4,462, 5,382), 75.0% (15/20) of CC and 75% (15/20) of benign serum samples were correctly classified (ROC AUC ⫽ 0.86) (Fig. 1B). Cancer Versus Healthy Volunteer Serum. Of the 31 peaks explored, 12 were differentially expressed between CC versus serum from a cohort of healthy volunteers (m/z 4,462, 4,560, 5,382, 5,660, 5,947, 6,433, 6,632, 6,841, 8,528, 8,691, 11,535, and 11,697). The most discriminatory peak was at m/z 11,535, which was upregulated in CC (P ⬍ .001; ROC AUC 0.87) (Fig. 1C). Within this group, CA19.9 was slightly more discriminatory (ROC AUC 0.90), whereas CEA was less so (ROC AUC 0.75). Again, the 10-fold cross-validation/multivariate logistic regression approach was applied to CC versus healthy volunteers. In this analysis, the training model correctly classified 75.9% and 94.1% of CC and healthy serum samples, respectively. Seventy-five percent of CC samples and 93.3% of healthy samples were correctly classified when this model was tested using combinations of a reduced panel of 8 peaks. Sensitivity, specificity, overall accuracy, and ROC AUC values are shown in Table 2. The peaks with m/z 4,560, 6,632, and 11,535 were selected as the 3-peak biomarker panel and, when assessed, 75.0% (15/20) of CC samples and 100.0% (25/25) of healthy serum samples were correctly classified (ROC AUC ⫽ 0.92) (Fig. 1C). As with the CC versus benign analysis, discriminatory power was further improved following the inclusion of CA19.9 and CEA into the model. The training model correctly classified 90.7% of CC and 95.6% of healthy samples, while 70.0% and 86.7%, respectively, were correctly classified when tested. Sensitivity, specificity, overall accuracy, and ROC AUC values are shown in Table 2. When the final panel was assessed (CEA, CA19.9, and m/z 11,535), 95.0% (19/20) of CC samples and 96.0% (24/25) of healthy serum samples were correctly classified (ROC AUC ⫽ 0.99) (Fig. 1C). Benign Versus Healthy Volunteer Serum. All aspects of liver function were abnormal in benign disease serum compared with healthy volunteers (Fig. 2). Several peaks (m/z 6,433, 6,632, 6,841, 11,535, and 11,697) were equally expressed in cancer and benign groups, though they were elevated when compared with healthy volunteer serum, which suggests an association of these peaks with biliary obstruction rather than malignancy per se.
664
SCARLETT ET AL.
Comparison Between Tissue and Serum Profiles Fourteen peaks were common to both the tissue and serum groups. Of these, 1 peak was significantly upregulated in both cancer subgroups: m/z 11,664 (P ⫽ .001 [tissue], P ⬍ .001 [serum]). Interestingly, the 10-fold cross-validation/multivariate logistic regression models did not pick either of these proteins for any of the putative biomarker panels used above.
Discussion This preliminary study demonstrates the ability of SELDI-TOF MS proteomic profiling to differentiate CC from nonmalignant tissue and serum and complements previous studies involving other cancer types.9-13,15-21,25 The most interesting discovery of the study was the finding that a SELDI-derived peak (m/z 4,462) was as effective at discriminating cancer from benign serum as the tumor markers CEA or CA19.9, while combining these three serum markers marginally improved classification. Classification could be further improved with data generated from a panel of peaks, suggesting analysis of proteomic profiles, rather than individual proteins, may yield improved diagnostic ability. The value of this technology is in its capacity to analyze large numbers of proteins rapidly to determine which ones may become potential biomarkers. The low molecular weight portion of the proteome, previously hidden by the limited resolution of 2-dimensional gel electrophoresis, appears to carry an abundance of tumor-specific information with the potential to improve both diagnosis and the understanding of tumor pathogenesis. Cholangiocarcinoma is generally thought to arise on a background of prolonged inflammatory events in the biliary tree. This inflammation may result from the presence of gallstones, choledochal cyst,26 a background of sclerosing cholangitis27 or following radiotherapy. In the process of malignant transformation, there is hyperplasia of the biliary mucosa progressing to dysplasia and early carcinoma lesions28 with subsequent changes in mucus production.29,30 The frequency of such lesions in patients without underlying pathology is less than 0.5%.29 The changes are considered to be sufficiently widespread that they can have an influence on the tissue proteome. Alterations in the serum protein profile would also seem likely as a result of both the malignant process itself and secondary to the inflammatory response including release of cytokines and acute phase proteins from the liver. It was therefore crucial to have a control group of patients who did not have cancer but who had a variety of biliary inflammatory processes with matched liver dysfunction. The ability to differentiate malignant cases from benign biliary disease is more clinically relevant than com-
HEPATOLOGY, September 2006
parison with the healthy volunteers. SELDI-TOF MS profiling of serum may prove most useful in the clinical scenario of a bile duct stricture where biopsy is either impossible or inconclusive. Whether malignant or benign, there will likely be some degree of biliary obstruction and impaired liver function. Therefore, comparison of CC serum profiles with those of inflammatory and obstructive biliary disease provided the closest approximation to the clinical setting. Further studies should also be directed at investigating the diagnostic power of SELDI-TOF MS profiling between different groups of patients with benign conditions such as primary sclerosing cholangitis. Contrasting these with healthy serum profiles provided a means of determining which peaks may be due to an inflammatory response rather than the malignant process itself. Albumin has been shown to be an important carrier of low molecular weight peptides31 and could potentially influence protein abundance. The relative hypoalbuminemia in the cancer and benign disease serum compared with healthy volunteer serum may be one explanation for some of the downregulated peaks observed. The serum levels of CA19.9 and CEA within the study group, used diagnostically, gave sensitivities and specificities in good agreement with the literature. Their use in CC was recently evaluated by Nehls et al.,6 who reviewed 11 studies with over 1,200 patients resulting in an average sensitivity of 71% and 51% and an average specificity of 78% and 88% for CA19.9 and CEA, respectively. The superior discriminatory power of CEA is noted both in this study and in the literature. An important finding of this study is that the single protein peak m/z 4,462 was more discriminatory than CEA or CA19.9. Further characterization of this peak is currently underway. The formation of biomarker panels enables assessment of patterns of proteins within the tissue rather than looking at one individual protein. This study highlights how such profiles enable a higher degree of diagnostic accuracy, judged by improved ROC AUC values and improved classification using logistic regression analysis. The choice of which peaks to include in the biomarker panel is important. Statistical evaluation of the data set of potential protein peaks with 10-fold cross-validation applied to logistic regression analysis proved to be an effective selection method in the present study and yielded improved results compared with panels chosen on the basis of individual differential expression. A second issue is deciding how many peaks to include in the panel. The addition of more peaks to the model initially improves its ability to separate groups; however, continued inclusion of additional peaks will increase chance differences between groups and potentially overfit the data, and may in
HEPATOLOGY, Vol. 44, No. 3, 2006
fact detract from the accuracy of the model when applied to a larger sample population.32,33 Therefore, 2 or 3 peaks were used in the biomarker panels in the present study to maximize discriminatory ability while minimizing effects due to chance. To obtain unbiased estimates, the crossvalidation of the prediction rule was external to the selection process. As a result, different peaks were selected in each training model, which was a direct consequence of the test set playing no part in the selection of the peaks. The use of cross-validation as we have implemented it makes the possibility of overfitting less likely than other approaches to these data might have done. Inter-assay variability has raised concerns regarding the reproducibility and accuracy of SELDI-TOF;34 however, the CV values found in this study compare very favorably with previously published studies.9-13,15-21,25 A potential source of error in the tissue group not present in the serum study may be sampling error. The high desmoplastic nature of CCs means the sampled tissue may miss the malignant portion of the tumor and may mainly consist of stroma rather than cholangiocytes proper. Sampling of adjacent bile duct may also be inaccurate if local spread has caused contamination with tumor cells, despite its normal appearance. Use of microdissection prior to sample preparation would help eliminate this issue. Interestingly, despite the heterogeneity of the tissue sampled, the m/z 10,311 peak was upregulated in cancer cells of diverse origin (i.e., intrahepatic and extrahepatic) and warrants further investigation. The collection of serum is free from such errors; however, it may be affected by more global factors, such as the general condition of the patient. The high positive predictive value required for a screening tool to be effective in the general population is difficult to achieve with a neoplasm as rare as CC. However, with refinement of the technology, there are certain populations in which the use of SELDI-TOF MS serum profiling might be valuable: for example, high-incidence populations such as Northeast Thailand, or high-risk clinical groups such as patients with primary sclerosing cholangitis, in which the lifetime risk of CC can be as high as 20%.1 In these situations, samples can be processed quickly, with a result received in a matter of hours. In conclusion, this study used SELDI-TOF MS to discover a potential biomarker of CC (m/z 4,462) with a discriminatory power equal to the existing serum markers CEA and CA19.9, the identity of which is currently under investigation. Additionally, several biomarker panels were generated that could more effectively distinguish CC from benign biliary disease. This may have important diagnostic implications for CC. This study supports the continued investigation of protein array technology in diagnostic cancer research.
SCARLETT ET AL.
665
References 1. Shaib Y, El-Serag HB. The epidemiology of cholangiocarcinoma. Semin Liver Dis 2004;24:115-125. 2. Blendis L, Halpern Z. An increasing incidence of cholangiocarcinoma: why? Gastroenterology 2004;127:1008-1009. 3. Jarnagin WR, Shoup M. Surgical management of cholangiocarcinoma. Semin Liver Dis 2004;24:189-199. 4. Gores GJ. Cholangiocarcinoma: current concepts and insights. HEPATOLOGY 2003;37:961-969. 5. Abu-Hamda EM, Baron TH. Endoscopic management of cholangiocarcinoma. Semin Liver Dis 2004;24:165-175. 6. Nehls O, Gregor M, Klump B. Serum and bile markers for cholangiocarcinoma. Semin Liver Dis 2004;24:139-154. 7. Issaq HJ, Conrads TP, Prieto DA, Tirumalai R, Veenstra TD. SELDITOF MS for diagnostic proteomics. Anal Chem 2003;75:148A-155A. 8. Fields S. Proteomics. Proteomics in genomeland. Science 2001;291:12211224. 9. Rai AJ, Zhang Z, Rosenzweig J, Shih Ie M, Pham T, Fung ET, et al. Proteomic approaches to tumor marker discovery. Arch Pathol Lab Med 2002;126:1518-1526. 10. Kozak KR, Amneus MW, Pusey SM, Su F, Luong MN, Luong SA, et al. Identification of biomarkers for ovarian cancer using strong anion-exchange ProteinChips: potential use in diagnosis and prognosis. Proc Natl Acad Sci U S A 2003;100:12343-12348. 11. Petricoin EF, Ardekani AM, Hitt BA, Levine PJ, Fusaro VA, Steinberg SM, et al. Use of proteomic patterns in serum to identify ovarian cancer. Lancet 2002;359:572-577. 12. Rosty C, Christa L, Kuzdzal S, Baldwin WM, Zahurak ML, Carnot F, et al. Identification of hepatocarcinoma-intestine-pancreas/pancreatitis-associated protein I as a biomarker for pancreatic ductal adenocarcinoma by protein biochip technology. Cancer Res 2002;62:1868-1875. 13. Koopmann J, Zhang Z, White N, Rosenzweig J, Fedarko N, Jagannath S, et al. Serum diagnosis of pancreatic adenocarcinoma using surface-enhanced laser desorption and ionization mass spectrometry. Clin Cancer Res 2004;10:860-868. 14. Yu Y, Chen S, Wang LS, Chen WL, Guo WJ, Yan H, et al. Prediction of pancreatic cancer by serum biomarkers using surface-enhanced laser desorption/ionization-based decision tree classification. Oncology 2005;68: 79-86. 15. Wadsworth JT, Somers KD, Stack BC Jr, Cazares L, Malik G, Adam BL, et al. Identification of patients with head and neck cancer using serum protein profiles. Arch Otolaryngol Head Neck Surg 2004;130:98-104. 16. Melle C, Ernst G, Schimmel B, Bleul A, Koscielny S, Wiesner A, et al. Biomarker discovery and identification in laser microdissected head and neck squamous cell carcinoma with ProteinChip(R) technology, two-dimensional gel electrophoresis, tandem mass spectrometry, and immunohistochemistry. Mol Cell Proteomics 2003;2:443-452. 17. Lehrer S, Roboz J, Ding H, Zhao S, Diamond EJ, Holland JF, et al. Putative protein markers in the sera of men with prostatic neoplasms. BJU Int 2003;92:223-225. 18. Vlahou A, Schellhammer PF, Mendrinos S, Patel K, Kondylis FI, Gong L, et al. Development of a novel proteomic approach for the detection of transitional cell carcinoma of the bladder in urine. Am J Pathol 2001;158: 1491-1502. 19. Won Y, Song HJ, Kang TW, Kim JJ, Han BD, Lee SW. Pattern analysis of serum proteome distinguishes renal cell carcinoma from other urologic diseases and healthy persons. Proteomics 2003;3:2310-2316. 20. von Eggeling F, Junker K, Fiedle W, Wollscheid V, Durst M, Claussen U, et al. Mass spectrometry meets chip technology: a new proteomic tool in cancer research? Electrophoresis 2001;22:2898-2902. 21. Li J, Zhang Z, Rosenzweig J, Wang YY, Chan DW. Proteomics and bioinformatics approaches for identification of serum biomarkers to detect breast cancer. Clin Chem 2002;48:1296-1304. 22. Sobin LH, Fleming ID. TNM Classification of Malignant Tumors, fifth edition (1997). Union Internationale Contre le Cancer and the American Joint Committee on Cancer. Cancer 1997;80:1803-1804.
666
SCARLETT ET AL.
23. Scarlett CJ, Smith RC, Saxby AJ, Nielsen AQ, Samra JS, Wilson SR, et al. Proteomic classification of pancreatic adenocarcinoma tissue using protein chip technology. Gastroenterology 2006;130:1670-1678. 24. Ambroise C, McLachlan GJ. Selection bias in gene extraction on the basis of microarray gene-expression data. Proc Natl Acad Sci U S A 2002;99: 6562-6566. 25. Adam BL, Qu Y, Davis JW, Ward MD, Clements MA, Cazares LH, et al. Serum protein fingerprinting coupled with a pattern-matching algorithm distinguishes prostate cancer from benign prostate hyperplasia and healthy men. Cancer Res 2002;62:3609-3614. 26. Zheng LX, Jia HB, Wu DQ, Shang H, Zhong XY, Wang QS, et al. Experience of congenital choledochal cyst in adults: treatment, surgical procedures and clinical outcome in the Second Affiliated Hospital of Harbin Medical University. J Korean Med Sci 2004;19:842-847. 27. Cullen SN, Chapman RW. Review article: current management of primary sclerosing cholangitis. Aliment Pharmacol Ther 2005;21:933-948. 28. Zen Y, Aishima S, Ajioka Y, Haratake J, Kage M, Kondo F, et al. Proposal of histological criteria for intraepithelial atypical/proliferative biliary epithelial lesions of the bile duct in hepatolithiasis with respect to cholangio-
HEPATOLOGY, September 2006
29.
30.
31.
32.
33. 34.
carcinoma: preliminary report based on interobserver agreement. Pathol Int 2005;55:180-188. Terada T, Nakanuma Y. Pathological observations of intrahepatic peribiliary glands in 1,000 consecutive autopsy livers. III. Survey of necroinflammation and cystic dilatation. HEPATOLOGY 1990;12:1229-1233. Terada T, Nakanuma Y. Expression of tenascin, type IV collagen and laminin during human intrahepatic bile duct development and in intrahepatic cholangiocarcinoma. Histopathology 1994;25:143-150. Mehta AI, Ross S, Lowenthal MS, Fusaro V, Fishman DA, Petricoin EF 3rd, et al. Biomarker amplification by serum carrier protein binding. Dis Markers 2003;19:1-10. Li L, Tang H, Wu Z, Gong J, Gruidl M, Zou J, et al. Data mining techniques for cancer detection using serum proteomic profiling. Artif Intell Med 2004;32:71-83. White CN, Chan DW, Zhang Z. Bioinformatics strategies for proteomic profiling. Clin Biochem 2004;37:636-641. Baggerly KA, Morris JS, Coombes KR. Reproducibility of SELDI-TOF protein patterns in serum: comparing datasets from different experiments. Bioinformatics 2004;20:777-785.