Renewable Agriculture and Food Systems: 24(4); 260–266
doi:10.1017/S1742170509990093
Protocol for indicator scoring in the soil management assessment framework (SMAF) B.J. Wienhold1*, D.L. Karlen2, S.S. Andrews3 and D.E. Stott4 1
USDA-ARS, AgroEcosystem Management Research Unit, 279 Plant Sciences, East Campus, University of Nebraska, Lincoln, NE 68583, USA. 2 USDA-ARS, National Soil Tilth Laboratory, 2150 Pammel Drive, Ames, IA 50011, USA. 3 USDA-NRCS, National Soil Quality Technology Development Team, 200 E. Northwood Street, 410, Greensboro, NC 27401, USA. 4 USDA-ARS, National Soil Erosion Research Laboratory, 275 S. Russell Street, West Lafayette, IN 47907, USA. *Corresponding author:
[email protected]
Accepted 6 June 2009; First published online 18 September 2009
Research Paper
Abstract Assessment tools are needed to evaluate agronomic management effects on critical soil functions such as carbon sequestration, nutrient cycling and water partitioning. These tools need to be flexible in terms of selection of soil functions to be assessed and indicators to be measured to ensure that assessments are appropriate for the management goals. The soil management assessment framework (SMAF) is being developed to meet this need. The SMAF uses soil physical, chemical and biological indicator data to assess management effects on soil function using a three-step process for (1) indicator selection, (2) indicator interpretation and (3) integration into an index. While SMAF is functional in its present format, it is intended to be malleable so that user needs can be met. Development of additional indicator interpretation scoring curves is one way that this framework can be expanded. Scoring curve development is a multi-step process of identifying an indicator, determining the nature of the relationship of the indicator to a soil function, programming an algorithm and/or logic statements describing that relationship and validating the resulting scoring curve. This paper describes the steps involved in developing an SMAF scoring curve. Scoring curves for interpreting water-filled pore space (WFPS) and Mehlich extractable potassium (K) were developed using the described protocol. This protocol will assist users of the SMAF in understanding how the existing scoring curves were developed and others interested in developing scoring curves for indicators that are not in the current version. Key words: soil management assessment framework (SMAF), scoring curves, soil indicators, soil quality, potassium, water-filled pore space, ecosystem function
Introduction Soils perform essential ecosystem functions related to plant growth, air and water quality and recycling of animal and plant products1. Soil management affects how well these functions are performed. While we know a great deal about management effects on soil functions, much of this knowledge is site-specific. Extrapolation of results from one site to another is often difficult due to differences in soils, climate and crops. Expanding our knowledge base often requires many site years of data to confidently determine management effects on soils. As farmers become more dynamic in their management and change soil management
practices more frequently to meet economic and societal demands, tools are needed to assess management effects on soil function in a timely manner. Soil functions are often difficult to measure directly and may require long time periods to exhibit quantifiable changes. In contrast, there are soil properties (indicators) that affect or represent soil function, are easy to measure and are sensitive to management2. The soil management assessment framework (SMAF) was developed by Andrews et al.3 as an additive, non-linear indexing tool for assessing soil function. The SMAF is intended for use by land managers and their advisors in assessing ongoing management practices. The goal of the SMAF is to extend current # Cambridge University Press 2009
Protocol for indicator scoring in the soil management assessment framework assessment efforts that emphasize erosion rates and soil loss tolerances to include the multiple ecosystem functions performed by soils3. Since soil function can be degraded by causes other than erosion (e.g. compaction, oxidation of organic matter, salinization and acidification) it is essential that assessment tools offer flexibility in selection of functions to be assessed and indicators to be measured. The SMAF uses soil physical, chemical and biological indicator data to assess management effects on soil function using a three-step process for (1) indicator selection, (2) interpretation and (3) integration into an index. This assessment tool can be used to compare contrasting management practices on a given soil series or to monitor management effects over time within a field. Beta versions of the SMAF are available on the University of Illinois Soil Quality Web site at http://soilquality.org/tools/smaf_intro.html (verified February 18, 2009) or on CD and in a spreadsheet format by contacting the authors. Andrews et al.3 demonstrated use of the SMAF using case studies in Georgia, Iowa, California and the Pacific Northwest. These four case studies ranged in scale from plot studies in Georgia and California, to the watershed scale in Iowa, to monitoring sites within major land resource area 9 in the Pacific Northwest. The Georgia study compared the residual effect of fresh versus composted broiler litter in tall fescue (Festuca arundinacea) pasture. The SMAF results showed significant differences between the treatments with the soil P score being lower in the compost treatment. The California study compared conventional, low input and organic vegetable production systems. The SMAF results showed highest scores for the organic system and lowest scores for the conventional system. The study in Iowa compared soil quality in a conventionally tilled watershed to that in a ridge tilled watershed and found that the less intensive tillage resulted in higher SMAF scores. The Pacific Northwest study compared soil quality among a number of land uses. The SMAF scores were highest for forest, range and woodland soils and lowest for soils in CRP, annual cropping, or crop–fallow. Wienhold et al.4 used published soil indicator data from two long-term studies in the northern Great Plains to compare grazing and cropping intensity effects on soil quality. Grazing intensity ranged from heavily grazed to ungrazed and cropping intensity ranged from crop–fallow to annual cropping. The SMAF ranked soil quality as lowest in heavily grazed and crop–fallow systems and highest in moderately grazed and annually cropped management systems. Scores among management practices were statistically different and the ranking of the management practices agreed with current knowledge of management effects on soil quality. The SMAF was recently used to compare contrasting management practices over 3 years at eight locations in the Great Plains5. The locations used in this study included Swift Current, SK, Sidney, MT, Fargo and Mandan, ND, Brookings, SD, Lincoln, NE, Akron, CO and Bushland, TX. At each location soil quality was compared between
261
a conventional management system and an alternative management system that included reduced tillage or more intensive cropping. At Fargo, Mandan, Lincoln and Swift Current the SMAF score was greater for the alternative management system than for the traditional management system. This study also documented a positive correlation between yield (a production goal) and SMAF scores at Mandan and Swift Current; a negative correlation between residual nitrate (an environmental goal) and SMAF scores at Lincoln, Bushland, Sidney and Fargo; and a positive correlation between soil organic carbon (an environmental or production goal) and SMAF scores at Fargo, Lincoln, Mandan and Swift Current. The SMAF is currently being used as a tool within the Conservation Effects Assessment Project (CEAP) to identify the most-limiting soil functions and soil properties or processes being affected by various conservation practices at benchmark watersheds throughout the US. Initial sampling has been completed in five states (GA, IA, NH, OK and TX) and scheduled for three others (IN, MD and MS). Sample analysis and interpretation using the SMAF are in progress. The Soil and Water Conservation Society recently published results from an expert consultation that identified actions needed for more comprehensive soil assessment, management and planning tools6. The SMAF was one of the assessment tools evaluated during this workshop and a specific recommendation was that the number of scoring curves available for interpreting soil indicators be increased. Andrews et al.3 extended a framework proposed by Karlen and Stott7 to develop the SMAF. The scientific rational for the scoring curve concept has been described but a protocol for developing additional scoring curves is needed. The SMAF is designed to allow updating and expansion by users to meet their needs. Improvements to the framework may take the form of validation using data for soils, climates and land uses that have yet to be assessed using the SMAF. The current version of the SMAF contains a limited number of scoring curves and further improvement will take the form of developing scoring curves for additional soil indicators. The objective of this paper is to describe the protocol used to develop SMAF scoring curves. This protocol is then used to develop two new scoring curves for inclusion in the SMAF. These additional scoring curves will give users of the SMAF additional soil indicators for possible inclusion in assessing soil management.
Materials and Methods Protocol description The SMAF uses non-linear scoring curves to transform soil indicator values into unitless scores3,7. Scoring curves represent algorithms, or logic functions linking multiple algorithms, that relate a soil indicator to a function performed by soils. Scoring curves take the general shapes
262
B.J. Wienhold et al.
Table 1. Soil indicators having scoring curves and soil indicators having potential for scoring curve development. Developed scoring curves
Potential scoring curves
Organic C concentration Macroaggregate stability Microbial biomass C Potentially mineralizable N pH Extractable P Microbial quotient (qCO2) Bulk density Electrical conductivity Sodium adsorption ratio Available water capacity
Water-filled pore space (WFPS) Aggregate mean weight diameter Mehlich extractable K Extractable Ca Extractable Mn Extractable Zn Nitrate-N Ammonium-N b-glucosidase Fluorescein diacetate hydrolysis Others
of more-is-better, less-is-better and mid-point optima. The general shape is predicted from current scientific knowledge about the relationship between the indicator of interest and the function it represents. Upper and lower limits or optima values represent threshold values for the soil indicator outside of which soil function is impaired. Algorithms are constructed to allow shifts in inflection points, creating changes in expected ranges that account for inherent soil differences and the effect of climate on soil function3. Scoring curve development involves a number of steps. These steps are: Identify a soil indicator. The first step in scoring curve development is to identify a soil indicator for which a scoring curve has not been developed, that responds to soil management practices, and affects a soil function related to one or more management goals (e.g. productivity, waste recycling and environmental protection). The current version of the SMAF has scoring curves for 11 soil properties but more than 60 other properties have been identified as having potential as assessment indicators. A partial list of potential assessment indicators is provided in Table 1. Identify available data sets. Data for constructing a scoring curve can be original data collected specifically for determining the relationship between a soil indicator and a soil function or existing data sets from previous studies. Data sets need to include soil indicator values and a measure of soil function for a range of environmental conditions. Determine and mathematically define the relationship between the soil indicator and the soil function. This is done by graphing the relationship between a soil indicator and a soil function and determining the general shape of the relationship (e.g. more-is-better, less-isbetter, local optima or other, depending on environmental condition). Curve fitting software is then used to develop an algorithm that describes the relationship. Identify factors that influence the relationship between the soil indicator and soil function. While it is usually assumed that the general shape of the relationship
between a soil indicator and a soil function holds across systems, the range for each indicator will frequently vary among systems. The variation from system-to-system results from differences in site-specific factors such as climate or inherent soil properties3. Program the curve. An algorithm that describes the relationship between the soil indicator and soil function is entered into a spreadsheet. In addition, a table of parameter changes for factors that cause needed shifts in inflection points or expected ranges for the indicator is created. Validate the curve. Scoring curve algorithms are used to generate scores using data not used to estimate algorithm parameter values. A number of validation methods, including professional opinion regarding reasonable outcomes, comparison with measured environmental goals (e.g. yield or soil loss), or comparison to other published data sets and their author’s conclusions can be used to validate the new scoring curve. Further validation is accomplished as other users implement the SMAF, use the scoring curves and report their results.
Indicator selection and data sets Two soil indicators were identified as candidates for scoring curve development. These two indicators are not included in the current version of SMAF, are known to respond to management and affect soil functions related to management goals. A physical attribute, water-filled pore space (WFPS) is calculated using an assumed soil particle density (rp) of 2.65 g cm - 3 and the relatively easily measured soil properties of bulk density (rb) and gravimetric water content (Qg). The calculation for WFPS is WFPS = (Qv =TP), where Qv is the percent volumetric water content and is equal to (%Qg) (rb) and TP is the total soil porosity and is equal to (1 - rb/rp). Mehlich extractable K (a chemical soil attribute) is a measure of the availability of an essential plant nutrient. Extractable K relates to the production function of soils. If extractable K decreases, there is an increased probability that yields will be reduced and an increased probability that the crop will respond to fertilizer K. Data used to develop scoring curves for WFPS were taken from Doran et al.8 which utilized 18 benchmark soils representing nine soil orders. A production function-scoring curve was developed using data that related WFPS to respiration and nitrification. An environmental functionscoring curve was developed using data relating WFPS to denitrification. A scoring curve for Mehlich extractable K was developed using test interpretation information published by Iowa State University (http://www.extension. iastate.edu/Publications/PM1688.pdf; verified February 18, 2009), University of Nebraska (http://www.ianrpubs.unl. edu/epublic/pages/publicationD.jsp?publicationId=142; verified February 18, 2009), University of Missouri (http:// extension.missouri.edu/explore/agguides/soils/g09185.htm; verified April 10, 2009) and the International Fertilizer
Protocol for indicator scoring in the soil management assessment framework 1.2
WFPS score
0.8 0.6
0.8 0.6 Coarse textured soils Fine textured soils
0.4
y = –0.745 + 5.63 (%WFPS) – 4.64 (%WFPS)2
Fine textured soils Coarse textured soils
0.0 1.0
0.2
B
B
15 10
0.8 y = 1/(1.044 + 37.9 (%WFPS)20.8)
0.6 0.4
5
0.2
0
0.0 0.0
0.2
y = –0.492 + 5.44 (%WFPS) – 5.03 (%WFPS)2
0.2
0.4
WFPS score
Relative soil respiration Denitrification (mg N kg–1 7d–1)
1.0
20
A
1.0
A
263
0.4
0.6
0.8
1.0
Water-filled pore space
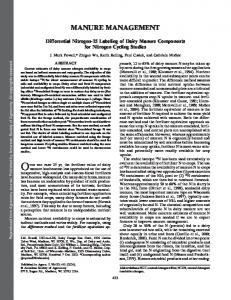
Figure 1. Plot of relative soil respiration versus water-filled pore space (A) and denitrification rate versus water-filled pore space (B) for 18 benchmark soils. Interpolated from Doran et al.8.
Industry Association9. This interpretation information related extractable K to the probability that crop yields would decrease and that the crop would exhibit a response to K fertilizer. Curve fitting software [e.g. CurveExpert (Trade or manufacturer’s names mentioned do not constitute endorsement, recommendation, or exclusion by USDA), v. 1.3 shareware available online at http://www.ebicom.net/~dhyams/cmain. htm; verified February 18, 2009] was used to develop algorithms describing the relationship between the selected indicators and corresponding soil functions. CurveExpert compares the fit of the data to a library of available models, selects the model having the lowest root mean square error and provides coefficient estimates for the model exhibiting the best fit.
Validation The production scoring curve for WFPS was validated using growing season soil respiration and WFPS data published by Ding et al.10. The environmental scoring curve for WFPS was validated using field measured denitrification data presented in Doran et al.8. The scoring curve for extractable K was validated using data describing the yield response of corn to starter fertilizer over 100 site years in Wisconsin11. Curves were considered validated if the SMAF score ranking of the management practices was the same as the statistical ranking using soil indicator data in the original studies.
All soils
0.2
0.4 0.6 0.8 Water-filled pore space
1.0
Figure 2. Percentage water-filled pore space scoring curves for two management goals: (A) productivity management using soil texture as a controlling factor and (B) environmental management. Higher score indicates greater performance of ecosystem function. Here, the functions related to the management goal are: water availability for plant production and biotic habitat to support favorable microbial populations and avoidance of anaerobic conditions conducive to denitrifiers.
Results and Discussion WFPS affects root respiration and soil microbially mediated processes and is related to both the crop production and environmental functions of soils. For a production function, very low WFPS values suppress plant growth and microbial activity due to lack of available water. At optimal WFPS values, root growth and microbial processes such as nitrification (N available for plant growth) are greatest. As WFPS values become greater, root growth of most plants is suppressed. Doran et al.8 presented soil respiration data as relative values with the greatest respiration rate having a value of 1 and lower respiration rates having lower relative values. The SMAF uses a similar approach assigning a value of 1 to the indicator value where the soil function is optimal. When relative respiration data are graphed a mid-point optima curve is indicated (Fig. 1A). Doran et al.8 presented quadratic functions that related relative soil respiration to WFPS (Fig. 2A). They also described a shift in the relationship between WFPS and soil respiration and nitrification related to soil texture. These equations represent algorithms that describe the relationship between soil respiration and WFPS and identify factors that influence these relationships. These equations can therefore be used directly as scoring curves in the SMAF. The quadratic
264
B.J. Wienhold et al. Denitrification (g N2O ha–1 d–1)
Relative soil respiration
1.2
0.9
0.6
0.3
0.0 0.4 0.6 0.8 Water-filled pore space
A 150
100
50
0
1.0
Figure 3. Relative soil respiration as a function of percentage water-filled pore space in a sandy loam Inceptisol (adapted from Ding et al.10). The curve represents the SMAF scoring curve for the production goal presented in Fig. 2A.
0.8 WFPS score
0.2
200
B
0.6 0.4 0.2
equation for the WFPS scoring curve is WFPS score = a + b(WFPS) + c(WFPS)2 ,
0.0 0.5
0.6
0.7
0.8
0.9
1.0
Water-filled pore space
where coefficient values for coarse textured soils (e.g. sandy, sandy loam and sandy clay loam) are a = - 0.492, b = 5.44 and c = - 5.03 and for fine textured soils (e.g. silt, silt loam, clay loam and clay) are a = - 0.745, b = 5.63 and c = - 4.64. For the crop production function, low WFPS levels affect biological activity by limiting water availability and respiration and nitrification rates are reduced. As WFPS increases, respiration and nitrification increases to a mid-point optimum. Further increases in WFPS limit aerobic biological activity by reducing oxygen availability and respiration and nitrification rates decline (Fig. 2A). Doran et al.8 presented denitrification rates versus WFPS (Fig. 1B). Denitrification emits N as NOx, which are greenhouse gases and this process has negative environmental effects. The relationship between denitrification and WFPS suggests a less-is-better scoring curve. The environmental WFPS scoring curve was best fit to a Harris model function: WFPS score = 1=(1:04 + 37:9(WFPS)20:8 ): At low WFPS, little denitrification occurs and the effect of this process on the environmental soil function is low resulting in an SMAF score of 1 until a threshold value is reached after which denitrification increases rapidly and the SMAF score decreases (Fig. 2B). The production scoring curve for WFPS was validated using growing season soil respiration and WFPS data published by Ding et al.10. Plotting soil respiration rate against WFPS results in a curve having a midpoint optima shape similar to that of the scoring curve developed above (Fig. 3). Most of the respiration data reported by Ding et al.10 corresponds to WFPS values between 0.2 and 0.6, which is on the ascending part of the productivity scoring curve (scores of 0.4–1.0). When WFPS values approach 0.6, scores for the production function declined and reported soil respiration rates become more variable and
Figure 4. (A) Denitrification as a function of water-filled pore space for a Clarion soil. Interpolated from Doran et al.8 and (B) corresponding SMAF scores calculated using the environmental goal scoring curve presented in Fig. 2B.
decline. These results are what we would expect based on our knowledge of soil water content effects on aeration and soil microbial activity. The environmental scoring curve for WFPS was validated using field denitrification data presented by Doran et al.8 (Fig. 4A). As WFPS values become greater, denitrification activity increases and SMAF scores decrease (Fig. 4B). The scoring curve developed using laboratory measurements produces decreasing scores when WFPS becomes great enough for denitrification activity to begin in field soils. The potential advantage of using WFPS in place of soil respiration or denitrification measurements relates to the difference in measuring these variables. Measuring soil respiration and denitrification requires chambers, gas sampling equipment, and a gas chromatograph, while WFPS requires a soil probe to collect a sample of known volume, an oven to dry the sample and a balance to weigh the soil sample before and after drying. Time and expense are much lower to determine WFPS. However, when the simple measure is combined with the use of the SMAF scoring curve, the information obtained is very similar to that obtained with the more involved respiration and denitrification methods and WFPS can serve as a surrogate for soil respiration. The data for developing a SMAF scoring curve for Mehlich extractable K (mg kg - 1) relates relative crop yield to extractable K values (Fig. 5). The data suggest that a more-is-better scoring curve is appropriate with crop yields
Protocol for indicator scoring in the soil management assessment framework 1.0
1.0
0.8 0.8
Missouri extension IFA World Fert. Handbk. NebGuide G74-174-a ISU PM 1688
0.4 0
100
200
300
Mehlich extractable potassium (mg
400
y = 1.06 (1 – e–0.0122 (soil test K)) 0.6 0.4 0.2 0.0 0
kg–1)
Figure 5. Relative crop yield versus Mehlich soil test K relationships used for fertilizer recommendations. Iowa State University (http://www.extension.iastate.edu/Publications/PM1688.pdf; verified February 18, 2009), University of Nebraska (http://www. ianrpubs.unl.edu/epublic/pages/publicationD.jsp?publicationId=142; verified February 18, 2009), University of Missouri (http:// extension.missouri.edu/explore/agguides/soils/g09185.htm; verified April 10, 2009) and the International Fertilizer Industry Association9.
being limited at low extractable K levels and yields increasing as extractable K increases to a point where extractable K is adequate for crop production. The data relating crop yield to Mehlich extractable K were best fit to an exponential function (Fig. 6). The exponential equation for the extractable K scoring curve is Extractable K score = 1:06 * (1 - exp( - 0:0122 * Mehlich extractable K)): At low extractable K levels, the probability of reduced yields and a crop response to K fertilizer increases. As extractable K levels increase, the probability of reduced yields and a crop response to K fertilizer decreases12. A more-is-better curve is appropriate since there are no major environmental concerns associated with high extractable K values to indicate a need for lower scores for environmental risk at high soil test K values. The scoring curve for extractable K was validated using data describing the yield response of corn to starter fertilizer over 100 site years in Wisconsin11. These authors presented data as the percentage of sites that responded to starter K when Mehlich extractable K levels were 140 mg kg - 1 (Fig. 7). Corn growing in soils with extractable K levels < 140 mg kg - 1 produced an SMAF extractable K index value < 0.86 and corn growing in soils with extractable K levels >140 mg kg - 1 produced an SMAF score > 0.86 (Fig. 7). In these soils, as extractable K levels increased, fewer crop responses to starter K were observed. The Mehlich extractable K SMAF scoring curve can be included with scoring curves for available P and soil nitrate to assess the nutrient availability status of soils for crop production assessments.
50
100
150
200
250
300
Soil test K (mg kg–1)
Figure 6. Mehlich extractable K scoring curve. Higher score indicates greater performance of ecosystem function. In this case, higher nutrient availability for plant production.
Responsive sites (%)
0.6
Test K score
Relative yield
265
50 40 30 20 10 0 < 140
> 140
Extractable K (mg kg–1)
Figure 7. Percentage of sites responsive to potassium fertilization as a function of soil test K in Wisconsin11.
The equations discussed above have been programmed into the spreadsheet version of the SMAF. For the WFPS production curve shifts due to factors affecting the indicator–soil function relationship, logic functions such as ‘IF’, ‘THEN’ and ‘ELSE’ were used to select the coefficients appropriate for the soil being assessed. All versions, web, CD and spreadsheet, operate in a similar manner. The web and CD versions use object-oriented Java code linked to a database, while the spreadsheet version uses embedded functions and look-up tables. The spreadsheet version is ideal for adding curves or otherwise manipulating the existing framework. The web and CD versions are better for users simply wanting to use the existing tool ‘as is’. These curves will be added to the web and CD versions of the SMAF in the future.
Conclusions The two scoring curves developed in this paper increase the number of indicators available for users of the SMAF and serve as examples of the steps necessary to develop scoring curves for additional indicators. All scoring curves in the SMAF, including those presented above, can be further refined and validated using appropriate soil
266 management data bases. The main challenge in validating scoring curves is collecting or identifying data sets that have measures of both the soil indicator of interest and a soil function. Soil indicator data are usually easier to collect than are soil function data, due to the difficulty in measuring functions directly. This difficulty in collecting soil function data results in a research need (e.g. data sets that can be used to validate scoring curves) and identifies the value of assessment tools such as the SMAF. Once a scoring curve is validated, an easy-to-measure indicator can be used with the curve as an interpretive tool to assess management effects on difficult or expensive to measure soil functions. These curves, whether used as part of an overall index of soil function in the SMAF or as interpretations of individual soil functions, can facilitate conservation by land managers through adaptive management, and by policy makers through improved resource and allocation of effort.
References 1 Doran, J.W. and Parkin, T.B. 1994. Defining and assessing soil quality. In J.W. Doran, D.C. Coleman, D.F. Bazdicek, and B.A. Stewart (eds). Defining Soil Quality for a Sustainable Environment. Soil Science Society of America Special Publication No. 35, Soil Science Society of America, Madison, WI. p. 3–21. 2 Doran, J.W. and Parkin, T.B. 1996. Quantitative indicators of soil quality: a minimum data set. In J.W. Doran and A.J. Jones (eds). Methods for Assessing Soil Quality. Soil Science Society of America Special Publication No. 49, Soil Science Society of America, Madison, WI. p. 25–37. 3 Andrews, S.S., Karlen, D.L., and Cambardella, C.A. 2004. The soil management assessment framework: a quantitative soil quality evaluation method. Soil Science Society of America Journal 68:1945–1962.
B.J. Wienhold et al. 4 Wienhold, B.J., Andrews, S.S., and Karlen, D.L. 2004. Soil quality: a review of the science and experiences in the USA. Environmental Geochemistry and Health 26:89–95. 5 Wienhold, B.J., Pikul, J.L. Jr, Liebig, M.A., Mikha, M.M., Varvel, G.E., Doran, J.W., and Andrews, S.S. 2006. Cropping system effects on soil quality in the Great Plains: synthesis from a regional project. Renewable Agriculture and Food Systems 21:49–59. 6 SWCS. 2008. Beyond T: Informing Sustainable Soil Management. Soil and Water Conservation Society, Ankeny, IA. Available at Web site http://www.swcs.org/documents/ filelibrary/beyondtreport.pdf (verified February 18, 2009). 7 Karlen, D.L. and Stott, D.E. 1994. A framework for evaluating physical and chemical indicators of soil quality. In J.W. Doran, D.C. Coleman, D.F. Bezdicek, and B.A. Stewart (eds). Defining Soil Quality for a Sustainable Environment. Soil Science Society of America Special Publication No. 35, Soil Science Society of America, Madison, WI. p. 53–72. 8 Doran, J.W., Mielke, L.N., and Power, J.F. 1990. Microbial activity as regulated by soil water-filled pore space. In Transactions of the 14th International Congress of Soil Science, Kyoto, Japan. International Soil Science Society, Wageningen, The Netherlands. p. 94–100. 9 Halliday, D.J. and Trenkel, M.E. (eds). 1992. International Fertilizer Association World Fertilizer Use Manual. International Fertilizer Industry Association, Paris, France. 10 Ding, W., Cai, Y., Cai, Z., Yagi, K., and Zheng, X. 2007. Soil respiration under maize crops: effects of water, temperature, and nitrogen fertilization. Soil Science Society of America Journal 71:944–951. 11 Bundy, L.G. and Andraski, T.W. 1999. Site-specific factors affecting corn response to starter fertilizer. Journal of Production Agriculture 12:664–670. 12 Tisdale, S.L., Nelson, W.L., and Beaton, J.D. 1985. Soil Fertility and Fertilizers. 4th ed. MacMillian Publishing Company, New York, NY.