www.itcon.org - Journal of Information Technology in Construction - ISSN 1874-4753
4D BEYOND CONSTRUCTION: SPATIO-TEMPORAL AND LIFECYCLIC MODELING AND VISUALIZATION OF INFRASTRUCTURE DATA SUBMITTED: July 2017 REVISED: September 2018 PUBLISHED: November 2018 at https://www.itcon.org/2018/14 EDITOR: Turk Ž. Zixiao Zhang, PhD, Stanford University, Stanford, United States;
[email protected] Hesam Hamledari, PhD Student, Stanford University, Stanford, United States;
[email protected] Sarah Billington, Professor, Stanford University, Stanford, United States;
[email protected]
Martin Fischer, Professor, Stanford University, Stanford, United States;
[email protected] SUMMARY: While four-dimensional (4D) technology has been extensively studied for use in the construction phase, there exists a great potential for its successful application in the maintenance, operation, and facility management phases. This paper proposes a novel 4D-based method for life cyclic integration, modeling, and visualization of infrastructure data. Such temporal integration of infrastructure data is particularly crucial due to the ever-increasing demand for maintaining the infrastructure assets in the United States, with approximately 188 million trips occurring across the nation’s structurally deficient bridges. The proposed approach takes the application of 4D technology beyond the construction phase and demonstrates its effectiveness for life cyclic modeling and visualization of infrastructures’ data including condition assessments. In this approach, various data categories such as inspection reports, maintenance schedules and costs, degradation models, operation schedules, and elements’ semantics are integrated with 3D models and using 4D technology, bringing the notion of time and space to infrastructure data; this enables the spatio-temporal exploration and modeling of data at an element level; this is not currently achievable since the existing solutions connect and display just one set of temporal data for one level of detail of a structure. The introduced technique also visualizes the data using a colorcoding scheme and provides customized query and information retrieval support. In addition, degradation models can be integrated with the 4D-based system to simulate the condition ratings over time. The technique has been implemented and demonstrated for bridge infrastructure; it has been evaluated in two case study bridges in the state of California, United States, and has shown promise for use in real-life applications. The technique was observed to become more effective with increase in the complexity of maintenance tasks and infrastructure models; it increased the accuracy of maintenance tasks by 20-40% and reduced their duration by 30-50%. KEYWORDS: 4D, infrastructure; information modeling; maintenance; visualization; bridge information model REFERENCE: Zixiao Zhang, Hesam Hamledari, Sarah Billington, Martin Fischer (2018). 4D beyond construction: spatio-temporal and life-cyclic modeling and visualization of infrastructure data. Journal of Information Technology in Construction (ITcon), Vol. 23, pg. 285-304, http://www.itcon.org/2018/14 COPYRIGHT: © 2018 The author(s). This is an open access article distributed under the terms of the Creative Commons Attribution 4.0 International (https://creativecommons.org/licenses/by/4.0/), which permits unrestricted use, distribution, and reproduction in any medium, provided the original work is properly cited.
ITcon Vol. 23 (2018), Zhang, pg. 285
1. INTRODUCTION Billions of dollars are spent each year to address the ever-increasing demands for maintaining the infrastructure assets in the United States. It is estimated that 40% of the U.S. bridges are over fifty years old, and nearly 9.1% are structurally deficient (ASCE 2017). With 188 million daily trips occurring across structurally deficient bridges (ASCE 2017), the status of this infrastructure has become a concern to maintenance engineers and the public, not only in U.S. but other countries such as Japan and The Netherlands (Garrett 2005; Klatter et al. 2002). Unfortunately, the conventional bridge maintenance management practices do not provide an efficient means of addressing the current concerns regarding the infrastructure (Kasireddy and Akinci 2015; Parlikad and Catton 2018; Sacks et al. 2016). The maintenance information such as inspection records and maintenance tasks are usually available in written forms, tables, and 2D drawings, and they are organized chronologically (Nepal et al. 2012). To identify the places where a specific condition is reported, an engineer needs to first study the conditionrating documents and then locate the instances using 2D drawings, a time-consuming, labor-intensive, and errorprone process. This inefficient access to reliable information regarding the as-is conditions and historical data has been recognized as the primary reason for rework during the maintenance stage (Love and Li 2000). Facing the increasing maintenance demands and limited budgets, the use of information technology has been explored in recent years to efficiently manage the maintenance of infrastructure facilities (Akinci 2015). In this regard, efforts have been focused on the development of bridge management systems (BMS) (Darbani and Hammad 2007; Minchin Jr et al. 2006), model-based data query and information retrieval (Reinhardt et al. 2004), and the integration of theoretical models with BMS (Frangopol et al. 2001; Morcous et al. 2002). In spite of these advancements, the infrastructure maintenance management systems suffer from a series of limitations due to the lack of holistic and life-cyclic approaches toward modeling and visualization of infrastructure data. There is a need for robust and efficient integration of collected data with BMS (Frangopol et al. 2008) over an infrastructure’s life time (Hammad et al. 2006; Shirole et al. 2008); the development of integrated information models has benefits for applications in the post-construction stages (Fischer et al. 2017; GhaffarianHoseini et al. 2017); it enables informed decision making, the assessment of infrastructure reliability, and increases the reliable access to data in all stages of an infrastructure’s life cycle. This paper proposes an integrated four-dimensional (4D) infrastructure maintenance management system which models and visualizes various infrastructure data in a temporal scheme; taking the application of 4D technology beyond the construction stage. Various temporal data categories such as maintenance schedules and costs, inspection history, elements’ semantic information, and degradation models are integrated with the infrastructure model. The integrated information is visualized in a 4D hierarchy both using color coding and data spreadsheets linked to 3D models. This enables the spatio-temporal visualization, query, exploration, and storage of data. This is currently not feasible using the existing solutions which only connect and display just one set of temporal data for one level of detail of a structure. The method’s integration of degradation models with the 4D system enables the simulation and visualization of conditions over an infrastructure facility’s life time, and it supports the use of theoretical models. This technique support 4D-based data integration at various physical and temporal levels (e.g., bridge and bridge element level). This paper first reviews the use of 4D technology in the construction phase and discusses the need for its adoption in post-construction phases, crucial to the spatio-temporal and life cyclic modeling, visualization, and retrieval of infrastructure data. It then elaborates on the design of the proposed 4D-based infrastructure maintenance management system. While the proposed technique can support any infrastructure system for which 3D models are available, this work demonstrates and evaluates its capabilities for bridges. Further, an in-depth analysis of the system’s performance in real-life scenarios is provided based on a series of filed experiments on two case study bridges in the state of California, United States. The system’s effectiveness was observed to be positively correlated with the complexity of maintenance tasks and that of infrastructure models; the system was observed to increase the accuracy of maintenance tasks by 20-40% and reduce their durations by 30-50%.
ITcon Vol. 23 (2018), Zhang, pg. 286
2. BACKGROUND The 4D modeling technology integrates time (i.e., the temporal dimension) with the 3D models (i.e., spatial dimensions) and provides a means of representing information over both space and time (Fischer et al. 2003). The application of both 4D computer-aided design (CAD) and building information modeling (BIM) has been studied for use in the construction phase. This is because the integration of schedules with 3D models improves planning (Chau et al. 2004; Park et al. 2017; Zhang and Hu 2011), improves layout planning (Cheng and Chang 2018; Kumar and Cheng 2015), facilitates time-space conflict analysis (Akinci et al. 2002), supports automated progress tracking (Hamledari et al. 2017b; Lin and Golparvar-Fard 2018; Tuttas et al. 2017), and provides a clearer view of the construction process (Hallberg and Tarandi 2011; Koo and Fischer 2000). It has been estimated that a minimum of 4-6 percent of overall project cost savings can be achieved with the help of 4D modeling (Fischer and Kunz 2004). The 4D modeling practices have also proven to improve the visualization, collaboration, and data communication between project members in different phases of projects (Garcia-Lopez and Fischer 2014; Hartmann et al. 2008; Kamat et al. 2010). The as-designed 4D models, however, lose their effectiveness if they are not regularly updated in the construction phase (Lopez et al. 2015). To address this issue, some studies have focused on automated 4D model updating to facilitate the site-to-model data transfer and increase the life cyclic utilization of such models. In one study (Kim et al. 2013), the use of image processing was explored for updating a 4D CAD of a cable-stayed bridge, where progress data was imported into Navisworks and later integrated with elements. Recently, 4D as-built modelling has been developed using point cloud data (Son et al. 2017). Another study introduced an IFC-based algorithm (Hamledari et al. 2017a) to automatically update 4D BIMs in terms of schedule and progress without reliance on proprietary software or specific data capture techniques.
2.1 The need for 4D-Based Infrastructure Maintenance Management Systems While 4D technology has recently experienced increased rates of adoption (Gledson and Greenwood 2017), its application has been focused mostly on the design and construction phases. This technology, however, has the potential to address some of the limitations of infrastructure maintenance management systems in postconstruction phases. The need for visualization and organization of maintenance information at the bridge and bridge element levels in bridge management systems (BMS) creates a unique opportunity for the application of 4D modeling in life cyclic bridge management. Using 4D technology, the notion of space and time can be brought to infrastructure data. The integration of different infrastructure data categories such as element-level maintenance information with 4D modeling technology can potentially provide a holistic approach toward sustainable and life cyclic infrastructure information modeling. In fact, such semantically rich and integrated models are proven to reduce uncertainty in performance assessments (Flint et al. 2014; Frangopol et al. 2017; Hüthwohl et al. 2018; Jeong et al. 2017). Further, integrated 4D-baesd approaches can explore the practical uses of the theoretical models supporting bridge condition assessments (e.g., reliability analysis); this is because such models need to be regularly updated and reconfigured based on the results of the infrastructure inspection (Estes and Frangopol 2003). While there exist case studies on the use of 4D technology in bridge construction (Kim et al. 2010), its potential during the maintenance and operation phases are still unexplored and has not received enough attention. In one study, a promising model-based BMS was proposed which linked a bridge’s life cyclic data to a 4D model (Hammad and Motamedi 2007; Hammad et al. 2006). This 4D-based system was shown to be more efficient at collecting inspection information. However, the prototype system was only focused on the collection and linking of inspection information to the 4D model, while the integration of maintenance information (e.g., condition history, repair history, and maintenance schedules) and degradation models with the 4D system was not achieved. There is a need for solutions that support the 4D model-based visualization and simulation of infrastructure conditions and provide 4D-based information retrieval and query support, essential to routine real-life infrastructure maintenance tasks. The 4D technology can also enable robust modeling of changes in an infrastructure’s geometry (e.g., bridge widening). The effectiveness of 4D model-based systems in postconstruction stages and in support of real-life infrastructure maintenance tasks also needs to be evaluated in close coordination with maintenance experts and practitioners.
ITcon Vol. 23 (2018), Zhang, pg. 287
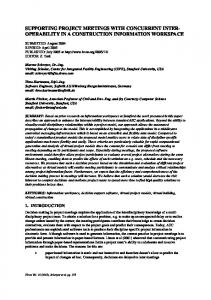
3. PROPOSED 4D-BASED INFRASTRUCTURE MAINTENANCE MANAGEMENT SYSTEM This work proposes the use of a system (Fig. 1) that organizes and visualizes maintenance and bridge condition information in a 4D scheme integrated with a bridge’s 3D model; The term “4D” is used herein to refer to the integration of various bridge maintenance data categories such as inspection reports, repair history, degradation models, environmental models, costs, and condition ratings with the bridge’s 3D model in a 4D scheme. In other words, the 4D-based approach supplements the 3D models with a temporal aspect, employing a life-cyclic view toward infrastructure data integration, visualization, and management; this is not currently available through 3D models. Fig. 1 depicts the graphical user interface of the developed system, where users have access to both hierarchical (Fig. 1e) and spreadsheet organizations (Fig. 1g) of the data integrated with the 3D model, allowing more flexible viewing of information through a maintenance information database. This data can also be visualized using colorcoding (Fig. 1b); the resulting color-coded 4D model (Fig. 1d) is automatically adjusted based on the date selected by the user through a 4D simulation control panel (Fig. 1a). Further, users can filter the elements of the visualized 4D model based on different attributes such as condition rating and element category (Fig. 1f). The data categories linked to the 3D model such as repair history (Fig. 1h), inspection history (Fig. 1i), and schedule (Fig. 1j) can be visualized using the spreadsheet. The accumulative maintenance costs can also be visualized based on userspecified date (Fig. 1c). Using this 4D-based approach, the users can retrieve bridge data at specific times/dates, observe the changes over the life cycle, relate different information at different physical scales and different temporal datasets, and perform simulations.
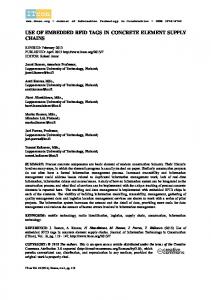
3.1 Color-Based Data Representation for 4D Models Color has long been used to represent different values and meanings. Human beings can distinguish between different colors immediately and thus quickly grasp the nature of the content that colors represent. In 4D CAD technologies, colors commonly represent different parts of buildings such as roofs, walls, floors, and stairs, or different types of construction work. Research has also proposed the use of color for intuitive visualization of a project’s schedule and cost performance (Song et al. 2005). This work employs color-coding to communicate the condition of bridge elements in the developed 4D environment. The level of deficiency is matched to the light spectrum in a linear fashion. For example, as shown in Fig. 2a, the color dark blue represents the new, undeteriorated condition (100%), green represents good condition with minor problems (70%), yellow represents considerable degradation (50%) and red represents very serious degradation (20%). The displayed 4D models (Fig. 1d; Fig. 2a) are color-coded based on elements’ conditions, so that the location of observed degradations and their severity can be easily and intuitively understood using the system. The displayed color-coded 4D model is automatically adjusted based on the user’s choice of date and time. In addition to condition ratings, color can also be used to represent information such as maintenance costs, user costs (such as operation loss at down time), an index of element importance, average environmental conditions (e.g. temperature, humidity), and repair costs. Further, customized indices can be developed and used for colorcoding. It is also possible to use the three dimensions of the HSL color space, namely hue, saturation, and lightness, to represent multiple data categories simultaneously. For instance, hue can be used to represent condition (e.g., Fig. 2a) and saturation to represent index of importance. Thus, a bridge element color-coded in dark red would require less attention than one colored light red.
ITcon Vol. 23 (2018), Zhang, pg. 288
FIG. 1: The developed 4D-based system: a) the 4D simulation control panel, b) the color coding legend, c) the accumulative cost until the current moment, d) the color-coded 4D model, e) the 4D data hierarchy, f) the display filtering, g) data spreadsheet, h-j) a few of the temporal data categories linked to the 3D model
FIG. 2: Different components of the developed system: a) the use of color for communication of condition ratings of an infrastructure; b) the 4D hierarchical relationship between elements; and c) the visualization of user-selected issues on the 4D model
ITcon Vol. 23 (2018), Zhang, pg. 289
3.2 Data Integration The baseline 4D technology used in this research organizes the 3D elements into a 4D hierarchy (Fig. 2b). This is achieved through a directory which maps a group of 3D elements into a leaf of the 4D hierarchy. The leaves are then further organized into higher-level groups. For example, the bottom level leaf can be a particular girder in a span. The second level can be all the girders in that span, and the third level all the girders in the bridge. This organization is convenient when assigning properties to the 3D models, in that instead of assigning the properties to the 3D elements one by one, one could assign the properties to groups of 3D elements. Figure 2b shows the 4D Hierarchy for a bridge. This work proposes the addition of several temporal and non-temporal properties to the baseline 4D technology; this enables the visualization of the maintenance and condition data over time (further described in the next section). The additional properties include 1) material/element degradation models, 2) temperature and humidity models, 3) inspection history, 4) repair history, 5) maintenance plan, and 6) element category. Each of these new properties or models was connected to the 3D model through a new mapping dictionary. Because structural modifications such as widening and strengthening might take place over a bridge's life time, the system was designed to allow for changes to the 3D model as time progresses. This was realized by defining the life period of the 3D elements using the schedules, thus automatically adjusting the display so that only the 3D elements that exist at a given time are visualized, and the rest are hidden. This is demonstrated for a sample bridge prior (Fig. 3a) and after a widening (Fig. 3b).
FIG. 3: The illustration of 3D model medications a) prior and b) after the widening The other capability offered by the system is the visualization of elements corresponding to a set of user-selected conditions. For example, as shown in Fig. 2c, the user can select a few instances of problems observed and recorded during site inspections; the corresponding elements are automatically highlighted (Fig. 2c).
3.3 Degradation Modeling and Visualization The 4D-based system can be used to make predications for the degradation ratings, compare them to inspection and repair histories, and propose maintenance activities. These predictions can then be visualized using the colorbased scheme and displayed as a function of time, directly linked to elements on the 3D rendering of the structure. The prototype 4D-based system provides a few hypothetical degradation models with adjustable parameters. These degradation models are time-dependent functions that return a deficiency value on every function call. The deficiency values are mapped to the range of 0~100 for the purpose of visualization and integration with the rating system used by maintenance engineers. Users can create their own customized degradation models for each element group by changing the model parameters. To link a degradation model to a 3D element or group of elements, the user selects the model in a library and drags and drops it on the corresponding leaf in the 4D hierarchy (Fig. 2b). The program also facilitates the function to change the parameters of models. For instance, if the user chooses to use the steel corrosion model such as that introduced by Melchers (Eq. 1) (Melchers 2003), implemented in this system, several parameters can be customized. Melchers’ model was used as a proof of concept; other research studies can create their own customized degradation models. 𝑚𝑑 = a𝑡 𝑏
(1)
ITcon Vol. 23 (2018), Zhang, pg. 290
Eq. 1 describes the degradation model used in this system where m is the corrosion depth (in mm); t is the age of the material (in years); and a and b are two fitted parameters obtained from experimental data. To customize the model, users can change the values of a and b according to their own experimental data. The degradation model parameters are mostly relevant to environmental conditions which might be timedependent functions by themselves. The degradation model for concrete beams (Hjelmstad et al. 1996), for example, involves environmental conditions of temperature, humidity, and chemical exposure. In the developed system, users can create environmental models and specify the temperature and humidity. In addition to these models, users may link inspection history, repair history, or a maintenance plan to each 3D element. Maintenance engineers generally record such data using a 1-to-5 rating scheme, where 1 represents the worst condition and 5 the best. This data is converted to a scale of 0 to 100 with the element categories model and then fed into the degradation model. When the condition predicted by the degradation model (e.g., Eq. 1) does not match the condition recorded by site engineers, the system allows the user to fit the degradation model to the inspected data using regression. An example is demonstrated in Fig. 4a, where the green line represents the prediction by degradation model, the red dots represent inspection data, and the yellow line represents the updated/fitted degradation model using the inspection data. A degradation curve can also be updated based on repairs and/or maintenance tasks that have been completed or scheduled. For a particular period of time, the program identifies the most recent maintenance activity and calculates the deficiency value by setting the time of the most recent activity as the starting point of the degradation function. The process of model update based on maintenance data is illustrated in Fig. 4b.
FIG. 4: Updated degradation curves based on a) inspection data and b) maintenance activities When the user runs a degradation simulation, for each time frame, the program calculates the deficiency value for each 3D element using the degradation and environmental models linked to that element and renders it on the 3D model. By matching the values of deficiencies to the light spectrum, degradation models and appraisal ratings are then visually linked to 3D elements in the 4D environment. The degradation process is thus simulated and visualized over time. The information flow throughout the 4D system is shown in Fig. 5. As observed in Fig. 5, this research utilizes a computer vision-based system to calculate the health index ratings for bridge structural elements; however, the indices can be calculated using any other means including on-site observations by the maintenance crew. Fig. 6 and Fig. 7 illustrate the visualization of elements’ conditions as a function of time and over an infrastructure’s life time, respectively for a bridge and a building. It should be noted that multiple degradation models can be developed and used based on material types. For example, different hypothetical degradation models were assigned to three different parts of the structure shown in Fig. 7.
ITcon Vol. 23 (2018), Zhang, pg. 291
FIG. 5: The information flow for the degradation simulation; the condition assessment can be performed using automated vision-based techniques or using on-site observation by maintenance crew
FIG. 6: The degradation simulation for a bridge
FIG. 7: The degradation simulation for a building structure Another important process enabled by the 4D-based system is the visualization of all elements and locations where a particular type of damage or degradation has been identified. In Fig. 8, for example, all elements having a condition rating of "3" are highlighted in red for two bridges. In other words, the 3D elements linked to the userselected condition (e.g., a condition rating of 3) are highlighted. The remainder of the 3D model can be made transparent to avoid the highlighted objects to be hidden from view (Fig. 8c).
ITcon Vol. 23 (2018), Zhang, pg. 292
FIG. 8: The visualization of elements/locations in various bridges having a common condition rating
4. EVALUATION OF THE 4D-BASED SYSTEM IN PERFORMING BRIDGE MAINTENANCE TASKS To evaluate the effect of the proposed 4D-based system on a maintenance engineer’s performance, a series of tests were designed wherein routine maintenance tasks were conducted using the 4D-based system and paper-based reports. The test was carried out twice, first with a group of graduate students from the Structural Engineering & Geomechanics group at Stanford University and then with a group of maintenance engineers from the California Department of Transportation (CALTRANS). To avoid the effect of learning curve on the 4D-based tests, a training session was provided for both groups. Prior to the tests, the engineering students familiarized themselves with paper-based processes using a few sample maintenance reports. Four tasks were selected for the participants (herein referred to as "engineers") to conduct based on a list of common maintenance tasks provided by the Chief of the CALTRANS’ Bridge Maintenance and Investigations Division. The participants were asked to complete these tasks for two bridges using the 4D system (Fig. 9a) or the traditional reports (Fig. 9b); the latter comprised between 110 to 131 pages of text, tables, and drawings for each of the two bridges. The four metrics of accuracy, task duration, efficiency, and consistency were used to quantify the engineers' performance when using the 4D- and paper-based methods. They are defined further in the next section.
FIG. 9. The performed tests: a) 4D-based System; b) Paper-based Reports; c) the first bridge; and d) the second case study bridge
4.1 Experiment Setup and Metrics Two bridges were considered as case studies in the performed tests (Table 1). The first bridge (Bridge A), was built in 1947. It consisted of 20 steel stringer spans with a reinforced concrete deck slab on steel single column bents and a reinforced concrete “L”-shaped abutment. The report for Bridge A contained 110 pages of text and drawings and 24 annual reports. The second bridge (Bridge B), was built in 1954 and was a 4-span continuous steel girder bridge on reinforced concrete column bents. It was widened in 1987 with precast pre-stressed I-beams also on reinforced concrete column bents. The report for Bridge B contained 131 pages of text and drawings and
ITcon Vol. 23 (2018), Zhang, pg. 293
24 annual reports. The two bridges were deliberately chosen to evaluate how the complexity of the bridge affects the results, where Bridge A is considered to be significantly more complex than Bridge B. TABLE 1. The description of the two case study bridges used for evaluation of the 4D-based system Bridge
Construction Date
Number of spans
Report length
Number of annual
Model
reports A
1947
20
110
24
Fig. 9c
B
1954
4
131
24
Fig. 9d
The 3D models were first built using the 2D drawings contained in the reports (Fig. 9c-d), and they were imported into the 4D-based system. Next, the element categories (e.g. Reinforced Concrete Bent, Steel Girders) were created based on the CALTRANS Bridge Maintenance Manual. Each element category contains information such as the condition ratings and the necessary repair tasks and their associated costs. Finally, every item recorded in the inspection and repair history was input into the 4D model, including the date, description, condition rating, element category, and repair cost. Each item is linked to its related 3D elements. Based on consultations with the CALTRANS experts, four tasks were designed such that they involve the extraction of a significant amount of information from previous maintenance records; they were also designed to imitate the real-life tasks performed by maintenance engineers. The description of each task is provided below: Task 1: the engineers were asked to plan an inspection route that traverses all noted conditions recorded in the previous year's report; the route starts from one end of the bridge, visits all those locations, and ends at the other end. This task was selected to test whether the integration of the location information with the 3D models improves the task duration, accuracy, efficiency, and consistency in route planning. To complete this task using the paperbased reports, an engineer needs to first find the location data in the text, mark the locations one by one on the 2D drawings, and then record the conditions. In the 4D-based test, the engineer first filters the data instances based on the year attribute, selects all the noted conditions, clicks on the highlighted 3D elements, and records their conditions. Fig. 8a illustrates the highlighted 3D elements considered in this task. Task 2: the engineers were given four conditions (such as observed small deck spalls in eastbound lane 2 of span 3, severe transverse cracks in the RC deck surface over span 5) and are asked if those conditions had already been recorded in a given year's report. If recorded, the engineer was to identify whether there were any changes in its condition compared with the previous year. This task was selected to test whether searching information using the hierarchy system available in the 4D software reduces task duration and increases accuracy, efficiency, and consistency compared to the paper-based documents. To complete this task using paper reports, an engineer needed to scan all the recorded conditions in a given year's report and locate conditions that matched those of the last year’s report. Using the 4D system, however, the engineers needs to select the elements within the 4D Hierarchy and determine if a condition was recorded for it. To achieve this, the user visually checks a pop-up dialog box showing all the maintenance records related to that element over time. Task 3: the engineers were asked to find the three element categories that incurred the most repair cost in the history of the bridge and write down the detailed repair activities for each. To complete this task using the paperbased reports, the engineers need to review the whole report and write down any recorded repair activities, classify each into an element category, sum the repair costs for each category, and identify the three categories with highest costs. Using the 4D software, the engineers access an automatically generated repair cost bar graph (Fig. 10a) to identify the top three element categories. They then sort the repair activities by element categories using the spreadsheet (Fig. 10b).
ITcon Vol. 23 (2018), Zhang, pg. 294
FIG. 10. Performing the third task using the 4D-based system: a) repair cost histogram and b) List of repair activities sorted by element category Task 4: the engineers were asked to record the condition history for the element category that incurred the most repair costs. This task was partially based on the results from Task 3. Both task 3 and task 4 were designed to test whether the flexible organization of information over different dimensions in the 4D system helps improve performance relative to the organization of paper-based reports. To perform this task using paper-based reports, the engineers review the entire report again and find and record the condition history related to the element category that incurred the most repair costs. In the 4D-based system, this is achieved by sorting the condition history spreadsheet by element categories and recording the related noted conditions. Three metrics were used to evaluate the engineers' performance in all tasks. They include 1) task duration, 2) accuracy, and 3) consistency. The accuracy was measured on a scale of 0-100 by identifying the percentage of a task’s items performed correctly; A total accuracy measure was also calculated for the bridge, where each task’s score was given a weight proportional to its duration. The consistency metric is measured in terms of the standard deviation of the engineers’ accuracy scores in each task; it can be a good indicator of each method’s reliability.
4.2 Results: Engineering Students The tests were conducted in two rounds. The first round was paper-based in which the engineers were divided into two groups (Table 2); each group was assigned to one of the bridges. The second round involved the same tasks but using the 4D-baed system; in this round, each group was assigned to a new bridge. In other words, the group of engineers performing paper-based tests for Bridge A conducted the 4D-based test for Bridge B. In the second round, two students dropped out of the 4D-based tests. TABLE 2. Group assignments for engineering students Group 1 Bridge
Task Type
Group 2 Number of participants
Bridge
Task Type
Number of participants
First round
A
Paper
6
B
4D
6
Second round
B
4D
5
A
Paper
5
The average task durations are shown for both paper- and 4D-based tests and for the Bridge A (Fig. 11a) and Bridge B (Fig. 11b). It is observed that the use of the 4D-based system reduces the duration of all tasks except Task 2, where the difference between paper- and 4D-based methods is negligible. The highest reduction in task duration is associated with Task 3 (Fig. 11), where the use of the 4D-based solution reduced the duration by a factor of 4. The use of the 4D-based system reduced the total duration by 55% and 47%, respectively for Bridge A and Bridge B. The effect of the 4D-based system on reduction of task duration was stronger in the more complex bridge.
ITcon Vol. 23 (2018), Zhang, pg. 295
FIG. 11. The tasks durations for a) bridge A, and b) bridge B [engineering students] The average accuracy rates are depicted for both Bridge A (Fig. 12a) and Bridge B (Fig. 12b). An overall accuracy is also calculated for each bridge by assigning weights to each task’s accuracy, where weights are proportional to the task durations. It is observed that the use of the 4D-based system resulted in increased accuracy rates in all tasks with the exception of Task 1 in Bridge B. The increase in accuracy is most significant in Task 3 and Task 4; this was the case for both bridges. It can also be observed that the average paper-based accuracy for the Bridge A is significantly lower than that of the Bridge B; this emphasizes the negative correlation between a bridge’s complexity and the accuracy of its paper-based test. Further, the use of the 4D-based technique was observed to be more effective in the more complex bridge (i.e., Bridge A). When using the 4D-based system, the overall accuracy was improved by 56% and 21%, respectively for Bridge A and Bridge B.
FIG. 12. The average accuracy rates for each task: a) Bridge A and b) Bridge B [engineering students] Consistency is defined in terms of the standard deviation of accuracy scores and is shown in Figures 13 for Bridge A and Bridge B, respectively. Consistency is used as an indicator of the reliability of using a methodology (either the 4D software or paper-based reports).
ITcon Vol. 23 (2018), Zhang, pg. 296
FIG. 13. The consistency measures for all tasks: a) Bridge A and b) Bridge B [engineering students] Based on the test results, the use of the 4D-based system was observed to reduce the inconsistency of accuracy rates in all tasks and for both bridges (Fig. 13). While engineers were expected to differ in terms of proficiency, the accuracy rates obtained using the 4D-based system were significantly more consistent than those obtained using paper-based reports. The accuracy and consistency of paper-based tests were both observed to be lowest in Task 3 and Task 4.
4.3 Results: CALTRANS Engineers The average task durations are shown in Fig. 14 for both bridges. The observed pattern is similar to the tests with the engineering students. Even though the CALTRANS maintenance engineers are highly familiar with paperbased reports, the use of the 4D-based system significantly reduced the task durations, where the highest reductions were observed for Task 3 and Task 4. The paper-based processes, however, appear to be less time consuming for CALTRANS engineers when performing Tasks 1 and 2 for the more complex bridge. The use of the 4D-based system for Bridge A was observed to reduce the task duration by 55% and 48% respectively for Tasks 3 and 4.
FIG. 14. The tasks durations for a) the bridge A, and b) bridge B [CALTRANS engineers] The results of the accuracy scores also showed a similar pattern to that from the test with the students (Fig. 15). Engineers using the 4D system achieved higher scores than those using the paper-based reports in all tasks except
ITcon Vol. 23 (2018), Zhang, pg. 297
Task 2 for Bridge A. A negative correlation is observed between the bridge’s complexity and the accuracy of paper-based tests. The use of the 4D-based system resulted in the highest increase in accuracy for Tasks 3 and 4; this effect was stronger in the case of the more complex bridge (i.e., bridge A). When switching from the paperbased to the 4D-based system, the accuracy of Tasks 3 and 4 was increased by 34% and 22% respectively. With the exception of Task 2, all tasks were performed 100% accurately when the 4D-based system was used.
FIG. 15. The average accuracy rates for each task: a) Bridge A and b) Bridge B [CALTRANS engineers]
FIG. 16. The standard deviation of accuracy rates for each task: a) Bridge A and b) Bridge B; c) the distribution of engineers’ accuracy scores [CALTRANS engineers] As shown in Fig. 16c, there appears to be less variation in the accuracy of engineers in the 4D-based processes. The use of the 4D-based system was observed to reduce the inconsistency of accuracy rates in all tasks except Task 2 for Bridge A. The improvement in the consistency due to the use of 4D was more significant in the more complex bridge (i.e., Bridge A).
5. DISCUSSION The use of a proposed 4D-based system was observed to result in significant improvements for all three metrics and both groups. The 4D-based system was observed to become more effective with increase in the complexity of the tasks and bridge design. In particular, both groups performed considerably better in Tasks 3 and 4 in the 4D-based tests. The effect of the 4D-based solution was inconsistent on the second task’s metrics. This can potentially be due to humans being good at scanning for a particular value within a short list of data instances. In contrast, in the last two tasks, the information is spread throughout the paper-based report; this requires engineers to review the entire document searching for a particular information. This paper-based process was highly time-consuming and error prone, thus
ITcon Vol. 23 (2018), Zhang, pg. 298
negatively affecting all metrics. The use of the 4D-based solution also improved the first task’s metrics due to the visualization and modeling of data over time; in paper-based reports, however, the engineers needed to frequently switch between the report and 2D drawings. Compared to conventional solutions, the proposed 4D-based technique facilitates easier access to various data categories and provides a more flexible and clearer visualization of data at an element level. The simulation and visualization of infrastructure conditions were implemented to help maintenance engineers better understand how the conditions of infrastructure evolve over time and identify locations of potential problems. The experiments suggest that both students and bridge engineers were able to perform routine maintenance tasks with increased accuracy, efficiency, and consistency when using the 4D-based maintenance information management system. The experiments also suggest that the maintenance engineers do not need more software training compared to engineering students. In the 4D-based system, all information related to a specific element is displayed when that element is selected. To select a specific element, one can find it either by navigating the 3D model and selecting it or by locating it in the 4D hierarchy (e.g., Fig. 2b) that organizes the bridge elements. However, in paper-based processes, there is limited access to the changes in data over time. For example, when interested in the condition history of an element such as a bridge’s slab, an engineer must look at each year’s full report and keep track of the condition on one's own. In the proposed solution, the maintenance information is also organized in spreadsheets. Thus, users can view the information in a user-defined order. For example, data instances can be ordered based on element categories or deficiency ratings by simply clicking on the column heading with that name. Spreadsheet organization also enables users to find the information they need with filters (Fig. 1a) such as the year filter, which allows the user to browse activities that occurred within a specified period of time. The global/local filters are also implemented allowing users to browse conditions which span the whole structure or part of it. Special functionalities are provided to help sum up the data in specific columns for analysis; this includes a functionality to accumulate the repair costs for different element categories and periods of time and a functionality that calculates the average condition for different element categories. Fig. 11a illustrates one such functionality. It is envisioned that the proposed framework can also be used to evaluate the life-cyclic impact of various maintenance scenarios. users may plan multiple maintenance scenarios and simulate the degradation under these scenarios to investigate the effectiveness of each. As an alternative approach to color-coding the elements, realistic colors could be used to represent the condition of bridge elements similar to some 3D modeling solutions. In other words, colors could be formulated to mimic the real objects in the world. However, the condition degradation of different materials may not necessarily be representable by the same color; hence, a separate color legend has to be developed for each material, making this visualization approach inefficient. Further, the use of realistic colors (i.e., based on actual site conditions) can potentially make it difficult for users to quickly analyze the overall condition and the degradation trends. The arrangement of color legends on the screen would also be an issue. The image-based visualization of as-is infrastructure conditions (Fig. 17b) and the visualization of defects detected using computer vision (Fig. 17c) are other alternatives to the proposed color-based approach. Such 4D-based maintenance management systems should take advantage of advances in vision-based condition assessment and vision-based defect detection.
FIG. 17. Data visualization for 4D-based system: a) using color; b) using digital images; c) using computer vision
ITcon Vol. 23 (2018), Zhang, pg. 299
Employing a 4D-based approach toward infrastructure maintenance management can potentially empower new data-driven applications because of the continuous integration of various data categories with 3D models over an infrastructure’s life cycle. The robust modeling of inspection data, for example, is proven to provide learning opportunities for organizations (Zangeneh et al. 2017). This necessitates focus on the utilization of the modeled data and also employing interoperable approaches toward information modeling by focusing on IFC (Kiviniemi et al. 2005) and IFC-BRIDGE (Yabuki et al. 2006; Yabuki and Li 2006).
5.1 Limitations and Future Work The experiments conducted in this work involved tasks that represent a portion of a maintenance engineer’s daily tasks. Future works need to evaluate the impact of using 4D-based solutions on a broader range of tasks. More research should be focused on the effect of 4D-based techniques on the maintenance data communication among maintenance engineers. The proposed method should be further tailored, implemented, and evaluated for other infrastructure systems and buildings. Other capabilities of the proposed solution that need to be evaluated include the visualization of infrastructure degradation through a project’s life-cycle and its effect on the decision-making processes. The environmental models integrated with the 4D-based system are currently time-invariant; future work should focus on the development of more realistic and time-dependent models using the same approach used in the implementation of the degradation models. Another area of potential improvement is the extension of the proposed solution to the construction phase and existing 4D-based solutions. A holistic view should be employed toward visualization and modeling of not only the maintenance data but also the construction, planning, and design information. This also emphasizes the need for more focus on the use of interoperable and open data exchange formats for such 4D-based maintenance management systems. While the introduced method focuses on the information modeling domain, its robust and life-cyclic use necessitates further integration with in-field data acquisition techniques. There is a need for solutions that can automate the site-to-model data transfer, while ensuring model integrity and modeling accuracy. Future integration with studies in computer vision-based defect detection (Adhikari et al. 2013; Koch et al. 2014), robotic data capture (Akutsu et al. 2016; Chen et al. 2016; Hamledari et al. 2017b; McCabe et al. 2017; Yan et al. 2016), automated development of as-built models (Hamledari et al. 2017c; Kim et al. 2013), and sensor data integration with bridge models (Delgado et al. 2016; Jeong et al. 2017; Jeong et al. 2016; McGuire et al. 2016) can highly benefit such 4D-based infrastructure maintenance systems. The proposed 4D-based system can be used to provide a spatiotemporal means of modeling and visualizing the as-is and as-built condition data collected by reality capture techniques. Solutions providing in-model photo registration (Park et al. 2017) can also benefit such 4D-based systems due to their capability of matching on-site observations with model elements.
6. CONCLUSION This paper presented a novel technique for life cyclic and spatio-temporal modeling of infrastructure data based on 4D technology. The application of 4D modeling has already proven beneficial during the construction phase, and it has the potential to provide an effective means of sustainable integration of various data categories with 3D models of an infrastructure facility over its life time. The proposed technique can support real-life maintenance tasks due to its integration of data categories such as inspection records, maintenance schedules and costs, and degradation models at an element level. The technique was evaluated in close collaboration with the California Department of Transportation (CALTRANS). It was observed that the technique supports real-life maintenance scenarios; further, the maintenance engineers were able to perform their daily tasks in nearly 50% less time and with 20-40% higher accuracy. Future research should focus on the integration of the proposed 4D-based system with solutions in the domains of reality capture, automated model updating, and computer vision-based condition assessment; this will further streamline the site-to-model communication of the data, reducing the modeling costs.
ITcon Vol. 23 (2018), Zhang, pg. 300
ACKNOWLEDGEMENT The authors extend their gratitude to Mr. Pete Whitfield, from the California Department of Transportation; Walt Disney Inc.; and CALTRANS engineers and Stanford engineering students who participated in this research. The authors are also grateful to Dr. Kincho Law, Dr. Jack Baker, and Dr. Jean-Claude Latombe from Stanford University for their constructive comments on the work. This research was financially supported by the Thomas V. Jones Stanford Graduate Fellowship, UPS Foundation, John A. Blume Fellowship, and Stanford School of Engineering Fellowship. The findings and opinions expressed in this paper do not necessarily represent the views of the individuals and organizations mentioned above.
REFERENCES Adhikari R. S., Moselhi, O., and Bagchi, A. (2013). "Image-based Change Detection for Bridge Inspection." Proc., 30th International Symposium on Automation and Robotics in Construction (ISARC 2013), August. Akinci B. (2015). "Situational Awareness in Construction and Facility Management." Frontiers of Engineering Management, 1(3), 283-289. Akinci B., Fischer, M., and Kunz, J. (2002). "Automated generation of work spaces required by construction activities." Journal of construction engineering and management, 128(4), 306-315. Akutsu A., Sasaki, E., Takeya, K., Kobayashi, Y., Suzuki, K., and Tamura, H. (2016). "A comprehensive study on development of a small-sized self-propelled robot for bridge inspection." Structure and Infrastructure Engineering, 1-12. ASCE (2017). "ASCE 2017 Report Card for America's Infrastructure ".http://www.infrastructurereportcard.org/ Chau K., Anson, M., and Zhang, J. (2004). "Four-dimensional visualization of construction scheduling and site utilization." Journal of construction engineering and management, 130(4), 598-606. Chen J., Wu, J., Chen, G., Dong, W., and Sheng, X. (2016). "Design and Development of a Multi-rotor Unmanned Aerial Vehicle System for Bridge Inspection." Proc., International Conference on Intelligent Robotics and Applications, Springer, 498-510. Cheng M.-Y., and Chang, N.-W. (2018). "Dynamic construction material layout planning optimization model by integrating 4D BIM." Engineering with Computers, 1-18. Darbani B. M., and Hammad, A. (2007). "Critical review of new directions in bridge management systems." Computing in Civil Engineering (2007), 330-337. Delgado J. D., Brilakis, I., and Middleton, C. (2016). "Modelling, management, and visualisation of structural performance monitoring data on BIM." Proc., Transforming the Future of Infrastructure through Smarter Information-Proceedings of the International Conference on Smart Infrastructure and Construction, ICSIC 2016, 543-549. Estes A. C., and Frangopol, D. M. (2003). "Updating bridge reliability based on bridge management systems visual inspection results." Journal of Bridge Engineering, 8(6), 374-382. Fischer M., Ashcraft, H. W., Khanzode, A., and Reed, D. (2017). Integrating project delivery, John Wiley & Sons. Fischer M., Haymaker, J., Liston, K., Issa, R., Flood, I., and O’Brien, W. (2003). "Benefits of 3D and 4D models for facility managers and AEC service providers." 4D CAD and visualization in constructiondevelopments and applications, 1-32. Fischer M., and Kunz, J. (2004). "The scope and role of information technology in construction." Proc., Proceedings-Japan Society of Civil Engineers, DOTOKU GAKKAI, 1-32. Flint M. M., Baker, J. W., and Billington, S. L. (2014). "A modular framework for performance-based durability engineering: From exposure to impacts." Structural Safety, 50, 78-93. Frangopol D. M., Dong, Y., and Sabatino, S. (2017). "Bridge life-cycle performance and cost: analysis, prediction, optimisation and decision-making." Structure and Infrastructure Engineering, 13(10), 12391257.
ITcon Vol. 23 (2018), Zhang, pg. 301
Frangopol D. M., Kong, J. S., and Gharaibeh, E. S. (2001). "Reliability-based life-cycle management of highway bridges." Journal of computing in civil engineering, 15(1), 27-34. Frangopol D. M., Strauss, A., and Kim, S. (2008). "Bridge reliability assessment based on monitoring." Journal of Bridge Engineering, 13(3), 258-270. Garcia-Lopez N. P., and Fischer, M. (2014). "A System to Track Work Progress at Construction Jobsites." Proc., Proceedings of the 2014 Industrial and Systems Engineering Research Conference. Garrett J., James H (2005). "Advanced infrastructure systems: Definitions, vision, research and responsibilities." Computing in Civil Engineering (2005), 1-15. GhaffarianHoseini A., Zhang, T., Nwadigo, O., GhaffarianHoseini, A., Naismith, N., Tookey, J., and Raahemifar, K. (2017). "Application of nD BIM Integrated Knowledge-based Building Management System (BIM-IKBMS) for inspecting post-construction energy efficiency." Renewable and Sustainable Energy Reviews, 72, 935-949. Gledson B. J., and Greenwood, D. (2017). "The adoption of 4D BIM in the UK construction industry: an innovation diffusion approach." Engineering, Construction and Architectural Management, 24(6), 950967. Hallberg D., and Tarandi, V. (2011). "On the use of open bim and 4d visualisation in a predictive life cycle management system for construction works." Journal of Information Technology in Construction (ITcon), 16(26), 445-466. Hamledari H., Davari, S., Azar, E. R., McCabe, B., Flager, F., and Fischer, M. (2017b). "UAV-Enabled Site-toBIM Automation: Aerial Robotic-and Computer Vision-Based Development of As-Built/As-Is BIMs and Quality Control." Proc., Construction Research Congress 2018, 336-346. Hamledari H., McCabe, B., Davari, S., and Shahi, A. (2017a). "Automated Schedule and Progress Updating of IFC-Based 4D BIMs." Journal of Computing in Civil Engineering, 04017012. Hamledari H., Rezazadeh Azar, E., and McCabe, B. (2017c). "IFC-based development of as-built and as-is BIMs using construction and facility inspection data: site-to-BIM data transfer automation." Journal of Computing in Civil Engineering, 32(2), 04017075. Hammad A., and Motamedi, A. (2007). "Framework for lifecycle status tracking and visualization of constructed facility components." Proc., 7th International Conference on Construction Applications of Virtual Reality, 224-232. Hammad A., Zhang, C., Hu, Y., and Mozaffari, E. (2006). "Mobile model-based bridge lifecycle management system." Computer-aided civil and infrastructure engineering, 21(7), 530-547. Hartmann T., Gao, J., and Fischer, M. (2008). "Areas of application for 3D and 4D models on construction projects." Journal of Construction Engineering and management, 134(10), 776-785. Hjelmstad K., Lange, D., Parsons, I., and Lawrence, F. (1996). "Mathematical model for durability of cladding." Journal of materials in civil engineering, 8(3), 172-174. Hüthwohl P., Brilakis, I., Borrmann, A., and Sacks, R. (2018). "Integrating RC Bridge Defect Information into BIM Models." Journal of Computing in Civil Engineering, 32(3), 04018013. Jeong S., Hou, R., Lynch, J. P., Sohn, H., and Law, K. H. (2017). "A distributed cloud-based cyberinfrastructure framework for integrated bridge monitoring." Proc., SPIE Smart Structures and Materials+ Nondestructive Evaluation and Health Monitoring, International Society for Optics and Photonics, 101682W-101682W-101689. Jeong S., Hou, R., Lynch, J. P., Sohn, H., and Law, K. H. (2017). "An information modeling framework for bridge monitoring." Advances in engineering software, 114, 11-31. Jeong S., Zhang, Y., O’Connor, S., Lynch, J. P., Sohn, H., and Law, K. H. (2016). "A NoSQL data management infrastructure for bridge monitoring." Smart Structures and Systems, 17(4), 669-690. Kamat V. R., Martinez, J. C., Fischer, M., Golparvar-Fard, M., Peña-Mora, F., and Savarese, S. (2010). "Research in visualization techniques for field construction." Journal of construction engineering and management, 137(10), 853-862.
ITcon Vol. 23 (2018), Zhang, pg. 302
Kasireddy V., and Akinci, B. (2015). "Challenges in Generation of As-is Bridge Information Model: A Case Study." Proc., ISARC. Proceedings of the International Symposium on Automation and Robotics in Construction, Vilnius Gediminas Technical University, Department of Construction Economics & Property, 1. Kim C., Kim, B., and Kim, H. (2013). "4D CAD model updating using image processing-based construction progress monitoring." Automation in Construction, 35, 44-52. Kim C., Kim, H., Park, T., and Kim, M. K. (2010). "Applicability of 4D CAD in civil engineering construction: case study of a cable-stayed bridge project." Journal of Computing in Civil Engineering, 25(1), 98-107. Kiviniemi A., Fischer, M., and Bazjanac, V. (2005). "Integration of multiple product models: Ifc model servers as a potential solution." Proc., Proc. of the 22nd CIB-W78 Conference on Information Technology in Construction. Klatter H., Van Noortwijk, J., and Van Eck, N. V. (2002). "Bridge management in the Netherlands; Prioritisation based on network performance." Proc., First international conference on bridge maintenance, safety and management (IABMAS), Barcelona, Spain, Citeseer, 14-17. Koch C., Paal, S. G., Rashidi, A., Zhu, Z., König, M., and Brilakis, I. (2014). "Achievements and challenges in machine vision-based inspection of large concrete structures." Advances in Structural Engineering, 17(3), 303-318. Koo B., and Fischer, M. (2000). "Feasibility study of 4D CAD in commercial construction." Journal of construction engineering and management, 126(4), 251-260. Kumar S. S., and Cheng, J. C. (2015). "A BIM-based automated site layout planning framework for congested construction sites." Automation in Construction, 59, 24-37. Lin J. J., and Golparvar-Fard, M. (2018). "Visual Data and Predictive Analytics for Proactive Project Controls on Construction Sites." Proc., Workshop of the European Group for Intelligent Computing in Engineering, Springer, 412-430. Lopez R., Chong, H.-Y., Wang, X., and Graham, J. (2015). "Technical review: analysis and appraisal of fourdimensional building information modeling usability in construction and engineering projects." Journal of Construction Engineering and Management, 142(5), 06015005. Love P. E., and Li, H. (2000). "Quantifying the causes and costs of rework in construction." Construction Management & Economics, 18(4), 479-490. McCabe B., Hamledari, H., Shahi, A., Zangeneh, P., and Rezazadeh Azar, E. (2017). "Roles, Benefits, and Challenges of Using UAVs for Smart Construction Applications." Proc., International Workshop on Computing in Civil Engineering McGuire B., Atadero, R., Clevenger, C., and Ozbek, M. (2016). "Bridge information modeling for inspection and evaluation." Journal of Bridge Engineering, 21(4), 04015076. Melchers R. E. (2003). "Probabilistic model for marine corrosion of steel for structural reliability assessment." Journal of Structural Engineering, 129(11), 1484-1493. Minchin Jr R. E., Zayed, T., Boyd, A. J., and Mendoza, M. (2006). "Best practices of bridge system management—A synthesis." Journal of Management in Engineering, 22(4), 186-195. Morcous G., Rivard, H., and Hanna, A. (2002). "Case-based reasoning system for modeling infrastructure deterioration." Journal of computing in civil engineering, 16(2), 104-114. Nepal M. P., Staub-French, S., Pottinger, R., and Zhang, J. (2012). "Ontology-based feature modeling for construction information extraction from a building information model." Journal of Computing in Civil Engineering, 27(5), 555-569. Park J., Cai, H., Dunston, P. S., and Ghasemkhani, H. (2017). "Database-supported and web-based visualization for daily 4D BIM." Journal of Construction Engineering and Management, 143(10), 04017078. Park J., Cai, H., and Perissin, D. (2017). "Bringing Information to the Field: Automated Photo Registration and 4D BIM." Journal of Computing in Civil Engineering, 32(2), 04017084.
ITcon Vol. 23 (2018), Zhang, pg. 303
Parlikad A. K., and Catton, P. (2018). "Infrastructure Information Management of Bridges at Local Authorities in the UK." Infrastructure Asset Management, 1-42. Reinhardt J., Akinci, B., and Garrett Jr, J. H. (2004). "Navigational models for computer supported project management tasks on construction sites." Journal of Computing in Civil Engineering, 18(4), 281-290. Sacks R., Kedar, A., Borrmann, A., Ma, L., Singer, D., and Kattel, U. (2016). "SeeBridge Information Delivery Manual (IDM) for Next Generation Bridge Inspection." Proc., ISARC. Proceedings of the International Symposium on Automation and Robotics in Construction, Vilnius Gediminas Technical University, Department of Construction Economics & Property, 1. Shirole A. M., Chen, S. S., and Puckett, J. A. (2008). "Bridge information modeling for the life cycle: progress and challenges." Son H., Kim, C., and Kwon Cho, Y. (2017). "Automated schedule updates using as-built data and a 4D building information model." Journal of Management in Engineering, 33(4), 04017012. Song K., Pollalis, S., and Pena Mora, F. (2005). "Project Dashboard: Concurrent visual representation method of project metrics on 3D building models." Proc., Proc., Int. Conf. on Computing in Civil Engineering, ASCE, Reston, VA. Tuttas S., Braun, A., Borrmann, A., and Stilla, U. (2017). "Acquisition and consecutive registration of photogrammetric point clouds for construction progress monitoring using a 4D BIM." PFG–Journal of Photogrammetry, Remote Sensing and Geoinformation Science, 85(1), 3-15. Yabuki N., Lebegue, E., Gual, J., Shitani, T., and Zhantao, L. (2006). "International collaboration for developing the bridge product model IFC-Bridge." Proc., Proc. of the 11th Int. Conf on Computing in Civil and Building Engineering. Yabuki N., and Li, Z. (2006). "Development of new IFC-BRIDGE data model and a concrete bridge design system using multi-agents." Intelligent Data Engineering and Automated Learning–IDEAL 2006, 12591266. Yan Y., Gulder, B., Yider, L., Kasireddy, V., Huber, D., Scherer, S., and Hajjar, J. (2016). "Automated Damage Detection and Structural Modelling with Laser Scanning." the Structural Stability Research Council Annual Stability Conference, Orlando, Florida. Zangeneh P., McCabe, B., Pearson, A., and Mason, N. (2017). "Representation and Management of Project's Knowledge- a Linked Data Approach." Proc., 6th CSCE/CRC International Construction Specialty Conference. Zhang J., and Hu, Z. (2011). "BIM-and 4D-based integrated solution of analysis and management for conflicts and structural safety problems during construction: 1. Principles and methodologies." Automation in construction, 20(2), 155-166.
ITcon Vol. 23 (2018), Zhang, pg. 304