Published December 5, 2014
Providing User-Oriented Uncertainty Information with a Vineyard Model Used for Irrigation Decisions Sébastien Roux, Xavier Delpuech, Gabriel Daudin, François Brun, Jacques Wery, and Daniel Wallach*
Abstract In southeastern France, vineyard irrigation has been increasing and now concerns about 8% of the total vineyard area in the region. Irrigation management aims to ensure both fruit quality and yield by maintaining the vineyard above a time-dependent threshold of soil water. Extension services disseminate information and advice on vineyard irrigation, based in large part on the WaLIS (Water Balance for Intercropped Systems) model described here, which computes the fraction of transpirable soil water of a vineyard with or without an intercrop. Extension bulletins currently report model results, but the extension services have indicated that adding uncertainty information would be important for informing users as to the reliability of those results. We show how uncertainty information could be calculated and presented. The major focus here is on the uncertainty due to using estimated rather than measured input variables, taking into account the way users estimate the input variables in practice. This is the source of uncertainty most relevant for users because it is an uncertainty that they can affect. However, it is also important to know how this uncertainty compares with the overall uncertainty in the predictions. We therefore also show how total uncertainty can be estimated.
Abbreviations: PLWP, predawn leaf water potential; WaLIS, Water Balance for Intercropped Systems. Sébastien Roux, INRA, UMR System, 2 Place Pierre Viala, 34060 Montpellier Cedex 2, France (sebastien.roux@ supagro.inra.fr). Xavier Delpuech, Institut Français de la Vigne et du Vin, Pôle Rhône-Méditerranée, Domaine de Donadille 30230 Rodilhan, France (
[email protected]). Gabriel Daudin, Vita Consult, ZA du Pré Neuf, 19 rue du Pré Neuf, 44190 Gorges, France (
[email protected]). François Brun, ACTA, INRA, UMR 1248 AGIR, 24 Chemin de Borde Rouge - Auzeville, CS 52627, 31326 Castanet Tolosan, Cedex, France (
[email protected]). Jacques Wery, Montpellier SupAgro, UMR System, 2 Place Pierre Viala, 34060 Montpellier Cedex 2, France (
[email protected]). Daniel Wallach, INRA, UMR 1248 AGIR, 24 Chemin de Borde Rouge - Auzeville, CS 52627, 31326 Castanet Tolosan, Cedex, France. *Corresponding author (
[email protected]). doi:10.2134/advagricsystmodel5.c8 Copyright © 2014. ASA, CSSA, SSSA, 5585 Guilford Rd., Madison, WI 53711-5801, USA. Practical Applications of Agricultural System Models to Optimize the Use of Limited Water Lajpat R. Ahuja, Liwang Ma, and Robert J. Lascano, Editors Advances in Agricultural Systems Modeling, Volume 5. Lajpat R. Ahuja, Series Editor
183
USDA-ARS
T
he administrative regions Languedoc-Roussillon and Alpes Côtes d’Azur
in southeastern France have been producing grapes (Vitis L.) for wine
since well before the Roman conquest. Today these regions represent 41.6% of the
vineyards in France, covering 326,880 ha (RGA, 2010). This area has a Mediterranean climate, with summers that can be very dry. Severe summer drought can reduce yield and affect the development of the grapes, leading to economic losses. As a result, there has been increasing use of irrigation on vineyards in this region. The irrigated area increased by 88% between 2000 and 2010, up to 25,298 ha (RGA, 2000, 2010), which is about 8% of the total vineyard area in the region and represents almost 90% of the total irrigated vineyard area in France. Irrigation will probably continue to expand if, as expected, the frequency of droughts in the Mediterranean area increases over the 21st century (Soubeyroux et al., 2011). The goal of vineyard irrigation is to ensure both fruit quality and yield. However, yield and quality are to some extent contradictory: some water stress is required for high quality, but this reduces yield somewhat. To limit vegetative development and control the formation of the yield and quality of grapes, the water availability should be limited, and a moderate water stress should be experienced by grapevines after blooming (Ojeda, 2007). There are studies that recommend a detailed time course of water status, with different recommendations depending on the type of wine to be produced. To implement these recommendations, it is necessary to have information about the water status of the soil–plant system. While soil moisture probes or pressure chambers for measuring plant water status are available, these are expensive and time consuming. Therefore, a water balance model was developed to simulate soil water in vineyards (Lebon et al., 2003). This model has been in use by advisory services in southwestern France since 2004, after being approved by the French Institute of Vine and Wine (IFV). Currently, the model is used by several extension services that base their irrigation advice to a significant extent on the model results. The vineyard model as currently used provides a unique value of soil moisture at each time representing the average soil water status sensed by the root system (Pellegrino et al., 2005). There is no information about the uncertainty associated with the simulated values. However, the extension services have indicated that adding uncertainty information to the model would be useful and that they would prefer to have such information. It would allow both the extension ser-
185
186
Roux et al.
vices and the growers who use their advice to better evaluate the confidence that they should have in the model results, before making a decision about irrigation. It seems then important to include a measure of uncertainty in model results. In a previous study, we showed how to estimate overall uncertainty for the vineyard soil water model (Roux et al., 2014). The emphasis there was on the methodology of estimating the different contributions to overall uncertainty. The purpose here is to extend that study to the case where multiple inputs to the vineyard model are approximated. The major new problems that arise are to identify the types of approximation that are used in practice, to quantify the uncertainty that each approximation entails, and to show how to evaluate the contributions of those uncertainties to overall uncertainty. This is a specific application of the general recommendation that modeling should include estimation of the reliability of the simulations (Jakeman et al., 2006; Bellocchi et al., 2010; Wallach et al., 2014; Bennett et al., 2013). In this paper we describe the model and the way it is used as a decision support tool currently by extension services, or could be used by growers in the future, as well as the data used in the examples presented here. We then explain the methodology, with emphasis on quantifying the uncertainty in the model input variables that corresponds to the way the model is really used and evaluating the consequences of that uncertainty. Finally, we present the results of uncertainty calculations and present the discussion and conclusions.
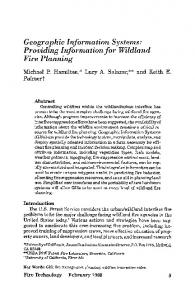
MODEL, MODEL USE, AND DATA Vineyard Soil Water Model The WaLIS model used in this study is a recent extension of the one used by farmer advisors and described in Lebon et al. (2003). The two models are based on the same principles, but WaLIS has additional parameters to take into account intercrop and runoff processes (Celette et al., 2010). The model extension was developed and evaluated using data from a site near Montpellier (Domaine du Chapitre) in the South of France. Additional data have been collected and used for a more extended evaluation study (Delpuech et al., 2010; Roux et al., 2014). The model is available at http://walis.vignevin.com/. The model computes the fraction of transpirable soil water (Pellegrino et al., 2005) as a function of time [FTSW(t)] using a daily water balance and estimates of the main daily water fluxes (Fig. 8–1). The FTSW(t) is often used as the indicator of the level of water deficit experienced by a vineyard (Pellegrino et al., 2006). The model parameters are shown in Table 8–1 and the input variables in Table 8–2.
Providing User-Oriented Uncertainty Information with a Vineyard Model
187
Fig. 8–1. Schematic diagram of the vineyard soil water model. The model outputs fraction transpirable soil water over time [FTSW(t)], starting at budburst. Table 8–1. Model parameters. Parameter name
Description
Value
b1,b2 U s1bare, s2bare s1cover, s2cover ddkmax WT
soil evaporation parameters soil surface water volume threshold parameters threshold parameters degree days to get maximum crop coefficient parameter to describe effect of water stress on transpiration 1
14, 0.15 2.7 12.7, 28 35.6, 53 600 0.4
grass initial leaf area (LAI) index grass LAI growth rate parameter duration of grass green leaves (DD) parameter to describe effect of water stress on grass LAI growth parameter to describe effect of water stress on grass transpiration grass nitrogen nutrition index grass extinction coefficient
0.3 0.9 700 0.9
grass maximum light interception grass LAI threshold to trigger grass cover cut grass LAI after grass cut
0.95 3 0.3
Maximum effective depth for grass roots LAI0 LAIrate LSSmin Wig,1 Wig,1 NNI e kgmax LAIcut LAIres
pg
0.6 0.3 0.6
188
Roux et al.
Table 8–2. Model input variables. Variables†
Definition
R(t)*, T(t)*, ETP(t)* CNcover*** CNbare*** kmax* TTSWtot** FTSW0** pic* dbud*
daily rainfall, mean temperature, and reference evapotranspiration curve number for soil with cover curve number for bare soil maximum vineyard light interception fraction maximum total transpirable water fraction transpirable water at budburst proportion of soil covered by grass date of budburst
† The number of stars indicates the relative difficulty of using the reference method to obtain this input (*, easiest; ***, most difficult), based on responses of extension personnel to questionnaire.
The water balance is based on the assumption that the soil of an intercropped vineyard can be represented by two reservoirs, the first with only grapevine roots and the other with both intercrop and grapevine roots. The size of the second reservoir is proportional to the proportion of soil covered by grass; if there is no intercrop, the size of the second reservoir is 0 and only one reservoir is used. The two reservoirs are characterized by their transpirable water content at each time t, ASW1(t) and ASW2(t), and their maximum transpirable water content TTSW1 and TTSW2. Total transpirable water content for the vineyard is TTSWtot = TTSW1 + TTSW2. The fraction of transpirable soil water content at time t is FTSW ( t ) = éê ASW1( t ) + ASW2 ( t )ùú / TTSWtot ë û
[1]
ASW1(t) and ASW2(t) are calculated by updating the water content of the previous day using the daily water fluxes computed by submodules:
{ } ASW2 ( t ) = max {0,min êé TTSW2,ASW2 ( t - 1) + Sum ( Fluxes {t - 1, t ,2 })ùú } ë û
ASW1( t ) = max 0,min êé TTSW1,ASW1( t - 1) + Sum ( Fluxes {t - 1, t ,1})úù ë û
[2]
The fluxes involved in Eq. [2] are (i) rain, (ii) runoff (from bare soil or soil covered by intercrop), (iii) bare soil evaporation, (iv) intercrop evapotranspiration, (v) vineyard transpiration, (vi) drainage from reservoir 2 to reservoir 1, and (vii) drainage out of reservoir 1. The detailed expressions for computing these fluxes can be found in Celette et al. (2010). Parameters for soil evaporation come from Lebon et al. (2003), and the parameters related to grass growth come from Duru et al. (2009). The model calculates FTSW(t) but can also output predawn leaf water potential (PLWP), which is calculated from FTSW(t) (Pellegrino et al., 2005).
Providing User-Oriented Uncertainty Information with a Vineyard Model
189
Model Use and Role of Uncertainty Information The model is used by researchers, engineers of the French Vine and Wine Institute, and extension services to evaluate the water stress experiences by vineyards during the growing season (Pellegrino et al., 2006; Ripoche et al., 2011; Gaudin and Gary, 2012; Delpuech et al., 2010). A major use of the model is as an aid to irrigation decisions. There is a recommended threshold for FTSW(t) or for PLWP, below which irrigation is required. The threshold depends on the growth stage of the crop, expressed as days after budburst. Simulated FTSW(t) or PLWP are compared with the threshold, and when the simulated values fall below the threshold, irrigation is recommended. Several threshold functions have been proposed (Ojeda, 2007; Gary et al., 2005). We use here the thresholds proposed by Gaudin and Gary (2012). The model has been in routine use for several years by multiple extension services, including the Agricultural Bureaux (Chambres d’Agriculture) of the French departments Aude, Bouches-du-Rhône, Drôme, Gard, and Vaucluse, the center for regional agrometeorolocal information (CIRAME), and the center for wine research (CRVI) of Corsica. Consider the case of the Gard department. The model is run weekly to simulate six to eight vineyards that are representative of a variety of conditions in the region. The results of the model, and an interpretation in terms of irrigation, are in a weekly bulletin made available to growers. Figure 8–2 shows a graph from one of these bulletins. The graph shows simulated PLWP for each test vineyard, up to the current date (25 June in this case), and also
Fig. 8–2. Example of simulation results, as presented in a weekly bulletin issued by the Gard agricultural bureau. The four solid lines are simulation results from four vineyards. The model calculates FTSW(t), but those values have been translated into predawn leaf water potential values, which is are familiar to extension services, using the relationship established by Pellegrino et al. (2005). Values in the lowest shaded area would indicate that the threshold for acceptable water stress has been passed and irrigation is required. Note that the threshold varies (toward lower leaf water potentials) as the season advances. The lowest simulation curve has not yet crossed the threshold at the time of the bulletin, but it is quite close.
190
Roux et al.
the time varying threshold below which irrigation is recommended. The PLWP is preferred here, in place of FTSW from which it is calculated, because it is more familiar to extension services and farm advisers who can also access it with direct measurement. For one of the test vineyards, the simulated PLWP at the current date is quite close to the threshold. The commentary focuses on the distance from the simulated curve to the threshold. However, the interpretation of the results is more in terms of trends than of detailed recommendations. For example, for the simulated field with the lowest FTSW, the commentary reads “even though the vineyard currently seems to still be growing or near the end of vegetative growth, the level of water reserves in the soil is likely to be low and the water situation needs to be followed closely.” Furthermore, the bulletin stresses that growers should make decisions based on observations in their own fields. Thus, the model is a decision aid, an important part of the extension message, but it is not used to directly trigger irrigations. To better understand user practices and needs, extension personnel involved with using the model were given a questionnaire that included questions about their perception of the uncertainty in the model predictions. Their estimates of uncertainty were very variable, ranging from “slight” to 75%. The perceived causes of the uncertainty included uncertainties in the model parameters, in the model equations, and in the value of initial FTSW(t) furnished to the model. When asked if they would prefer that the model produce a single value or an envelope of possible values, the clear majority indicated that they prefer an envelope. Paraphrasing one of the responses, the reason is that providing uncertainty would allow one to know how much confidence to have in the model results. In a similar vein, another response was that showing the uncertainty would make it clear to growers that the results are only approximate and that therefore the conclusions about irrigation based on the model are only approximate. This shows that the model users here, the extension personnel, would prefer that uncertainty information be added to the model results. In the future, one could envision making the model available to individual growers so that the results would be specific to each vineyard. In this case uncertainty information would probably be even more important in order to clearly indicate the reliability of the simulated values. Once uncertainty information becomes available, it seems reasonable to suppose that users will seek ways of reducing the uncertainty. Much of the uncertainty in model predictions depends on the model and cannot be reduced by the model user. This includes uncertainty due to uncertainty in the model equations and in the model parameters and uncertainty due to the model residual error, that is, due to the fact that the model input variables do not explain all the variability between
Providing User-Oriented Uncertainty Information with a Vineyard Model
191
vineyards. However, there is an additional source of uncertainty that does depend on the user—the uncertainty due to uncertainty in the model input variables. That contribution to model uncertainty can be reduced by obtaining more accurate values for the model inputs. However, there is usually a cost involved in obtaining more accurate values. For example, one might have a single weather station for multiple vineyards, so that the weather data is not exactly the weather at each vineyard. To obtain more accurate weather data, one could install weather stations at each vineyard, but of course there is an associated cost. There is thus a trade-off between reducing uncertainty in simulated values and cost. To make a decision about investment in better input values, one would want information about the levels of uncertainty with and without the additional investment. This is a different kind of uncertainty information, concerning the average effect on uncertainty of obtaining more accurate input values.
Data The data that were used to estimate errors here are from two locations in a Mediterranean environment (Corbane et al., 2012; Celette et al., 2009a). One location, Domaine du Chapitre (http://www.domaine-du-chapitre.com/), with data from 3 yr (2004–2006), has a clay soil with depth greater than 3 m. The second location, with data from 2 yr (2001 and 2002), has a sandy loam soil of 1.2-m depth. In each case, part of the vineyard had grass between the rows and the other part had bare soil, obtained with chemical weed control. Overall then there were 10 site-year grass cover combinations. In each of these plots, all of the input variables were measured according to the reference method indicated below, and FTSW(t) was measured at multiple dates using the approach of Pellegrino et al. (2005). These are the same data as used in Roux et al. (2014). To illustrate the uncertainty calculations, we do the calculations for the Domaine du Chapitre with bare soil, for 2 yr. The 2 yr had quite different winter and spring rainfall patterns. Rainfall was high in 2004 (1110 mm between 10 Jan. 2003 and 4 Jan. 2004) and low in 2006 (435 mm over the same period).
UNCERTAINTY ESTIMATION Principles We first define more precisely what we mean by uncertainty. This is a statistical notion and is measured by the probability distribution of simulation errors, that is, of the difference between observed and simulated FTSW(t). When this probability distribution is wide, the difference between observed and simulated values can be large and we say that there is a large amount of uncertainty. When the probability distribution of model errors is concentrated close to 0, then the
192
Roux et al.
simulated and observed values are always close and we say that there is little uncertainty. Note that this implies that we have defined some target population, that is, some range of situations that are of interest. The probability distribution of errors refers to errors for vineyards in this target population. In our case the population is vineyards in southeastern France, with or without grass cover. Following Roux et al. (2014), we can write the error as
(
)
ˆ errori ( t ) = FTSWi ( t ) - FTSW t ,Tˆi , Xi ; q
[3]
where FTSWi(t) is the observed value of FTSW in vineyard i at time t, and
(
ˆ FTSW t ,Tˆi , Xi ; q
)
is the corresponding simulated value. The simulated value
depends on Tˆ , which represents those input variables that are approximated, on X, which represents those input values that are measured, and on q, which are the model parameters. The error can be written as the sum of two terms as follows:
(
)
ˆ FTSWi ( t ) - FTSW t ,Tˆi , Xi ; q = e i ( t ) + t i ( t ) ˆ e i ( t ) = éê FTSWi ( t ) - FTSW ( t ,Ti , Xi ; q )ùûú ë ˆ ˆ t i ( t ) = éê FTSW t ,Tˆi , Xi ; q (t ,Ti , Xi ; q ) - FTSW ë
(
)
[4]
ù úû
The first term, e i(t), is the error for measured inputs. It is the difference between measured FTSW and the simulated value using measured values of all ˆ input variables, FTSW ( t ,Ti , Xi ; q ) . The error here comes from errors in the equations and in the parameter values and from model residual error but not from errors in the input variables. We assume that the probability distribution of e i(t), denoted by f E(e), does not depend on t, Ti, or Xi. In general there is simply not enough past data to do better. Furthermore, in a previous study, there was no obvious dependence of the distribution of e i(t) on t. The distribution of errors in hindcasts is taken as our estimate of the distribution of e i(t). Put another way, we take the distribution of past errors as our approximation to the distribution of future errors. Note however that the hindcasts must concern vineyards from the target population. Furthermore, the hindcast errors must be between observed values and simulated values where all inputs were measured, since e i(t) is the simulation error for measured inputs. The second term in Eq. [2], ti(t), is the error due to approximating inputs. It is the difference between simulated values using measured values for the inputs
Providing User-Oriented Uncertainty Information with a Vineyard Model
193
T and simulated values using approximate values for the inputs T. It depends on the difference between measured and approximate values of the input variables T, denoted by h i for vineyard i, h i = Ti - Tˆi [5]
and on the way errors in T propagate through the model and finally affect FTSW(t). The distribution of h i will depend in detail on the way the inputs are estimated (see next section). Given that distribution, one can then do a Monte Carlo calculation to obtain the distribution of ti(t). We assume that the e i(t) and h i are all mutually independent [and therefore the e i(t) and the ti(t) are mutually independent]. This assumption will not be exactly true if some of the approximations to the input variables are based on the model. In that case the errors in the input variables and in the model will be related. Finally, one can obtain the overall uncertainty in the model outputs for vineyard i, as follows: 1. Draw a value from the distribution of h i.
(
)
ˆ 2. Run the model to obtain the simulated value FTSW t , h i + Tˆi , Xi ; q .
3. Add to the simulated value a value drawn at random from the distribution of e i(t). 4. Repeat steps 1 to 3 multiple times (in our case 500). 5. The distribution of the results is an approximation to the distribution of ˆ FTSWi ( t ) - FTSW t ,Tˆi , Xi ; q . Confidence intervals of level a are obtained by removing the largest and smallest (100 - a)/2% of the generated values.
(
)
Application to the Vineyard Soil Moisture Model Reference Method for Measuring Input Variables The method of measurement for each of the input variables (the “reference” method) is explained below. This is the method that is used to obtain the measured value for each input variable Ti. ·· Climate data (R, T, ETP): The reference method is to measure weather vari-
ables at the location of the vineyard.
·· Curve number (CNcover, CNbare): Runoff in the model is taken into account
using the curve number approach (Boughton 1989). If there is an intercrop then two values are required, one for bare soil and one for intercrop. The reference procedure is to measure runoff under various conditions and then work back to deduce the curve number.
194
Roux et al.
·· Maximum vineyard light interception fraction (kmax): The reference pro-
cedure here is to use a radiation model (Riou et al., 1989) that estimates the maximum light interception fraction (ratio of intercepted over incident light) of a vineyard using its geographical location, row spacing and orientation, and foliage shape (width and height). The calculation is available at http://walis.vignevin.com/kmax/.
·· Maximum total transpirable water (TTSWtot): The reference method of
obtaining this value (described in Pellegrino et al., 2005) is to use a moisture probe a few days after heavy rain and also after prolonged drought. The difference in soil water contents gives TTSWtot.
·· Fraction transpirable water at budburst (FTSW0): The reference method here
is to use a moisture probe to measure soil moisture at budburst.
Approximate Methods for Obtaining Input Variables For each of the input variables that are difficult to measure, we define a simpler method which can be used to approximate the input. ·· Climate data (R, T, ETP): The approximate procedure consists of using
weather data from neighboring weather stations.
·· Curve number (CNcover, CNbare): An approximate procedure is to estimate
curve number from soil group and ground cover (USDA–NRCS, 2007) (see Table 8–3).
·· Maximum vineyard light interception fraction (kmax): An approximation
can be obtained using Table 8–4, which relates kmax to vigor and plant height. This table was obtained by running the radiation model with multiple plant heights and vigor values.
·· Maximum total transpirable water (TTSWtot): The estimation procedure
estimates TTSWtot from soil depth and soil texture (Gijsman et al., 2002; see Table 8–5). Many other possibilities exist (Gijsman et al., 2002).
·· Fraction transpirable water at budburst (FTSW0): It is assumed that the soil
is at wilting point at the end of the previous summer (i.e., after harvest and before autumn rainfalls). This is often a reasonable approximation for Mediterranean conditions. Then the model is run from the end of summer to determine soil moisture at budburst (Fig. 8–3).
The Distribution of h i for Each Input Variable
Given the method of obtaining approximate inputs, one then needs to translate those procedures into distributions of h i. Here we explain how this was done for the example treated here and show the resulting distributions. ·· Weather data: An approximate distribution of weather sequences is obtained
by assuming that the weather sequences from all neighboring weather stations are equally probable. In the example treated here, weather data from
Providing User-Oriented Uncertainty Information with a Vineyard Model
195
Table 8–3. Table to obtain approximate curve numbers CNcover and CNbare and the associated uncertainty. Soil group† Situation Bare soil Bare soil and tillage Grass cover
A 77 U(77 ± 5.5) 66 U(66 ± 8.5) 49 U(49 ± 10)
B 86 U(86 ± 4.5) 77 U(77 ± 5.5) 69 U(69 ± 10)
C 91 U(91 ± 3) 85 U(85 ± 4) 79 U(79 ± 5)
D 94 U(94 ± 2.5) 89 U(89 ± 2.5) 84 U (84 ± 2.5)
† The notation U(a ± b) signifies that the uncertainty is represented by a uniform distribution with lower limit a - b and upper limit a + b.
Table 8–4. Table to approximate vineyard maximum fraction of light interception kmax and the associated uncertainty. Vigor level† Foliage height m 0.7 0.8 0.9 1.0 1.1 1.2 1.3 1.4
Low
Medium
High
0.306 U(0.306 ± 0.034) 0.323 U(0.323 ± 0.036) 0.339 U(0.339 ± 0.038) 0.353 U(0.353 ± 0.040) 0.367 U(0.367 ± 0.042) 0.380 U(0.380 ± 0.043) 0.392 U(0.392 ± 0.045) 0.403 U(0.403 ± 0.047)
0.374 U(0.374 ± 0.034) 0.395 U(0.395 ± 0.036) 0.415 U(0.415 ± 0.038) 0.433 U(0.433 ± 0.040) 0.451 U(0.451 ± 0.042) 0.467 U(0.467 ± 0.043) 0.482 U(0.482 ± 0.045) 0.497 U(0.497 ± 0.047)
0.432 U(0.432 ± 0.029) 0.457 U(0.457 ± 0.031) 0.480 U(0.480 ± 0.032) 0.501 U(0.501 ± 0.034) 0.522 U(0.522 ± 0.035) 0.541 U(0.541 ± 0.037) 0.560 U(0.560 ± 0.039) 0.577 U(0.577 ± 0.040)
† The notation U(a ± b) signifies that the uncertainty is represented by a uniform distribution with lower limit a - b and upper limit a + b.
Table 8–5. Table to approximate maximum total transpirable water TTSWtot and the associated uncertainty. Soil depth† Soil texture Sand Medium Clay
Shallow 50 U(50,75)‡ 90 U(90 ± 35) 120 U(120 ± 30)
Medium 100 U(100 ± 30) 160 U(160 ± 35) 180 U(180 ± 60)
Deep 150 U(150 ± 40) 230 U(230 ± 40) 300 U(300 ± 60)
† The notation U(a ± b) signifies that the uncertainty is represented by a uniform distribution with lower limit a - b and upper limit a + b. ‡ For shallow sandy soil, the uncertainty is represented by a uniform distribution with lower and upper limits of 50 and 75, respectively.
196
Roux et al.
Fig. 8–3. Method for approximating the fraction transpirable soil water at budburst. It is assumed that fraction transpirable soil water is 0 at the end of the previous summer. Then the model is used to estimate the value at budburst.
two weather stations, each approximately 15 km from the vineyard in question, were used. ·· Input variables approximated using more easily measured variables (kmax,
CN, TTSWtot): The variable kmax will serve as an example. The approximate kmax value is given in Table 8–4 as a function of vigor level and plant height. Though each vigor–height combination is associated with a nominal kmax value, in fact the combination corresponds to a range of values. The range in each direction is estimated as half the maximum distance to an adjoining entry. For example, nominal kmax for vigor = “medium” and height = 1 m is 0.433. The neighboring values are (clockwise from top) 0.415, 0.501, 0.451, and 0.353. The greatest distance is 0.433 - 0.353 = 0.080, and so the distribution of h i is taken as a uniform distribution with limits 0.433 0.040 and 0.433 + 0.040.
·· The same procedure is used to estimate the distribution of h i for CN (Table
8–4) and TTSWtot (Table 8–5).
·· Fraction
transpirable soil water at budburst (FTSW0): The uncertainty here is estimated as the sum of two terms, using ˆ h i = ( FTSW0 i - FTSW0 i ) + ( FTSW0 i - FTSW0 i ) , where FTSW0 i is an estimate of FTSW0 based on simulations that begin several years before the ˆ year in question (whereas FTSW0 i only starts at the end of the previous summer). It was felt that this decomposition should give a more reliable estiˆ mate of error than looking directly at ( FTSW0 i - FTSW0 i ) . The distribution of the first term is estimated as the empirical distribution of errors for the 10 vineyards in our data set. The distribution of the second term is estimated ˆ from multiple simulations. Note that since both FTSW0 i and FTSW0 i are based on simulations, they both have uncertainties due to uncertainties in
Providing User-Oriented Uncertainty Information with a Vineyard Model
197
any other approximated input variables. Table 8–6 shows the distribution ˆ of FTSW0 i - FTSW0 i for each scenario (combination of estimated inputs).
RESULTS OF UNCERTAINTY CALCULATIONS WITH THE VINEYARD MODEL
Evaluating the Assumptions about Uncertainty in the Input Variables We have made assumptions about the uncertainty in each approximated input variable. We can test these assumptions to some extent, using the data from the 10 vineyards in our data set where we have both approximate and measured values of the input variables. For these cases we calculate the distribution of h + Tˆ i
i
and compare with the measured value Ti. Ideally we should find that in x% of the cases (for any x from 0 to 100), the measured value should fall within the x percentile of the distribution. In practice we simply examine the fraction of observed values that fall within the 100% range of h + Tˆ . i
i
Figure 8–4 shows the distribution of h i + Tˆi and the value of Ti for the
input variables kmax, CNcover, CNbare, TTSWtot, and FTSW0, for each of the 10 vineyards in the data set used here. Some of the observed values fall outside the uncertainty range, which indicates that the range of h + Tˆ might i
i
be slightly underestimated in some cases. However, overall the uncertainty ranges seem reasonable.
Scenarios for Approximated Inputs We have defined eight different scenarios, with different combinations of approximated input variables (Table 8–7). The reference scenario represents the case where all the input variables are measured. The last scenario (U7) represents the case where only the most easily obtained inputs, namely percentage grass cover and budburst date, are available. In scenario U1 only CN is approximated, and in U6 only weather is approximated. The other scenarios correspond to various combinations of approximated inputs.
Table 8–6. Uncertainty in FTSW0 for the different combinations of estimated input variables. Lower and upper limits
Scenario† Uref
U1
U2
umin‡
0.0
0.0
-0.20
umax‡
0.00
0.00
-0.22
U3 -0.17 0.14
U4 -0.23 0.19
U5 -0.23 0.17
U6 0.00 0.00
U7 -0.23 0.17
† Each scenario corresponds to a particular list of input variables that are estimated (see Table 8–7). In scenarios Uref, U1, and U6, FTSW0 is measured so there is no uncertainty. ‡ The uncertainty is represented by a uniform distribution with minimum and maximum values equal to umin and umax, respectively.
198
Roux et al.
Fig. 8–4. Evaluation of the assumptions about uncertainty in the input variables (a) kmax, (b) CNcover and CNbare, (c) TTSWtot, and (d) FTSW0. For each of the 10 reference plots, the total uncertainty range is shown, together with the estimated value and the measured value. For FTSW0, the uncertainty is calculated for scenario U5.
Table 8–7. Scenarios (combinations of approximated input values).†
Scenario
pic
TTSWtot
FTSW0
dbud
CNbare and CNcover
Uref U1 U2 U3 U4 U5 U6 U7
1 1 1 1 1 1 1 1
1 1 1 0 0 0 1 0
1 1 0 0 0 0 1 0
1 1 1 1 1 1 1 1
1 0 0 1 0 0 1 0
† A value 1 (0) indicates that the input variable is measured (approximated).
kmax
weather
1 1 1 1 1 0 1 0
1 1 1 1 1 1 1 1
Providing User-Oriented Uncertainty Information with a Vineyard Model
199
Uncertainty due to Approximating Inputs The uncertainty in simulated FTSW(t) due to uncertainty in the input variables was calculated for the test vineyard for both the years 2004 (Fig. 8–5) and 2006 (Fig. 8–6). The difference between each scenario and the reference scenario indicates how much uncertainty is added due to approximating those input variables that are estimated in that scenario. From a different point of view, the difference shows how much uncertainty could be reduced if the approximations were replaced by measurements. In 2004, the high winter and spring rainfall year, simulated FTSW(t) is always well above the threshold for irrigation. The level of uncertainty depends on which input variables are estimated, but in any case the simulated values with uncertainty never reach the threshold. The situation is quite different in 2006, the low rainfall year. In this case several of the scenarios have high probability of requiring irrigation. The difference between scenarios is important. Depending on the scenario, the average of the simulations can be quite biased compared with the reference scenario U0 (e.g., U4). Uncertainty in CN alone (scenario U1) leads to little uncertainty in the simulations, since this is a low winter and spring rainfall year and runoff is therefore unimportant. Uncertainty in weather alone (scenario U6) also leads to little uncertainty in the simulations. For the other scenarios the probability that irrigation is required ranges from 0.1 to 0.5.
Total Uncertainty Figure 8–7 and Fig. 8–8 show simulated FTSW(t) for 2004 and 2006, respectively, first without uncertainty information, then with just uncertainty due to approximating inputs for scenario U3, and finally with total uncertainty, due to both uncertainty with known inputs and the uncertainty due to approximating inputs, again for scenario U3. The lower limit of the white area is the threshold for irrigation; irrigation is indicated if simulated FTSW(t) goes below that threshold. In 2004, even taking into account total uncertainty, the simulated values indicate that irrigation is unnecessary. In 2006 on the other hand, taking into account total uncertainty rather than just the uncertainty in the inputs, increases substantially the probability that irrigation is required.
DISCUSSION
The vineyard model presented here is used by multiple extension services as an aid to producing irrigation advice. The extension services do not present the results as a definitive recommendation for irrigation timing, but rather as a general indication of water status in vineyards in the region. Nevertheless, even in this auxiliary role, it is important to have an estimate of the uncertainty in the
Fig. 8–5. Simulated FTSW(t) and 90% confidence interval resulting from uncertainty in input variables, for the year 2004. The scenarios (Table 8–7) correspond to different combinations of input variables that are approximated. The lower limit of the white area is the threshold for irrigation; irrigation is indicated if simulated FTSW(t) goes below that threshold; p(IRR) is the probability that irrigation is required at some time, given the uncertainty in FTSW(t); and sd(IRR_DATE) is the standard deviation of the first date when the probability of irrigation is > 0. If the probability of irrigation is 0, then sd(IRR_DATE) = NA. The histogram gives the probabilities of first irrigation date.
200 Roux et al.
Fig. 8–6. Simulated FTSW(t) and 90% confidence interval resulting from uncertainty in input variables, for the year 2006. The scenarios (Table 8–7) correspond to different combinations of input variables that are approximated. The lower limit of the white area is the threshold for irrigation; irrigation is indicated if simulated FTSW(t) goes below that threshold; p(IRR) is the probability that irrigation is required at some time, given the uncertainty in FTSW(t); and sd(IRR_ DATE) is the standard deviation of the first date when the probability of irrigation is > 0. If the probability of irrigation is 0, then sd(IRR_DATE) = NA. The histogram gives the probabilities of first irrigation date.
Providing User-Oriented Uncertainty Information with a Vineyard Model 201
202
Roux et al. Fig. 8–7. Comparison of uncertainties due to input variables and total uncertainty for the year 2004. From left simulated FTSW(t), 90% confidence interval resulting from uncertainty in input variables for scenario U3 and 90% confidence interval resulting from total uncertainty (uncertainty in input variables and uncertainty in the model equations and parameters and residual error). The lower limit of the white area is the threshold for irrigation; irrigation is indicated if simulated FTSW(t) goes below that threshold.
Providing User-Oriented Uncertainty Information with a Vineyard Model
203
Fig. 8–8. Comparison of uncertainties due to input variables and total uncertainty for the year 2006. From left simulated FTSW(t), 90% confidence interval resulting from uncertainty in input variables for scenario U3 and 90% confidence interval resulting from total uncertainty (uncertainty in input variables and uncertainty in the model equations and parameters and residual error). The lower limit of the white area is the threshold for irrigation; irrigation is indicated if simulated FTSW(t) goes below that threshold.
204
Roux et al.
simulated values that the model produces. The extension services have themselves expressed a need for uncertainty information, both for their own use and for transmission to growers. The usefulness of the model as a decision aid would be increased, according to the users, if uncertainty information were added. The extension services, using the approach described above, could produce graphs similar to those of Fig. 8–7, in real time, based on the input variables that are approximated in their test vineyards. Such graphs would make clear the level of uncertainty in the simulated results. One can imagine making the model available to each individual grower. In this way, each grower could obtain simulation results tailored to their particular vineyards. In this case, the growers would probably rely more on the model results than they currently do, making the uncertainty information even more valuable. Often users replace measured values for input variables by approximations that are easier and/or cheaper to obtain, but this is at the price of increasing uncertainty in the simulated results. It is then of importance to the user to know how much uncertainty this adds in order to decide if it is worthwhile to invest in measurements of more input variables. This would require a somewhat different presentation of uncertainty, since one is evaluating the reduction in uncertainty on the average over years. The model presented here is also used as a research tool, in particular for studying the consequences of introducing a cover crop into a vineyard (Ripoche et al., 2011). It has been shown that the introduction of grass cover between the rows of a vineyard can reduce runoff and erosion, but at the price of extra water consumption (Celette et al., 2009a) and competition for nitrogen (Celette et al., 2009b), which can lead to yield reduction. The model can be used to compare the two alternative cropping systems, that is, vineyards with and without grass cover. Here again, adding uncertainty information would be valuable, allowing one to better understand the reliability of the simulated results. Our procedure treats separately two sources of uncertainty. The first is the uncertainty in the model assuming no error in the input variables. This includes uncertainty in the model equations, in the model parameters, and the model residual error. We propose estimating this uncertainty using the error in hindcasts. This estimates an average error. There is an important underlying assumption here, which is that the model equations and parameters are used as provided— the user does not recalibrate the model. Therefore, we are not interested in the uncertainty in the estimated parameter values. Rather, the model plus parameter values are treated as fixed, and we are just interested in the error in the model with those parameters. Note that as more information is accumulated, the estimate of error for measured inputs could be improved.
Providing User-Oriented Uncertainty Information with a Vineyard Model
205
The second source of uncertainty is uncertainty in the input variables. This is very dependent on the model and on the way in which the input variables are approximated. Here we propose methods of estimating those input variables that are the most difficult to obtain. We also propose probability distributions of h = T - Tˆ for each input that is estimated. This is similar to the step in classii
i
i
cal uncertainty analysis where one fixes the distribution for each uncertain factor. The difference here is that the uncertainties must be based on user practice if the uncertainty calculations are to be relevant. We have used historical data to test the uncertainty distributions for estimated inputs. This is good practice to ensure that these distributions are reasonable. Given the distribution of error for measured inputs and the distribution of the uncertain inputs, one can do a Monte Carlo calculation to obtain a distribu-
(
)
ˆ tion of FTSWi ( t ) - FTSW t ,Tˆi , Xi ; q . This gives the detailed information about
uncertainty that one seeks.
This procedure is a practical implementation of the principles for estimating overall uncertainty proposed by Refsgaard et al. (2007). We have proposed a graphical representation of uncertainty information. This would have to be tested with users to see if it is useful in practice. The choice of illustrating 90% confidence intervals could also be questioned. This might be too pessimistic (or optimistic). Perhaps bounds that encompass less (or more) of the probability distribution would be preferable.
CONCLUSIONS
Models can be very valuable as one of the elements of a decision support system.
However, it is clear that there are substantial uncertainties attached to the simulations, and the models would be even more valuable if these uncertainties were explicitly acknowledged and quantified. We have proposed a procedure for adding uncertainty information to a vineyard soil moisture model that is used as an irrigation decision aid by extension services. The uncertainty calculations are based on user practices. The general procedure could be applied very generally to other models used as decision aides, in cases where uncertainties in inputs are an important consideration.
Acknowledgments This study was a part of the project Associate, a level of error in predictions of models for agronomy (network RMT modélisation et agriculture, www.modelia. org) led by ACTA (French Technical Institute for Agriculture). It was funded by a grant from the Ministry of Agriculture and Fishing of France.
206
REFERENCES
Roux et al.
Bellocchi, G., M. Rivington, M. Donatelli, and K. Matthews. 2010. Validation of biophysical models: Issues and methodologies. A review. Agron. Sustainable Dev. 30(1):109–130. Bennett, N.D., B.F.W. Croke, G. Guariso, J.H.A. Guillaume, S.H. Hamilton, A.J. Jakeman, S. Marsili-Libelli, L.T.H. Newham, J.P. Norton, C. Perrin, S.A. Pierce, B. Robson, R. Seppelt, A.A. Voinov, B.D. Fath, and V. Andreassian. 2013. Characterising performance of environmental models. Environ. Modell. Software 40:1–20. doi:10.1016/j.envsoft.2012.09.011 Boughton, W.C. 1989. A review of the USDA SCS curve number method. Aust. J. Soil Res. 27(3):511– 523. doi:10.1071/SR9890511 Celette, F., A. Findeling, and C. Gary. 2009a. Spatial and temporal changes to the water regime of a Mediterranean vineyard due to the adoption of cover cropping. Eur. J. Agron. 30:41–51. doi:10.1016/j.eja.2008.07.003 Celette, F., A. Findeling, and C. Gary. 2009b. Competition for nitrogen in an unfertilized intercropping system: The case of an association of grapevine and grass cover in a Mediterranean climate. Eur. J. Agron. 30(1):41–51. doi:10.1016/j.eja.2008.07.003 Celette, F., A. Ripoche, and C. Gary. 2010. WaLIS—A simple model to simulate water partitioning in a crop association: The example of an intercropped vineyard. Agric. Water Manage. 97(11):1749–1759. doi:10.1016/j.agwat.2010.06.008 Corbane, C., F. Jacob, D. Raclot, J. Albergel, and P. Andrieux. 2012. Multitemporal analysis of hydrological soil surface characteristics using aerial photos: A case study on a Mediterranean vineyard. Int. J. Appl. Earth Obs. Geoinf. 18:356–367. doi:10.1016/j.jag.2012.03.009 Delpuech, X., F. Celette, and C. Gary. 2010. Validation of the water balance model WaLIS in covercropped vineyards. In: 21ème Conférence Du COLUMA, Journées Internationales Sur La Lutte Contre Les Mauvaises Herbes, Dijon, France. 8–9 Dec. 2010. Association Française de Protection des Plantes, Alfortville, France. p. 414–424. Duru, M., M. Adam, P. Cruz, G. Martin, P. Ansquer, C. Ducourtieux, C. Jouany, J.P. Theau, and J. Viegas. 2009. Modelling above-ground herbage mass for a wide range of grassland community types. Ecol. Modell. 220(2):209–225. doi:10.1016/j.ecolmodel.2008.09.015 Gary, C., J.C. Payan, K. Kansou, A. Pellegrino, and J. Wery. 2005. A model-based diagnosis tool to evaluate the water stress experienced by vine in relation with production and quality objectives. In: XIV International GESCO Viticulture Congress, Geisenheim, Germany. 23–27 Aug. 2005. Groupe d’Etude des Systemes de Conduite de la Vigne, Geisenheim, Germany. p. 449–456. Gaudin, R., and C. Gary. 2012. Model-based evaluation of irrigation needs in Mediterranean vineyards. Irrig. Sci. 30(5):449–459. doi:10.1007/s00271-012-0349-x Gijsman, A.J., S.S. Jagtap, and J.W. Jones. 2002. Wading through a swamp of complete confusion: How choose a to method for estimating soil water retention parameters for crop models. Eur. J. Agron. 18(1–2):77–106. doi:10.1016/S1161-0301(02)00098-9 Jakeman, A.J., R.A. Letcher, and J.P. Norton. 2006. Ten iterative steps in development and evaluation of environmental models. Environ. Modell. Software 21(5):602–614. doi:10.1016/j. envsoft.2006.01.004 Lebon, E., V. Dumas, P. Pieri, and H.R. Schultz. 2003. Modelling the seasonal dynamics of the soil water balance of vineyards. Funct. Plant Biol. 30(6):699–710. doi:10.1071/FP02222 Ojeda, H. 2007. Irrigation qualitative de précision de la vigne. Prog. Agric. Vitic. 124:133–141. Pellegrino, A., E. Goze, E. Lebon, and J. Wery. 2006. A model-based diagnosis tool to evaluate the water stress experienced by grapevine in field sites. Eur. J. Agron. 25(1):49–59. doi:10.1016/j. eja.2006.03.003 Pellegrino, A., E. Lebon, M. Voltz, and J. Wery. 2005. Relationships between plant and soil water status in vine (Vitis vinifera L.). Plant Soil 266(1–2):129–142. doi:10.1007/s11104-005-0874-y Refsgaard, J.C., J.P. van der Sluijs, A.L. Højberg, and P.A. Vanrolleghem. 2007. Uncertainty in the environmental modelling process—A framework and guidance. Environ. Modell. Software 22(11):1543–1556. doi:10.1016/j.envsoft.2007.02.004 RGA. 2000. RGA recensement agricole. Service de La Statistique et de La Prospective, Du Ministère de L’agriculture et de La Pêche, Paris.
Providing User-Oriented Uncertainty Information with a Vineyard Model
207
RGA. 2010. RGA recensement agricole. Service de La Statistique et de La Prospective, Du Ministère de L’agriculture et de La Pêche, Paris. Riou, C., C. Valancogne, and P. Pieri. 1989. A simple model for interception of solar radiation by a vineyard, comparison with field data. Agronomie 9(5):441–450. Ripoche, A., J.-P. Rellier, R. Martin-Clouaire, N. Paré, A. Biarnès, and C. Gary. 2011. Modelling adaptive management of intercropping in vineyards to satisfy agronomic and environmental performances under Mediterranean climate. Environ. Modell. Software 26(12):1467–1480. doi:10.1016/j.envsoft.2011.08.003 Roux, S., F. Brun, and D. Wallach. 2014. Combining input uncertainty and residual error in crop model predictions: A case study on vineyards. Eur. J. Agron. 52:191–197. doi:10.1016/j. eja.2013.09.008 Soubeyroux, J-M., J-P. Vidal, J. Najac, N. Kitova, M. Blanchard, P. Dandin, E. Martin, C. Pagé, and F. Habets. 2011. Projet ClimSec: Impact du changement climatique en France sur la sécheresse et l’eau du sol. Météo-France, Toulouse, France. USDA–NRCS. 2007. National engineering handbook, Part 630, hydrology. USDA–NRCS, Washington, DC. Wallach, D., D. Makowski, J.W. Jones, and F. Brun. 2014. Working with dynamic crop models. 2nd ed. Academic Press, London.