See release notes on page 58. Readers are assumed to be familiar with Matlab
and should have a basic understanding of field of statistical pattern recognition.
PRTools4 A Matlab Toolbox for Pattern Recognition R.P.W. Duin, P. Juszczak, P. Paclik, E. Pekalska, D. de Ridder, D.M.J. Tax, S. Verzakov Version 4.1, August 2007
An introduction into the setup, definitions and use of PRTools is given. PRTools4 is extended and enhanced with respect to version 3 and thereby not fully compatible with it. This manual includes the description of a further upgrade: PRTools4.1. Still not all possibilities are fully exploited on the user level, or not at all. See release notes on page 58. Readers are assumed to be familiar with Matlab and should have a basic understanding of field of statistical pattern recognition.
Delft Pattern Recognition Research Faculty EWI - ICT Delft University of Technology P.O. Box 5046, 2600 GA Delft The Netherlands
tel : +31 15 2786143 fax: +31 15 2781843 email:
[email protected] http://prtools.org/
-1-
Availability, licences, copyright, reference PRTools can be downloaded from the PRTools website. The use of PRTools is protected by a license. This license is free for non-commercial academic research, non-commercial education and for personal inspection and evaluation. For commercial usage special licenses are available. The PRTools sources are copyright protected. If PRTools is used for scientific or educational publications, the following reference will be appreciated: R.P.W. Duin, P. Juszczak, P. Paclik, E. Pekalska, D. de Ridder, D.M.J. Tax, S. Verzakov PRTools4.1, A Matlab Toolbox for Pattern Recognition, Delft University of Technology, 2007.
-2-
Table of Contents 1. Motivation
5
2. Essential concepts
6
3. Implementation
9
4. Advanced example
11
5. Some Details
13
5.1 Datasets
13
5.2 Datasets help information
15
5.3 Datafiles
18
5.4 Datafiles help information
19
5.5 Classifiers and mappings
20
5.6 Mappings help information
23
5.7 How to write your own mapping
27
6. References
31
7. A review of the toolbox
32
Datasets and Mappings
32
Data Generation
34
Linear and Higher Degree Polynomial Classifiers
35
Normal Density Based Classification
36
Nonlinear Classification
36
Feature Selection
37
Classifiers and Tests (general)
38
Mappings
39
Combining classification rules
40
Image operations
40
Clustering and Distances
41
Plotting
43
-3-
Examples
43
8. Examples
45
8.1 PREX_CLEVAL Learning curves
45
8.2 PREX_COMBINING PRTOOLS example of classifier combining
46
8.3 PREX_CONFMAT Confusion matrix, scatterplot and gridsize
47
8.4 PREX_DENSITY Various density plots
48
8.5 PREX_EIGENFACES Use of images and eigenfaces
49
8.6 PREX_MATCHLAB Clustering the Iris dataset
50
8.7 PREX-MCPLOT Multi-class classifier plot
51
8.8 PREX_PLOTC Dataset scatter and classifier plot
52
8.9 PREX_SPATM Spatial smoothing of image classification
53
8.10 PREX_COSTM PRTools example on cost matrices and rejection
54
8.11 PREX_LOGDENS Improving density based classifiers
56
9. PRTools 4.0 release notes
58
9.1 Datasets
58
9.2 Mappings
58
9.3 The user level
59
10. PRTools 4.1 release notes
60
10.1 Compatibility
60
10.2 Datafiles
60
10.3 Image processing routines
60
10.4 Multiple labels
60
10.5 Optimisation of complexity parameters and regularisation
61
10.6 Regression
61
10.7 Object and dataset annotation
61
10.8 Kernels
61
10.9 Support vector classifiers
61
10.10 Rejects
61 -4-
1. Motivation In statistical pattern recognition one studies techniques for the generalization of examples to decision rules to be used for the detection and recognition of patterns in experimental data. This area of research has a strong computational character, demanding a flexible use of numerical programs for data analysis as well as for the evaluation of the procedures. As still new methods are being proposed in the literature a programming platform is needed that enables a fast and flexible implementation. Pattern recognition is studied in almost all areas of applied science. Thereby the use of a widely available numerical toolset like Matlab may be profitable for both, the use of existing techniques, as well as for the study of new algorithms. Moreover, because of its general nature in comparison with more specialized statistical environments, it offers an easy integration with the preprocessing of data of any nature. This may certainly be facilitated by the large set of toolboxes available in Matlab. The about 200 pattern recognition routines and the additional 200 support routines offered by PRTools in its present state represent a basic set covering largely the area of statistical pattern recognition. Many methods and proposals, however, are not yet implemented. Some choices are accidental as the routines were programmed by the developers for their own research, sometimes in a way that was good for their private purposes. The important field of neural networks has partially been skipped as Matlab already includes a very good toolbox in that area. Just an interface to some basic routines is offered by PRTools to facilitate a comparison with traditional techniques. PRTools has a few limitations. Due to the heavy memory demands of Matlab very large problems with learning sets of tens of thousands of objects cannot always be handled directly. In version 4.1 of the toolbox some tools to use large sets of files on disk are included. In the present version, PRTools4, the handling of missing data has been prepared, but hardly any routine has been are implemented. The use of symbolic data is not supported. Recently the possibility of soft (and thereby also fuzzy) labels has been added, as well as the usage of multiple labels. Just a few routines make use of them now. Also multi-dimensional target fields are allowed, but at this moment no procedure makes use of this possibility. Finally, support for misclassification costs has been implemented, but this is still on an experimental level. In section 2 we present the basic philosophy about mappings and datasets. Section 3 presents the actual implementation, which is illustrated by examples in section 4. In section 5 further details are given, focussing on defining and using datasets and mappings. Section 7 lists the most important procedures of the toolbox. The examples included in the distribution of PRTools are listed in section 8, together with their expected results. Finally release notes of the versions 4.0 and 4.1 are given in sections 9 and 10. Here a summary of changes can be found that may be important for experienced users of PRTools.
-5-
2. Essential concepts For the automatic recognition of the classes of objects, first some measurements have to be collected, e.g. using sensors, then they have to be represented, e.g. in a feature space and after some possible feature reduction steps they can be finally mapped by a classifier on the set of class labels. Between the initial representation in the feature space and this final mapping on the set of class labels the representation may be changed several times: simplified feature spaces (feature selection), normalization of features (e.g. by scaling), linear or nonlinear mappings (feature extraction), classification by a possible set of classifiers, combining classifiers and the final labelling. In each of these steps the data is transformed by some mapping. Based on this observation the following two basic concepts of PRTools are defined: - datasets: matrices in which the rows represent the objects and the columns the features, class memberships, or other fixed sets of properties (e.g. distances to a fixed set of other objects). In PRTools4.1 an extension of the dataset concept has been defined: datafiles. These refer to datasets to be created from directories of files. - mappings: transformations operating on datasets. As pattern recognition has two stages, training and execution, mappings have also two types: untrained and trained. An untrained mapping refers just to the concept of a method, e.g. forward feature selection, PCA, or Fisher’s linear discriminant. It may have some parameters that are needed for training, e.g. the desired number of features or some regularization parameters. If an untrained mapping is applied to a dataset it will be trained (training). A trained mapping is specific for the training set used to train the mapping. This dataset thereby determines the input dimensionality (e.g. the number of input features) as well as the output dimensionality (e.g. the number of output features or the number of classes). When a trained mapping is applied to a dataset it will transform the dataset according to its definition (execution). In addition fixed mappings are used. They are almost identical to trained mappings, except that they don’t result from a training step, but are directly defined by the user: e.g. the transformation of distances by a sigmoid function to the [0,1] interval. PRTools deals with sets of labeled or unlabeled objects and offers routines for the generalization of such sets into functions for mapping and classification. A classifier is thereby a special case of a mapping as it maps objects on class labels or on [0,1] intervals that may be interpreted as class memberships, soft labels, or posterior probabilities. An object is a k-dimensional vector of feature values, distances, (dis)similarities or class memberships. Within PRTools they are usually just called features. It is assumed that for all objects in a problem all values of the same set of features are given. The space defined by the actual set of features is called the feature space. Objects are represented as points or vectors in this space. New objects in a feature space are usually gradually converted to labels by a series of mappings followed by a final classifier.
-6-
Sets of objects may be given externally or may be generated by one of the data generation routines of PRTools. Their labels may also be given externally or may be the result of a cluster analysis. By this technique similar objects within a larger set are grouped (clustered). The similarity measure is defined by the cluster technique in combination with the object representation in the feature space. Some clustering procedures do not just generate labels, but also a classifier that classifies new objects in the same way. A fundamental problem is to find a good distance measure that agrees with the dissimilarity of the objects represented by the feature vectors. Throughout PRTools the Euclidean distance is used as default. However, scaling the features and transforming the feature spaces by different types of mapings effectively changes the distance measure. The dimensionality of the feature space may be reduced by the selection of subsets of good features. Several strategies and criteria are possible for searching good subsets. Feature selection is important because it decreases the amount of features that have to be measured and processed. In addition to the improved computational speed in lower dimensional feature spaces there might also be an increase in the accuracy of the classification algorithms. Another way to reduce the dimensionality is to map the data on a linear or nonlinear subspace. This is called linear or nonlinear feature extraction. It does not necessarily reduce the number of features to be measured, but the advantage of an increased accuracy may still be gained. Moreover, as lower dimensional representations yield less complex classifiers better generalizations can be obtained. Using a training set a classifier can be trained such that it generalizes this set of examples of labeled objects into a classification rule. Such a classifier can be linear or nonlinear and can be based on two different kinds of strategies. The first strategy minimizes the expected classification error by using estimates of the probability density functions. In the second strategy this error is minimized directly by optimizing the classification function over its performance over the learning set or a separate evaluation set. In this approach it has to be avoided that the classifier becomes entirely adapted to the training set, including its noise. This decreases its generalization capability. This ‘overtraining’ can be circumvented by several types of regularization (often used in neural network training). Another technique is to simplify the classification function afterwards (e.g. the pruning of decision trees). In PRTools4.1 the possibility of an automatic optimisation has been introduced for parameters controlling the complexity or the regularization of the training procedures of mappings and classifiers. This is based on a cross validation (see below) over the training set and roughly increases the time needed for training by a factor 100. Constructed classification functions may be evaluated by independent test sets of labeled objects. These objects have to be excluded from the training set, otherwise the evaluation becomes optimistically biased. If they are added to the training set, however, better classification functions can be expected. A solution to this dilemma is the use of cross validation and rotation methods by which a small fraction of objects is excluded from training and used for testing. This fraction is rotated over the available set of objects and results are averaged. The extreme case is the leave-one-out method for which the excluded fraction is as large as one object.
-7-
The performance of classification functions can be improved by the following methods: 1. A reject option in which the objects close to the decision boundary are not classified. They are rejected and might be classified by hand or by another classifier. 2. The selection or averaging of classifiers. 3. A multi-stage classifier for combining classification results of several other classifiers. For all these methods it is profitable or necessary that a classifier yields some distance measure, confidence or posterior probability in addition to the hard, unambiguous assignment of labels.
-8-
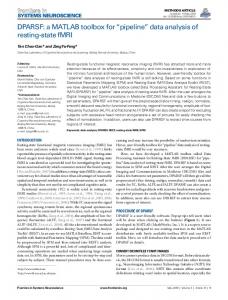
3. Implementation PRTools makes use of the possibility offered by Matlab to define “Classes” and “Objects”. These programming concepts should not be confused with the classes and objects as defined in Pattern Recognition. The two main “Classes” defined in PRTools are: dataset and mapping. As a child of dataset also datafile has been defined, inheriting most properties of dataset. A large number of operators (like * or []) and Matlab commands have been overloaded and have thereby a special meaning when applied to a dataset and/or a mapping. The central data structure of PRTools is the dataset. It primarily consists of a set of objects represented by a matrix of feature vectors. Attached to this matrix is a set of labels, one for each object and a set of feature names, also called feature labels. Labels can be integer numbers or character strings. Moreover, a set of prior probabilities, one for each class, is stored. In most help files of PRTools, a dataset is denoted by A. In almost any routine this is one of the inputs. Almost all routines can handle multi-class object sets. It is possible that for some objects no label is specified (a NaN is used, or an empty string). Such objects are, unless otherwise mentioned, skipped during training. It is possible to define more than one set of labels in a dataset. For instance, when the objects are pixels in an image, then they may be labelled according their image segment, but also according to the image, or to the sensor used, or the place the image has been measured. Data structures of the “Classes” mapping store data transformations (‘mappings’), classifiers, feature extracting results, data scaling definitions, nonlinear projections, etcetera. They are usually denoted by W. The easiest way to apply a mapping W to a dataset A is by A*W. The matrix multiplication symbol * is overloaded to this purpose. It is similar to the pipe (’|’) command in Unix. This operation may also be written as map(A,W). Like everywhere else in Matlab, concatenations of operations are possible, e.g. A*W1*W2*W3 and are executed from left to right. A typical example is given below: A = gendath([50 50]); % Generate Highleyman’s classes, 50 objects / class % Training set C (20 objects / class) % Test set D (30 objects / class) [C,D] = gendat(A,[20 20]); % Compute classifiers W1 = ldc(C); % linear W2 = qdc(C); % quadratic W3 = parzenc(C); % Parzen W4 = bpxnc(C,3); % Neural net with 3 hidden units % Compute and display classification errors disp([testc(D*W1),testc(D*W2),testc(D*W3),testc(D*W4)]); % Plot data and classifiers scatterd(A); % scatter plot % plot the 4 discriminant functions plotc({W1,W2,W3,W4});
-9-
This command file first generates by gendath two sets of labeled objects, both containing 50 twodimensional object vectors, and stores them, their labels and prior probabilities in the dataset A. The distribution follows the so-called ‘Highleyman classes’. The next call to gendat takes this dataset and splits it at random into a dataset C, further on used for training, and a dataset D, used for testing. This training set C contains 20 objects from both classes. The remaining 2 x 30 objects are collected in D. In the next lines four classification functions (discriminants) are computed, called W1, W2, W3 and W4. The first three are in fact density estimators based on various assumptions (class priors stored in C are taken into account). Formally they are just mappings, as E = D*W1 computes the class densities for the objects stored in D. E has as many columns as there are classes in the training set for W1 (in this case two). As the test routine testc (test classifier) assigns objects (represented by the rows in E) to the class corresponding with the highest density (times prior probability) the mappings W1, ..., W4 can be used as classifiers. The linear classifier W1 (ldc) and quadratic classifier W2 (qdc) are both based on the assumption of normally distributed classes. The first assumes equal class covariance matrices. The Parzen classifier estimates the class densities by the Parzen density estimation and has a built-in optimization for the smoothing parameter. The fourth classifier uses a feed forward neural network with three hidden units. It is trained by the back propagation rule using a varying stepsize. Below the results are displayed and plotted. The test dataset D is used in testc on each of the four discriminants. They are combined in a cell array, but individual calls are possible as well. The estimated probabilities of error are displayed in the Matlab command window and may look like: 0.1500
0.0333
0.1333
0.0833
Finally the classes are plotted in a scatter diagram together with the discriminants, see below. The plot routine plotc draws a vectorized straight line for the linear classifiers and computes the discriminant function values in all points of the plot grid (default 30 x 30) for the nonlinear discriminants. After that, the zero discriminant values are computed by interpolation and plotted. : Highleyman Dataset 6
Feature 2
4 2 0 Bayes-Normal-1 Bayes-Normal-2 Parzen Classifier BP Neural Classf
-2 -4 -1
0
1 Feature 1
- 10 -
2
3
4. Advanced example The following, more advanced example is one of the standard examples that comes with PRTools. It defines a set of base classifiers and combines them in several ways. They are trained and evaluated on a 10-dimensional 2-class problem consisting of just two normal distributions with high correlations. This example shows various constructs of PRTools that facilitate the handling of sets of classifiers, often desirable for comparative studies: • The definition of a sequence of untrained mapping like feature selection procedure and a classifier (e.g. w2 = featself([],'NN',3)*ldc). • The simultaneous training of a set of untrained classifiers stored in a cell array (W) by the same training set (B) in a single call (V = B*W), resulting in a cell array of trained classifiers (V). • The construction of a set of combined classifiers stored in a cell array (VC), from the combined set of base classifiers (VALL) and a set of possible combining rules stored in a cell array (WC) by a single statement (VC = VALL * WC). • The simultaneous evaluation of a cell array of trained classifiers (V or VC) by the same test set C in a single call (testc(C,V) or testc(C,CV)). PREX_COMBINING
PRTools example on classifier combining
Presents the use of various fixed combiners for some classifiers on the 'difficult data'. % Generate 10-dimensional data A = gendatd([100,100],10); % Select the training set of 40 = 2x20 objects % and the test set of 160 = 2x80 objects [B,C] = gendat(A,0.2);
w1 = w1 = w2 = w2 = w3 = w3 = w4 = w4 = w5 = w5 =
% Define 5 untrained classifiers, (re)set their names % w1 is a linear discriminant (LDC) in the space reduced by PCA klm([],0.95)*ldc; setname(w1,'klm - ldc'); % w2 is an LDC on the best (1-NN leave-one-out error) 3 features featself([],'NN',3)*ldc; setname(w2,'NN-FFS - ldc'); % w3 is an LDC on the best (LDC apparent error) 3 features featself([],ldc,3)*ldc; setname(w3,'LDC-FFS - ldc'); % w4 is an LDC ldc; setname(w4,'ldc'); % w5 is a 1-NN knnc([],1); setname(w5,'1-NN'); % Store classifiers in a cell
- 11 -
W = {w1,w2,w3,w4,w5}; % Train them all V = B*W; % Test them all disp([newline 'Errors for individual classifiers']) testc(C,V); % Construct combined classifier VALL = [V{:}]; % Define combiners WC = {prodc,meanc,medianc,maxc,minc,votec}; % Combine (result is cell array of combined classifiers) VC = VALL * WC; % Test them all disp([newline 'Errors for combining rules']) testc(C,VC)
This script generates the below output. Note that testc, if called with a cell array of classifiers, lists the names of the classifiers and generates a table. Errors for individual classifiers Test results result for clsf_1 clsf_2 clsf_3 clsf_4 clsf_5
: : : : :
klm - ldc NN-FFS - ldc LDC-FFS - ldc ldc 1-NN clsf_1
clsf_2
clsf_3
clsf_4
clsf_5
0.094
0.475
0.081
0.081
0.163
clsf_1
clsf_2
clsf_3
clsf_4
clsf_5
clsf_6
0.094
0.169
0.094
0.163
0.081
0.081
Difficult Dataset
Errors for combining rules Test results result for clsf_1 clsf_2 clsf_3 clsf_4 clsf_5 clsf_6
: : : : : :
Product combiner Mean combiner Median combiner Maximum combiner Minimum combiner Voting combiner
Difficult Dataset
- 12 -
5. Some Details The command help files and the examples given below should give sufficient information to use the toolbox with a few exceptions. These are discussed in the following sections. They deal with the ways classifiers and mappings are represented. As these are the constituting elements of a pattern recognition analysis, it is important that the user understands these issues. 5.1 Datasets A dataset consists of a set of m objects, each given by k features. In PRTools such a dataset is represented by a m by k matrix: m rows, each containing an object vector of k features. Usually a dataset is labeled. An example of a definition is: > A = dataset([1 2 3; 2 3 4; 3 4 5; 4 5 6],[3 3 5 5]’) > 4 by 3 dataset with 2 classes: [2 2]
The 4 by 3 data matrix (4 objects given by 3 features) is accompanied by a label list of 4 labels, connecting each of the objects to one of the two classes, 3 and 5. Class labels can be numbers or strings and should always be given as rows in the label list. It is possible that some, or all objects are unlabeled. If the label list is not given all objects are unlabeled. In addition it is possible to assign labels to the columns (features) of a dataset: > A = dataset(rand(100,3),genlab([50 50],[3 5]’)); > A = setfeatlab(A,[’r1’;’r2’;’r3’]) > 100 by 3 dataset with 2 classes: [50 50]
The routine genlab generates 50 labels with value 3, followed by 50 labels with value 5. By setfeatlab the labels (’r1’,’r2’,’r3’) for the three features are set. These are just feature names. Various other fields can be set as well. One of the ways to see these fields is by converting the dataset to a structure: > struct(A) ans = data: lablist: nlab: labtype: targets: featlab: featdom: prior: cost: objsize: featsize: ident: version: name: user:
[100x3 double] {2x4 cell} [100x1 double] 'crisp' [] [3x2 char] {[] [] []} [] [] 100 3 [100x1 struct] {[1x1 struct] '21-Jul-2007 15:16:57'} [] []
They can be inspected individually by various get commands defined for datasets, e.g.
- 13 -
> getfeatlab(A) ans = r1 r2 r3
Important is the possibility to set prior probabilities for each of the classes by the command setprior(A,prob,lablist). The prior values in prob should sum to one. If prob is empty or if it is not supplied the prior probabilities are computed from the dataset label frequencies. If prob equals zero then equal class probabilities are assumed. More than a single set of labels can be defined for a dataset. E.g. > A = addlabels(A,char(’apple’,’pear’,’apple’,’banana’),’fruitnames’)
creates a second set of labels for the same objects. The active one can be selected by the changelablist command. The nlab field points into the active label list and is used by PRTools to find the real labels: >> A = changelablist(A,1) 4 by 3 dataset with 2 classes: [2 2] >> getnlab(A) ans = 1 1 2 2 >> getlablist(A) ans = 3 5 >> A = changelablist(A,'fruitnames') 4 by 3 dataset with 3 classes: [2 1 1] >> getnlab(A) ans = 1 3 1 2 >> getlablist(A) ans = apple banana pear > getlabels(A) ans = apple pear apple banana
- 14 -
This last command, getlabels, does not refer to a field in the dataset, but retrieves the labels using the indices stored in nlab to get the corresponding elements of lablist. So getlabels(A) is equivalent to > nlab = getnlab(A); > labels = lablist(nlab,:);
Various others items stored in a dataset can be retrieved by commands like getdata and getsize a The size of the dataset can be found by > [m,k] = size(A); > [m,k,c] = getsize(A);
in which m is the number of objects, k the number of features and c the number of classes (equal to max(nlab)). Datasets can be combined by [A;B] if A and B have equal numbers of features and by [A B] if they have equal numbers of objects. Creating subsets of datasets can be done by A(I,J) in which I is a set of indices defining the desired objects and J is a set of indices defining the desired features. The original data matrix can be retrieved by getdata(A), double(A) or by +A. Be aware that the order of classes returned by getprob and getlablist is the standard order used in PRTools and may differ from the one used in the definition of A. For more information, type help datasets. 5.2 Datasets help information Datasets in PRTools are in the MATLAB language defined as objects of the class DATASET. Below, the words 'object' and 'class' are used in the pattern recognition sense. A dataset is a set consisting of M objects, each described by K features. In PRTools, such a dataset is represented by a M x K matrix: M rows, each containing an object vector of K elements. Usually, a dataset is labeled. An example of a definition is: DATA = [RAND(3,2) ; RAND(3,2)+0.5]; LABS = ['A';'A';'A';'B';'B';'B']; A = DATASET(DATA,LABS); which defines a [6 x 2] dataset with 2 classes. The [6 x 2] data matrix (6 objects given by 2 features) is accompanied by labels, assigning each of the objects to one of the two classes A and B. Class labels can be numbers or strings and should always be given as rows in the label list. A lable may also have the value NaN or may be an empty string, indicating an ulabeled object. If the label list is not given, all objects are marked as unlabeled. Various other types of information can be stored in a dataset. The most simple way to get an overview is by typing:
- 15 -
STRUCT(A) which for the above example displays the following: DATA: LABLIST: NLAB: LABTYPE: TARGETS: FEATLAB: FEATDOM: PRIOR: COST: OBJSIZE: FEATSIZE: IDENT: VERSION: NAME: USER:
[6x2 double] {2x4 cell} [6x1 double] 'crisp' [] [2x1 double] {1x2 cell } [] [] 6 2 [6x1 struct] {[1x1 struct] [] []
'21-Jul-2007 15:16:57'}
These fields have the following meaning: DATA
:
LABLIST
:
NLAB
:
LABTYPE
:
TARGETS
:
an array containing the objects (the rows) represented by features (the columns). In the software and help-files, the number of objects is usually denoted by M and the number of features is denoted by K. So, DATA has the size of [M,K]. This is also defined as the size of the entire dataset. The names of the classes, can be strings stored in a character array. If they are numeric they are stored in a column vector. Mixtures of these are not supported. The LABLIST field is a structure in which more than a single label list and the corresponding priors and costs are stored. PRTools keeps automatically track of this. See the MULTI_LABELING help file for more details. an [M x 1] vector of integers between 1 and C, defining for each of the M objects its class. 'CRISP', 'SOFT' or 'TARGETS' are the three possible label types. In case of 'CRISP' labels, a unique class, defined by NLAB, is assigned to each object, pointing to the class names given in LABLIST. For 'SOFT' labels, each object has a corresponding vector of C numbers between 0 and 1 indicating its membership (or confidence or posterior probability) of each of the C classes. These numbers are stored in TARGETS of the size M x C. They don't necessarily sum to one for individual row vectors. Labels of type 'TARGETS' are in fact no labels, but merely target vectors of length C. The values are again stored in TARGETS and are not restricted in value. [M,C] array storing the values of the soft labels or targets.
- 16 -
FEATLAB
:
FEATDOM PRIOR
: :
COST
:
OBJSIZE
:
FEATSIZE :
IDENT
:
VERSION
:
NAME
:
USER
:
A label list (like LABLIST) of K rows storing the names of the features. A cell array describing for each feature its domain. Vector of length C storing the class prior probabilities. They should sum to one. If PRIOR is empty ([]) it is assumed that the class prior probabilities correspond to the class frequencies. Classification cost matrix. COST(I,J) are the costs of classifying an object from class I as class J. Column C+1 generates an alternative reject class and may be omitted, yielding a size of [C,C]. An empty cost matrix, COST = [] (default) is interpreted as COST = ONES(C) - EYE(C) (identical costs of misclassification). The number of objects, M. In case the objects are related to a n-dimensional structure, OBJSIZE is a vector of length n, storing the size of this structure. For instance, if the objects are pixels in a [20 x 16] image, then OBJSIZE = [20,16] and M = 320. The number of features, K. In case the features are related to an n-dimensional structure, FEATSIZE is a vector of length n, storing the size of this structure. For instance, if the features are pixels in a [20 x 16] image, then FEATSIZE = [20,16] and K = 320. A structure array of M elements storing user defined fields giving additional information on each of the objects. See SETIDENT. Some information related to the version of PRTools used for defining the dataset. A character string naming the dataset, possibly used to annotate related graphics. A structure with user defined fields not used by PRTools. See DATASET/SETUSER
The fields can be set in the following ways: 1.In the DATASET construction command after DATA and LABELS using the form of {field name, value pairs}, e.g. A = DATASET(DATA,LABELS,'PRIOR',[0.4 0.6],'FEATLIST',['AA';'BB']); Note that the elements in PRIOR refer to classes as they are ordered in LABLIST. 2.For a given dataset A, the fields may be changed similarly by the SET command: A = SET(A,'PRIOR',[0.4 0.6],'FEATLIST',['AA';'BB']); 3.By the commands SETDATA, SETFEATLAB, SETFEATDOM, SETFEATSIZE, SETIDENT, SETLABELS, SETLABLIST, SETLABTYPE, SETNAME, SETNLAB, SETOBJSIZE, SETPRIOR, SETTARGETS, SETUSER. 4.By using the dot extension as for structures, e.g. A.PRIOR = [0.4 0.6];
- 17 -
A.FEATLIST = ['AA';'BB']; Note that there is no field LABELS in the DATASET definition. Labels are converted to NLAB and LABLIST. Commands like SETLABELS and A.LABELS, however, exist and take care of the conversion. The data and information stored in a dataset can be retrieved as follows: 1.By DOUBLE(A) and by +A, the content of the A.DATA is returned. [N,LABLIST] = CLASSSIZES(A); It returns the numbers of objects per class and the class names stored in LABLIST. By DISPLAY(A), it writes the size of the dataset, the number of classes and the label type on the terminal screen. By SIZE(A), it returns the size of A.DATA: numbers of objects and features. By SCATTERD(A), it makes a scatter plot of a dataset. By SHOW(A), it may be used to display images that are stored as features or as objects in a dataset. 2.By the GET command, e.g: [PRIOR,FEATLIST] = GET(A,'PRIOR','FEATLIST'); 3.By the commands: GETDATA, GETFEATLAB, GETFEATSIZE, GETIDENT, GETLABELS, GETLABLIST, GETLABTYPE, GETNAME, GETNLAB, GETOBJSIZE, GETPRIOR, GETCOST, GETSIZE, GETTARGETS, GETTARGETS, GETUSER, GETVERSION. Note that GETSIZE(A) does not refer to a single field, but it returns [M,K,C]. The following commands do not return the data itself, instead they return indices to objects that have specific identifiers, labels or class indices: FINDIDENT, FINDLABELS, FINDNLAB. 4.Using the dot extension as for structures, e.g. PRIOR = A.PRIOR; FEATLIST = A.FEATLIST; Many standard MATLAB operations and a number of general MATLAB commands have been overloaded for variables of the DATASET type.
5.3 Datafiles Datafiles are constructed to solve the memory problem connected with datasets. The latter are always in core and their size is thereby restricted to the size of the computer memory. As in processing datasets often (temporarily) copies are created, it is in practice advisable to keep datasets under 10 million elements (objectsize x featuresize). A number of operations handle datasets sequentially, or can be written like that, e.g. fixed mappings, testing and the training of some simple classifiers. So there is no problem to have such data stored on disk and have it read when needed. The datafile construct enables this is in fact an administration to keep track of the data and to have all additional information ready to reshape the desired pieces of data into a dataset when it has to be processed.
- 18 -
In understanding the handling of datafiles it is important to keep this characteristic in mind: they are just administration and the real processing is postponed untill it is needed. PRTools makes use of this characteristic to integrate in the datafile concept raw preprocessing of, for instance images and signals. Arbitrary preprocessing of images can be defined for datafiles. It is the responsibility of the user that a preprocessing sequence ends in a format that can be straightforwardly transformed into a dataset. E.g., after preprocessing all images have to be of the same size or generate feature vectors of the same length. Datafiles are formally children of the ’class’ dataset. Consequently they inherit the properties of datasets and ideally every operation that can be performed on a dataset can also be performed on a datafile. As can be understood from the above, this cannot always be true due to memory restrictions. There is a general routine, prmemory, by which the user can define what the maximum dataset sizes are that can be allowed. PRTools makes use of this to split datafiles into datasets of feasible sizes. An error is generated when this is not possible. Routines that don’t accept datafiles should return an understandable error messages if called with a datafile. In most help text is included when routines accept datafiles. The use of datafiles starts by the datafile construct that points to a directory in which each file is interpreted as an object. There is a savedatafile command that executes all processing defined for a datafile and stores the data on disk, ready to be used for defining a new datafile. This is the only place where PRTools writes data to disk. For more details, read the next section, 5.4 Datafiles help information Datafiles in PRTools are in the MATLAB language defined as objects of the class DATAFILE. They inherit most of their properties of the class DATASET. They are a generalisation of this class allowing for large datasets distributed over a set of files. Before conversion to a dataset preprocessing can be defined. There are four types of datafiles: raw : Every file is interpreted as a single object in the dataset. These files may, for instance, be images of different size. pre-cooked : In this case the user should supply a command that reads a file and converts it to a dataset. half-baked : All files should be mat-files, containing a single dataset. mature : This is a datafile by PRTools, using the SAVEDATAFILE command after execution of all preprocessing defined for the datafile. A datafile is, like a dataset, a set consisting of M objects, each described by K features. K might be unknown, in which case it is set to zero, K=0. Datafiles store an administration about the files or directories in which the objects are stored. In addition they can store commands to preprocess the files before they are converted to a dataset and postprocessing commands, to be executed after conversion to a dataset. Datafiles are mainly an administration. Operations on datafiles are possible as long as they can be stored (e.g. filtering of images for raw datafiles, or object selection by GENDAT). Commands that are able to
- 19 -
process objects sequentially, like NMC and TESTC can be executed on datafiles. Whenever a raw datafile is sufficiently defined by pre- and postprocessing it can be converted into a dataset. If this is still a large dataset, not suitable for the available memory, it should be stored by the SAVEDATAFILE command and is ready for later use. If the dataset is sufficiently small it can be directly converted into a dataset by DATASET. The main commands DATAFILE ADDPREPROC ADDPOSTPROC FILTM SAVEDATAFILE DATASET
specific for datafiles are: constructor. It defines a datafile on a directory. adds preprocessing commands (low level command) adds postprocessing commands (low level command) user interface to add preprocessing to a datafile. executes all defined pre- and postprocessing and stores the result as a dataset in a set of matfiles. - conversion to dataset
Datafiles have the following fields, in addition to all dataset fields. ROOTPATH - Absolute path of the datafile FILES - names of directories (for raw datafiles) or mat-files (for converted datafiles) TYPE - datafile type PREPROC - preprocessing commands in a struct array POSTPROC - postprocessing commands as mappings DATASET - stores all dataset fields. Note that the DATA field as well as the target field are empty and that the IDENT.FILE_INDEX field is used to store for every object a pointer to a file or directory in FILES. Almost all operations defined for datasets are also defined for datafiles, with a few exceptions. Also fixed and trained mappings can handle datafiles, as they process objects sequentially. The use of untrained mappings in combination with datafiles is a problem, as they have to be adapted to the sequential use of the objects. Mappings that can handle datafiles are indicated in the Contents file. The possibility to define preprocessing of objects (e.g. images) with different sizes makes datafiles useful for handling raw data and measurements of features.
5.5 Classifiers and mappings There are many commands to train and use mappings between spaces of different (or equal) dimensionalities. For example:
- 20 -
if A is a m by k dataset (m objects in a k-dimensional space) and W is a k by n mapping (map from k to n dimensions) then A*W is a m by n dataset (m objects in a n-dimensional space) Mappings can be linear or affine (e.g. a rotation and a shift) as well as nonlinear (e.g. a neural network). Typically they can be used as classifiers. In that case a k by n mapping maps a k-feature data vector on the output space of a n-class classifier (exception: 2-class classifiers like discriminant functions may be implemented by a mapping to a 1-dimensional space like the distance to the discriminant, n = 1). Mappings are of the data type 'mapping' (class(W) is 'mapping'), have a size of [k,n] if they map from k to n dimensions. Mappings can be instructed to assign labels to the output columns, e.g. the class names. These labels can be retrieved by labels = getlabels(W); before the mapping, or labels = getlabels(A*W); after the dataset A is mapped by W.
Mappings can be learned from examples, (labeled) objects stored in a dataset A, for instance by training a classifier: W1 = ldc(A);the normal densities based linear classifier W2 = knnc(A,3); the 3-nearest neighbor rule W3 = svc(A,’p’,2);the support vector classifier based on a 2-nd order
polynomial kernel Untrained or empty mappings are supported. They may be very useful. In this case the dataset is replaced by an empty set or entirely skipped: V1 = ldc; V2 = knnc([],a); V3 = svc([],’p’,2);
Such mappings can be trained later by W1 = A*V1; W2 = A*V2; W3 = A*V3;
(which is equivalent to the statements a few lines above) or by using cell arrays V = {ldc, knnc([],a), svc([],’p’,2)}; W = A*V;
The mapping of a test set B by B*W1 is now equivalent to B*(A*V1). Note that expressions are evaluated from left to right, so B*A*V1 will result in an error as the multiplication of the two datasets (B*A) is executed first. Some trainable mappings do not depend on class labels and can be interpreted as finding a feature space that approximates as good as possible the original dataset given some conditions and measures. Examples are the Karhunen-Loève Mapping (klm), principle component analysis (pca) and kernel mapping (kernelm) by which nonlinear, kernel PCA mappings can be computed. In addition to trainable mappings, there are fixed mappings, which operation is not computed from a training set but defined by just a few parameters. A number of them can be set by cmapm. Other ones are sigm and invsigm.
- 21 -
The result D of mapping a test set on a trained classifier, D = B*W1 is again a dataset, storing for each object in B the output values of the classifier. For discriminants they are sigmoids of distances, mapped on the [0,1] interval, for neural networks their unnormalized outputs and for density based classifiers the densities. For all of them holds: the larger, the more similar with the corresponding class. The values in a single row (object) don’t necessarily sum to one. This can be achieved by the fixed mapping classc: D = B*W1*classc
The values in D can be interpreted as posterior probability estimates or classification confidences. Such a classification dataset has column labels (feature labels) for the classes and row labels for the objects. The class labels of the maximum values in each object row can be retrieved by labels = D*labeld; or labels = labeld(D);
A global classification error follows from e = D*testc; or e = testc(D);
Mappings can be combined in the following ways: sequential: W = W1 * W2 * W3 (equal inner dimensions) stacked: W = [W1, W2, W3] (equal numbers of 'rows' (input dimensions)) parallel: W = [W1; W2; W3] (unrestricted) The output size of the parallel mapping is irregularly equal to (k1+k2+k3) by (n1+n2+n3) as the output combining of columns is undefined. In a stacked or parallel mapping columns having the same label can be combined by various combiners like maxc, meanc and prodc. If the classifiers W1, W2 and W3 are trained for the same n classes, their output labels are the same and may be combined by W = prodc([W1;W2;W3]) into a (k1+k2+k3) by n classifier. The above combinations can also be defined for untrained mappings and can be trained afterwards. This may be useful if they have to be trained for a series of datasets. W for itself, or display(W) lists the size and type of a classifier as well as the routine used for computing a mapping A*W. The construction of a combined mapping may be inspected by parsc(W).
Affine mappings (e.g. constructed by klm) may be transposed. This is useful for back projection of data into the original space. For instance: W = klm(A,3); % computes 3-dimensional KL transform B = A*W;
% maps A on W, resulting in B.
C = B*W’;
% back-projection of B in the original space.
A mapping may be given an output selection by W = W(:,J), in which J is a set of indices pointing to the desired classes. B = A*W(:,J); is equivalent to B = A*W; B = B(:,J);
Input selection is not possible for a mapping. - 22 -
For more information, type help mappings. 5.6 Mappings help information Mappings in PRTools are in the MATLAB language defined as objects of the class MAPPING. In the text below, the words ’object’ and ’class’ are used in the pattern recognition sense. In the Pattern Recognition Toolbox PRTools, there are many commands to define, train and use mappings between spaces of different (or equal) dimensionalities. Mappings operate mainly on datasets, i.e. variables of the type DATASET (see also DATASETS) and generate datasets and/or other mappings. For example: if and then
A is an M x K dataset (M objects in a K-dimensional space) W is a K x N mapping (a map from K to N dimensions) A*W is an M x N dataset (M objects in a N-dimensional space)
This is enabled by overloading the *-operator for the MAPPING variables. A*W is executed by MAP(A,W) and may also be called as such. Mappings can be linear (e.g. a rotation) as well as nonlinear (e.g. a neural network). Typically they are used to represent classifiers. In that case, a K x C mapping maps a K-feature data vector on the output space of a C-class classifier (an exception: some 2-class classifiers, like the discriminant functions may be implemented by a mapping onto a 1dimensional space determined by the distance to the discriminant). Mappings are of the data-type MAPPING (CLASS(W) is a MAPPING), have a size of K x C if they map from K to C dimensions. Four types of mapping are defined: - untrained, V = A*W Trains the untrained mapping W, resulting in the trained mapping V. W has to be defined by W = MAPPING(MAPPING_FILE,{PAR1, PAR2}), in which MAPPING_FILE is the name of the routine that executes the training and PAR1, and PAR2 are two parameters that have to be included into the call to THE MAPPING_FILE. Consequently, A*W is executed by PRTools as MAPPING_FILE(A,PAR1,PAR2). Example: train the 3-NN classifier on the generated data W = knnc([],3); % untrained classifier V = gendatd([50 50])*W; % trained classifier - trained, D = B*V Maps the dataset B on the trained mapping or classifier V, e.g. as trained above. The resulting dataset D has as many objects (rows) as A, but its feature size is now C if V is a K x C mapping. Typically, C
- 23 -
is the number of classes in the training set A or a reduced number of features determined by the the training of V. V is defined by V = MAPPING(MAPPING_FILE,’trained’,DATA,LABELS,SIZE_IN,SIZE_OUT), in which the MAPPING_FILE is the name of the routine that executes the mapping, DATA is a field in which the parameters are stored (e.g. weights) for the mapping execution, LABELS are the feature labels to be assigned to the resulting dataset D = B*V (e.g. the class names) and SIZE_IN and SIZE_OUT are the dimensionalities of the input and output spaces. They are used for error checking only. D = B*V is executed by PRTools as MAPPING_FILE(B,W). Example: A = gendatd([50 50],10);% generate random 10D datasets B = gendatd([50 50],10); W = klm([],0.9); % untrained mapping, Karhunen-Loeve projection V = A*W; % trained mapping V D = B*V; % the result of the projection of B onto V - fixed, D = A*W Maps the dataset A by the fixed mapping W, resulting into a transformed dataset D. Examples are scaling and normalization, e.g. W = MAPPING(’SIGM’,’fixed’,S) defines a fixed mapping by the sigmoid function SIGM a scaling parameter S. A*W is executed by PRTools as SIGM(A,S). Example: normalize the distances of all objects in A such that their city block distances to the origin are one. A = gendatb([50 50]); W = normm; D = A*W; - combiner, U = V*W Combines two mappings. The mapping W is able to combine itself with V and produces a single mapping U. A combiner is defined by W = MAPPING(MAPPING_FILE,’combiner’,{PAR1,PAR2}) in which MAPPING_FILE is the name of the routine that executes the combining and PAR1, and PAR2 are the parameters that have to be included into the call to the MAPPING_FILE. Consequently, V*W is executed by PRTools as MAPPING_FILE(V,PAR1,PAR2). In a call as D = A*V*W, first B = A*V is resolved and may result in a dataset B. Consequently, W should be able to handle datasets, and MAPPING_FILE is now called by MAPPING_FILE(B,PAR1,PAR2) Remark: the combiner construction is not necessary, since PRTools stores U = V*W as a SEQUENTIAL mapping (see below) if W is not a combiner. The construction of combiners, however, may increase the transparency for the user and efficiency in computations. Example:
- 24 -
A B V W U T D
= = = = = = =
gendatd([50 50],10);% generate random 10D datasets gendatd([50 50],10); klm([],0.9); % untrained Karhunen-Loeve (KL) projection ldc; % untrained linear classifier LDC V*W; % untrained combiner A*U; % trained combiner B*T; % apply the combiner (first KL projection, % then LDC) to B
Differences a dataset A A*W -
between the four types and a mapping W: untrained : results in trained : results in fixed : results in combiner : treated as
Suppose V is a fixed mapping, then mapping W, the following holds: A*(V*W) - untrained : evaluated - trained : evaluated - fixed : evaluated - combiner : evaluated
of mappings are now summarized for a mapping a dataset, size checking a dataset, no size checking fixed for the various possibilities of the as as as as
V*(A*V*W), resulting in a mapping A*V*W, resulting in a dataset A*V*W, resulting in a dataset A*V*W, resulting in a dataset
Suppose V is an untrained mapping, then for the various possibilities of the mapping W holds: A*(V*W) - untrained : evaluated as A*V*(A*(A*V)*W), results in mapping - trained : evaluated as A*V*W, resulting in a mapping - fixed : evaluated as A*V*W, resulting in a mapping - combiner : evaluated as A*(V*W), resulting in a mapping Suppose V is a trained mapping W holds: A*(V*W) - untrained - trained - fixed - combiner
mapping, then for the various possibilities of the : : : :
evaluated evaluated evaluated evaluated
as as as as
V*(A*V*W), resulting in a mapping A*V*W, resulting in a dataset A*V*W, resulting in a dataset A*(V*W), resulting in a dataset
The data fields stored in the MAPPING W = A*QDC can be found by STRUCT(W) which may display: MAPPING_FILE: ’normal_map’ MAPPING_TYPE: ’trained’ DATA : [1x1 struct] LABELS : [2x1 double] SIZE_IN : 2 SIZE_OUT : 2 SCALE : 1 COST : [] OUT_CONV : 0 NAME : []
- 25 -
USER VERSION
: [] : {1x2 cell
}
These fields have the following meaning: MAPPING_FILE: Name of the m-file that executes the mapping. MAPPING_TYPE: Type of mapping: ’untrained’,’trained’,’fixed’ or ’combiner’. DATA : Parameters or data for handling or executing the mapping. LABELS : Label list used as FEATLAB for labeling the features of the output DATASET. SIZE_IN : Expected input dimensionality of the data to be mapped. If not set, it is neglected, otherwise it is used for the error checking and display of the mapping size on the command line. SIZE_OUT : Dimensionality of the output space. It should correspond to the size of LABLIST. SIZE_OUT may be size vector, e.g. describing the size of an image. See also the FEATSIZE field of DATASET. SCALE : Output multiplication factor. If SCALE is a scalar all multiplied by it. SCALE may also be a vector with size as defined by SIZE_OUT to set separate scalings for each output. COST : Classification costs in case the mapping defines a classifier. OUT_CONV : Defines for trained and fixed mappings the output conversion: 0 - no conversion (to be used for mappings that output confidences or densities; 1 - sigmoid (for discriminants that output distances); 2 - normalization (for converting densities and confidences into posterior probability estimates; 3 - for performing sigmoid as well as normalization. NAME : Name of the mapping, used for informing the user on the command line, as well as for annotating plots. USER : User field, not used by PRTools. VERSION : Some information related to the version of PRTools used for the mapping definition. The fields can be set in the following ways: 1.At the end of the MAPPING construction command by a set of{ fieldname, value pairs}, e.g. W = MAPPING(’affine’,’trained’,DATA,LABELS,5,2,’NAME’,’PCA Mapping’) 2.For a given mapping W fields may be changed similarly by the SET command: W = SET(W,’NAME’,’PCA Mapping’); 3.By the commands SETMAPPING_FILE, SETMAPPING_TYPE, SETDATA, SETLABELS, SETSIZE, SETSIZE_IN, SETSIZE_OUT, SETSCALE, SETOUT_CONV, SETNAME and SETUSER. 4.Using the dot extension as for structures, e.g. A.NAME = ’PCA MAPPING’ The information stored in a mapping can be retrieved as follows: 1.By DOUBLE(W) and by +W the content of the W.DATA is returned. DISPLAY(W) writes the size of the mapping, the number of classes and
- 26 -
the label type on the terminal screen. SIZE(W) returns dimensionalities of input space and output space. SCATTERD(A) makes a scatter-plot of a dataset. SHOW(W) may be used to display images that are stored in mappings with the MAPPING_FILE ’affine’. 2.By the GET command, e.g: [name,user] = GET(W,’NAME’,’USER’); 3.By the commands GETMAPPING_FILE, GETMAPPING_TYPE, GETDATA, GETLABELS, SIZE, GETSIZE, GETSIZE_IN, GETSIZE_OUT, GETSCALE, GETCOST, GETOUT_CONV, GETNAME and GETUSER. 4.Using the dot extension as for structures, e.g. NAME = W.NAME; 5.The routines ISAFFINE, ISCLASSIFIER, ISCOMBINER, ISEMPTY, ISFIXED, ISTRAINED and ISUNTRAINED test on some mapping types and states. Some standard MATLAB operations have been overloaded for variables of the type MAPPING. They are defined as follows: W’ [W V] [W;V]
A*W V*W W+c W(:,K)
Defined for affine mappings only. It returns a transposed mapping. Builds a combined classifier (see STACKED) operating in the same feature space. A * [W V] = [A*W A*V]. Builds a combined classifier (see PARALLEL) operating in different feature spaces: [A B] * [W;V] = [A*W B*V]. W and V should be mappings that correspond to the feature sizes of A and B. Maps a DATASET A by the MAPPING W. This is executed by MAP(A,W). Combines the mappings V and W sequentially. This is executed by SEQUENTIAL(V,W). Defined for affine mappings only. Output selection. If W is a trained mapping, just the features listed in K are returned.
5.7 How to write your own mapping Users can add new mappings or classifiers by a single routine that should support the following type of calls: W = mymapm([], par1, par2, ...); Defines the untrained, empty mapping. W = mymapm(A, par1, par2, ...); Defines the map based on the training dataset A. B = mymapm(A, W); Defines the mapping of dataset A on W, resulting in a dataset B.
To see some examples list the routines kernelm or subsc. Below the subspace classifier subsc is listed. This classifier approximates each class by a linear subspace and assigns new objects to the class of the closest subspace found in the training set. The dimensionalities of the subspaces can be directly set by W = subsc(A,N), in which the integer N
- 27 -
determines the dimensionality of all class subspaces, or by W = subsc(A,alf), in which alf is the desired fraction of the retained variance, e.g. alf = 0.95. In both cases the class subspaces V are determined by a principle component analysis of the single class datasets. The three possible types of calls, listed above are handled in the three main parts of the routine. If no input parameters are given (nargin < 1) or no input dataset is found (A is empty) an untrained classifier is returned. This is useful for calls like W = subsc([],N), defining an untrained classifier that can be used in routines like cleval(A,W,...) that operate on arbitrary untrained classifiers, but also to facilitate training by constructions as W = A*subsc or W = A*subsc([],N). The training section of the routine is accessed if A is not empty and N is either not supplied or set by the user as a double (i.e. the subspace dimensionality or the fraction of the retained variance). PRTools takes care that calls like W = A*subsc([],N) are executed as W = subsc(A,N). The first parameter in the mapping definitions W = mapping(mfilename, ... is substituted by Matlab as ’subsc’ (mfilename is a function that returns the name of the calling file). This string is stored by PRTools in the mapping_file field of the mapping W and used to call subsc whenever it has to be applied to a dataset. The trained mapping W can be applied to a test dataset B by D = B*W or by D = map(B,W). Such a call is converted by PRTools to D = subsc(B,W). Consequently, the second parameter of subsc(), N is now substituted by the mapping W. This is executed in the final part of the routine. Here, the data stored in the data field of W during training is retrieved (class mean, rotation matrix and mean square distances of the training objects) and used to find normalized distances of the test objects to the various subspaces. Finally they are converted to a density, assuming a normal distribution of distances. These values are returned in a dataset using the setdata routine. This dataset is thereby similar to the input dataset: it contains the same object labels, object identifiers, etcetera. Just the data itself is changed and the columns refer now to classes instead of to features. %SUBSC Subspace Classifier % % W = SUBSC(A,N) % W = SUBSC(A,FRAC) % % INPUT % A Dataset % N or FRAC Desired model dimensionality or fraction of retained % variance per class % % OUTPUT % W Subspace classifier % % DESCRIPTION % Each class in the trainingset A is described by linear subspace of % dimensionality N, or such that at least a fraction FRAC of its variance % is retained. This is realised by calling PCA(AI,N) or PCA(AI,FRAC) for % each subset AI of A (objects of class I). For each class a model is % built that assumes that the distances of the objects to the class
- 28 -
% % % % % % % % % % % % %
subspaces follow a one-dimensional distribution. New objects are assigned to the class of the nearest subspace. Classification by D = B*W, in which W is a trained subspace classifier and B is a testset, returns a dataset D with one-dimensional densities for each of the classes in its columns. If N (ALF) is NaN it is optimised by REGOPTC. REFERENCE E. Oja, The Subspace Methods of Pattern Recognition, Wiley, 1984. See DATASETS, MAPPINGS, PCA, FISHERC, FISHERM, GAUSSM, REGOPTC
% Copyright: R.P.W. Duin,
[email protected] % Faculty EWI, Delft University of Technology % P.O. Box 5031, 2600 GA Delft, The Netherlands function W = subsc(A,N) name = 'Subspace classf.'; % handle default if nargin < 2, N = 1; end % handle untrained calls like subsc([],3); if nargin < 1 | isempty(A) W = mapping(mfilename,{N}); W = setname(W,name); return end
if isa(N,'double') & isnan(N) % optimize regularisation parameter defs = {1}; parmin_max = [1,size(A,2)]; W = regoptc(A,mfilename,{N},defs,[1],parmin_max,testc([],'soft'),0); elseif isa(N,'double') % handle training like A*subsc, A*subsc([],3), subsc(A) % PRTools takes care that they are all converted to subsc(A,N) islabtype(A,'crisp'); isvaldfile(A,1,2);
% allow crisp labels only % at least one object per class, two objects % allow for datafiles A = testdatasize(A,'features'); % test whether they fit A = setprior(A,getprior(A)); % avoid many warnings [m,k,c] = getsize(A); % size of the training set for j = 1:c % run over all classes
- 29 -
B = seldat(A,j); % get the objects of a single class only u = mean(B); % compute its mean B = B - repmat(u,size(B,1),1); % subtract mean v = pca(B,N); % compute PCA for this class v = v*v'; % trick: affine mappings in original space B = B - B*v; % differences of objects and their mappings s = mean(sum(B.*B,2)); % mean square error w.r.t. the subspace data(j).u = u; % store mean data(j).w = v; % store mapping data(j).s = s; % store mean square distance end % define trained mapping, % store class labels and size W = mapping(mfilename,'trained',data,getlablist(A),k,c); W = setname(W,name); elseif isa(N,'mapping') % handle evaluation of a trained subspace classifier W for a dataset A. % The command D = A*W is by PRTools translated into D = subsc(A,W) % Such a call is detected by the fact that N appears to be a mapping. W = N; m = size(A,1); [k,c] = size(W); d = zeros(m,c);
% % % %
avoid confusion: call the mapping W number of test objects mappingsize: from K features to C classes output: C class densities for M objects
for j=1:c u = W.data(j).u; v = W.data(j).w; s = W.data(j).s; B = A - repmat(u,m,1); B = B - B*v; d(:,j) = sum(B.*B,2)/s; end d = exp(-d/2)/sqrt(2*pi);
% % % % % % %
run over all classes class mean in training set mapping to subspace in original space mean square distance substract mean from test set differences objects and their mappings convert to distance and normalise
% convert to normal density
A = dataset(A); % make sure A is a dataset d = setdata(A,d,getlabels(W)); % take data from D and use % class labels as given in W % other information in A is preserved W = d; % return result in output variable W else error('Illegal call')
% this should not happen
end return
- 30 -
6. References K. Fukunaga, Introduction to statistical pattern recognition, second edition, Academic Press, New York, 1990. C.M. Bishop, Pattern Recognition and Machine Learning, Springer 2006. E. Gose, R. Johnsonbaugh and S. Jost, Pattern recognition and image analysis, Prentice-Hall, Englewood Cliffs, 1996 S. Theodoridis and K. Koutroumbas, Pattern Recognition, Academic Press, New York, 1999. R.O. Duda, P.E. Hart, and D.G. Stork, Pattern classification, Second Edition, John Wiley and Sons, New York, 2001. A. Webb, Statistical Pattern Recognition, 2nd Ed., Academic Press, 2002. F. van der Heiden, R.P.W. Duin, D. de Ridder, and D.M.J. Tax, Classification, Parameter Estimation, State Estimation: An Engineering Approach Using MatLab, Wiley, New York, 2004, 1-440.
- 31 -
7. A review of the toolbox We will now shortly discuss the PRTools commands group by group. The two basic structures of the toolbox can be defined by the constructors dataset and mapping. In a dataset the feature values of a set of objects are stored, together with their class labels, feature names, prior probabilities, classifications costs and various types of user annotation. There are many commands to store data in and retrieve data from a dataset. These commands can also be used to retrieve or redefine the data. It is thereby not necessary to use the general Matlab converter struct() for decomposing the structures. By getlabels and getfeatlab the labels assigned to the objects and features can be found. The generation and handling of data is further facilitated by genlab for the generation of labels and renumlab for the parsing of labels and coding them into natural numbers between one and the number of classes. These numerical labels can be retrieved by getnlab. They point into a list of class labels called lablist, which can be retrieved by getlablist.
Datasets and Mappings dataset datasets classsizes
Define dataset from data matrix and labels List information on datasets Retrieves sizes of classes
getlabels getnlab
Retrieve object labels from dataset Retrieve numeric object labels from dataset
get
Get fields from datasets or mappings
getfeat
Retrieve feature labels from datasets and mappings
getfeatlab getlablist
Retrieve feature labels from dataset Retrieve names of classes
genclass genlab
Generate class frequency distribution Generate dataset labels
remclass seldat
Remove a class from a dataset Retrieve part of a dataset
setdata addlabels setlabels changelablist multi_labeling matchlab renumlab
Change data in dataset Add additional labelling Change labels of dataset or mapping Change current active labeling List information on multi-labeling Match different labelings Convert labels to numbers
primport
Convert old datasets to present PRTools definition
mapping mappings getlab
Define mapping and classifier from data List information on mappings Retrieve labels assigned by a classifier
- 32 -
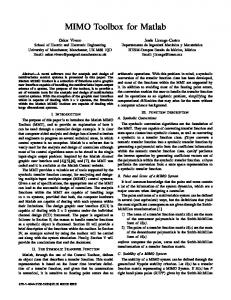
Data Generation
Raw Data
Datafile
Preprocessing
Datafile Dataset
Untrained Mapping
Trained Mapping
Fixed Mapping
Datafile Dataset
Untrained Mapping
Trained Mapping
Evaluation
Visualisation
- 33 -
Fixed Mapping
Data Generation circles3d lines5d gauss gencirc gendat gendatb gendatc gendatd gendath gendati gendatk gendatl gendatm gendatp gendats prdata seldat prdataset prdatasets
Create a dataset containing 2 circles in 3 dimensions Create a dataset containing 3 lines in 5 dimensions Generation of multivariate Gaussian distributed data Generation of a one-class circular dataset Generation of subsets of a given data set Generation of banana shaped classes Generation of circular classes Generation of two difficult classes Generation of Highleyman classes Generation of random windows from images Nearest neighbor data generation Generation of Lithuanian classes Generation of many Gaussian distributed classes Parzen density data generation Generation of two Gaussian distributed classes Read data from file and convert into a dataset Select classes / features / objects from dataset Read existing dataset from file Overview of all datasets and data generators
There is a large set of routines for the generation of arbitrary normally distributed classes (gauss), and for various specific problems (gendatc, gendatd, gendath, gendatm and gendats). There are two commands for enriching classes by noise injection (gendatk and gendatp). These are used for the general test set generator gendatt. A given dataset can be spit into a training set and a test set gendat. The routine gendat splits the dataset at random into two sets. Subsets of datasets can be created by seldat. A total overview of all commands to generate datasets and to read datasets from disk (provided they are available) is given by prdatasets. Datafiles datafile savedatafile filtm
Define datafile from set of files in directory Save datafile, store intermediate result Mapping for arbitrary processing of datafile
These are the main specific datafile commands needed for the user: the definition, saving datafiles and operating on datafiles. Many mappings for datasets can be applied on datafiles as well. They are however just stored internally in the datafile administration and only executed when the datafile is converted to a dataset, OR when when it is stored by savedatafile.
- 34 -
Linear and Higher Degree Polynomial Classifiers klldc pcldc loglc fisherc nmc nmsc perlc quadrc
Linear classifier by KL expansion of common cov matrix Linear classifier by PCA expansion on the joint data Logistic linear classifier
polyc subsc
Add polynomial features and run arbitrary classifier Subspace classifier
classc labeld logdens testc rejectc
Converts a mapping into a classifier Find labels of objects by classification Convert density estimates to log-densities Error estimation of classifiers from test objects Creation of reject version of exisiting classifier
Minimum least square linear classifier
Nearest mean classifier Scaled nearest mean classifier Linear classifier by linear perceptron Quadratic classifier
All routines operate in multi-class problems. labeld and testc are the general classification and testing routines. They can handle any classifier from any routine, including the ones to follow. Classifiers and mappings can be trained by a dataset using commands like W = fisherc(A), or W = knnc(A,3). Such commands may also be written as W = A*fisherc, and W = A*polyc([],[],3). The possibility to assign an untrained classifier to a variable like V = polyc([],[],3) allows for routines that have untrained classifiers as input, e.g. the general classifier evaluation routine cleval (see below). Some more examples, also showing the use of cell arrays of classifiers and datasets: A = gendatb([100,100]); % Generate 2 classes of 100 objects each % Generate 50% for training [Train,Test] = gendat(A,0.5); % and 50% for testing % Define set of untrained classifiers W = {fisherc, loglc, nmc, polyc([],[],3)}; V = Train*W; % Train them all and construct classifiers D = Test*V; % Test them by C E = D*testc;
% Store classification errors
- 35 -
Normal Density Based Classification distmaha meancov nbayesc ldc qdc udc mogc testn
Mahalanobis distance Estimation of means and covariance matrices Bayes classifier for given normal densities Normal densities based linear classifier Normal densities based quadratic classifier Normal densities based classifier(independent features) Mixture of gaussians classification Error estimate of discriminant on normal distributions
Classifiers for normal distributed classes can be trained by ldc, qdc and udc, while nbayesc assumes known densities. The all follow the Bayes rule using the priors stored in the datasets. The special purpose test routine testn can be used if the parameters of the normal distribution (means and covariances) are known or estimated by meancov. Nonlinear Classification knnc testk edicon
k-nearest neighbor classifier Error estimation for k-nearest neighbor rule Edit and condense training sets
parzenc parzendc testp
Parzen classifier Parzen density based classifier Error estimation for Parzen classifier
treec naivebc
Construct binary decision tree classifier Naive Bayes classifier
bpxnc lmnc perlc rbnc neurc rnnc
Train neural network classifier by back-propagation Train neural network by Levenberg-Marquardt rule Linear perceptron Train radial basis neural network classifier Automatic neural network classifier Random neural network classifier
svc nusvc rbsvc kernelc
Support vector classifier Support vector classifier Radial basis SV classifier General kernel/dissimilarity based classification
knnc and parzenc are similar in the sense that the classifiers they build still include all training
objects and that their parameter (the number of neighbors or the smoothing parameter) can be user supplied or can be optimized over the training set using a leave-one-out error estimation. For the Parzen classifier the smoothing parameter can also be estimated by parzenml using an optimization of the density estimation. The special purpose testing routines testk and testp are useful for obtaining leave-one-out error estimations. parzendc is based on a optimization of each of the class densities separately by parzenml.
- 36 -
Decision trees can be constructed by treec, using various criterion functions, stopping rules or pruning techniques. The resulting classifier can be used in labeld, testc and plotc. PRTools offers three neural network classifiers (bpxnc, lmnnc and rbnnc) based on Matlab’s Neural Network Toolbox, which should be available to run these routines. The resulting classifiers are ready to use by labeld, testc and plotc. The automatic neural network classifier neurc builds a network without any parameter setting by the user. Random neural network classifiers can be generated by rnnc. Its first layer is totally random, the second layer is optimized by a linear classifier. The Support Vector Classifier (svc) can be called for various kernels as defined by kernelm. nusvm is a slightly different version in which the regularisation parameter can be defined in terms of the expected error. rbsvm optimizes parameter settings internally. The support vector classifiers are optimized by a quadratic programming procedure. Feature Selection feateval featrank featselb featself
Evaluation of a feature set Ranking of individual feature performances Backward feature selection Forward feature selection
featsellr
Plus-l-takeaway-r feature selection
featseli featselo featselp featselm
Individual feature selection Branch and bound feature selection Pudil’s floating forward feature selection Feature selection map, general routine
The feature selection routines featselb, featself, featseli, featselo and featselp generate subsets of features, calling feateval for evaluating the feature set. featselm offers a general entry for feature selection, calling one of the other methods. All routines produce a mapping W (e.g. W = featself(A,[],k)). So the reduction of a dataset A to B is done by B = A*W.
- 37 -
Classifiers and Tests (general) bayesc classim classc labeld cleval clevalb clevalf confmat costm crossval cnormc disperror logdens labelim mclassc reject roc testc testauc
Bayes classifier by combining density estimates Classify image using a given classifier Convert mapping to classifier Find labels of objects by classification Classifier evaluation (learning curve) Classifier evaluation, bootstrap version Classifier evaluation (feature size curve) Computation of confusion matrix Cost mapping, classification using costs Error estimation by cross-validation Normalization of discriminants Error matrix, information on classifiers and datasets Convert density estimates to log-densities Construct image of labeled pixels Multi-class classifier from 2-class discriminants Compute error-reject curve Compute receiver-operator curve Error estimation routine for trained classifiers Estimate error as area under the ROC
A classifier maps, after training, objects from the feature space into its output space. For two-class discriminants these are sigmoids of distances, for neural networks their unnormalized outputs (i.e. they don’t necessarily sum to one) and for density based classifiers the densities. Discriminants are normalized such that their sigmoid outputs are optimal posterior probability estimates. The dimensionality of the classifier output space equals the number of classes (an exception is possible for two-class classifiers, that may have a one-dimensional output space). This output space may be mapped on posterior probability for other classifiers than discriminants by classc, which takes care of normalization. Classification (determining the class with maximum output) is done by labeld, which generates the labels of that class. A general Bayes plug-in classification if offered by bayesc. This routine expects as inputs proper density estimating routine. Suppose we have one-class datasets A, B and C for which the densities are estimators are determined by WA = gaussm(A,3), WB = knnm(B,5) and WC = parzenm(C), then a Bayes classifier using class priors P = [0.3 0.3 0.4], can be built by W = bayesc(WA,WB,WC,[0.3 0.3 0.4],char(’apple’,’banana’,’coco’)). In order to make various density based classifiers like ldc, udc, qdc, mogc, parzenc, parzendc and knnm comparable, they output the proper densities (e.g. D = B*qdc(A)). For highdimensional spaces this causes that in the tails of the distributions an exact zero density is returned, due to the finite numerical accuracy. This may even be the case for all classes, by which the posterior probabilities, computed after applying classc (D = B*qdc(A)*classc), become undefined. The routine logdens may be used to solve this problem. It forces the density based classifiers based on normal distributions and Parzen estimators (ldc,udec, qdc, mogc, parzenc, parzendc) to a direct computation of log-densities, followed by an appropriate rescaling and an immediate
- 38 -
normalization. Consequently W = qdc(A); D = B*logdens(W) computes better posterior probabilities in the tails of the distribution. This applies for lcd, udc, qdc, mogc, parzenc and parzendc. Error estimates for test data are made by testc and confmat. More advanced techniques like rotating datasets over test sets and training sets, are offered by crossval, cleval and clevalb.
Mappings affine bhatm cmapm featselm fisherm invsigm gaussm kernelm klm klms knnm map mclassm nlfisherm normm parzenm parzenml pca proxm reducm rejectm remoutl scalem sigm spatm kernelm userkernel
Construct affine (linear) mapping from parameters Two-class Bhattacharryya mapping Compute some special maps Feature selection map, general routine Fisher mapping Inverse sigmoid map Mixture of Gaussians density estimation PCA based kernel mapping Decorrelation and Karhunen Loève mapping (PCA) Scaled version of klm, useful for pre-whitening k-Nearest neighbor density estimation General routine for computing and executing mappings Computation of mapping from multi-class dataset Nonlinear Fisher mapping Object normalization map Parzen density estimation ML estimation of Parzen smoothing parameter. Principle Component Analysis Proximity mapping and kernel construction Reduce to minimal space mapping Creates rejecting mapping Remove outliers Compute scaling data Sigmoid mapping Augment image dataset with spatial label information Kernel mapping, dissimilarity representation User supplied kernel definition
gtm plotgtm som plotsom
Fit a Generative Topographic Mapping (GTM) by EM Plot a Generative Topographic Mapping in 2D Simple routine computing a Self-Organizing Map (SOM) Plot a Self-Organizing Map in 2D
mds mds_cs mds_init mds_stress
Non-linear mapping by multi-dimensional scaling Linear mapping by classical scaling Initialization of multi-dimensional scaling Dissimilarity of distance matrices
Classifiers are a special type of mapping, as their output spaces are related to class membership. In general a mapping converts data from one space to another. This may be done by a fixed procedure, not depending on a dataset, but controlled by at most some parameters. Most of these mappings that - 39 -
don’t need training are collected by cmapm (e.g. shifting, rotation, deletion of particular features), another example is the sigmoidal mapping sigm. Some of the mappings that need training don’t depend on the object labels, e.g. the principal component analysis (PCA) by pca, klm and klms, object normalization by normm and scaling by scalem, and nonlinear PCA or kernel PCA by kernelm. The other routines depend on object labels as they define the mapping such that the class separability is maximized in one way or another. The Fisher criterion is optimized by fisherm, the scatter by klm (if called by labelled data), density separability for normal distributions by nlfisherm and general class separability by lmnm.
Combining classification rules averagec baggingc votec maxc minc meanc medianc prodc traincc parsc parallel stacked sequential
Combining linear classifiers by averaging coefficients Bootstrapping and aggregation of classifiers Voting combining classifier Maximum combining classifier Minimum combining classifier Averaging combining classifier Median combining classifier Product combining classifier Train combining classifier Parse classifier or map Parallel combining of classifiers Stacked combining of classifiers Sequential combining of classifiers
Classifiers can be combined by horizontal and vertical concatenation, see section 5.5, e.g. W = [W1, W2, W3]. Such a set of classifiers can be combined by several rules, like majority voting (majorc), combining the posterior probabilities in several ways (maxc, minc, meanc, medianc and prodc), or by training an output classifier (traincc). The way classifiers are combined can be inspected by parsc. Regression linearr ridger lassor svmr ksmoothr knnr pinvr plsr plsm
Linear regression Ridge regression LASSO Support vector regression Kernel smoother k-nearest neighbor regression Pseudo-inverse regression Partial least squares regression Partial least squares mapping
testr rsquared
Mean squared regression error R^2-statistic
- 40 -
Handling images in datasets and datafiles classim dataim data2im getobjsize getfeatsize datfilt datgauss datunif im2obj im2feat spatm show
Classify image using a given classifier Image operation on dataset images. Convert dataset to image Retrieve image size of feature images in datasets Retrieve image size of object images in datasets Filter dataset image Filter dataset image by Gaussian filter Filter dataset image by uniform filter Convert image to object in dataset Convert image to feature in dataset Augment image dataset with spatial label information Display images stored in dataset
Images can be stored, either as features (im2feat), or as objects (im2obj) in a dataset. The first possibility is useful for segmenting images using a vector of values for each pixels (e.g. in case of multi-color images, or as a result of a filter bank). The second possibility enables the classification of entire images using their pixels as features. Such datasets can be displayed by show. The relation with image processing is established by dataim, enabling arbitrary image operations, Simple filtering can be sped up by datfilt, datgauss and datunif.
- 41 -
Operations on images in datasets and datafiles classim Classify image using a given classifier dataim Image operation on dataset images (features or objects) doublem Convert datafile images into double filtim Image operation on objects in datafiles/datasets datfilt Filter dataset image (outdated) datgauss Filter dataset image by Gaussian filter datunif Filter dataset image by uniform filter hsv2rgb Convert HSV to RGB images rgb2hsv Convert RGB to HSV images spatm Augment image dataset with spatial label information im_bdilation Binary dilation im_berosion Binary erosion im_box Bounding box im_bpropagation Binary propagation im_center Center image im_fft FFT transform (and more) im_gaussf Gaussian filtering im_gray Multi-band to gray-value conversion im_hist_equalize Histogram equalization im_invert Invert image im_label Labeling binary images im_maxf Maximum filter im_minf Minimum filter im_resize Resize images im_rotate Rotate images im_scale Scale iamges im_select_blob Select largest blob im_stretch Contrast stretching of images im_threshold Threshold images
For many of these operations the DipImage toolbox is needed, like for the following ones. Feature extraction from images in datasets and datafiles histm im_moments im_mean im_measure im_profile im_stat
Convert images to histograms Computes moments as features from object images Computes center of gravity Computes some measurements Computes image profiles Compute some simple statistics
- 42 -
Clustering and Distances distm emclust proxm hclust kcentres kmeans modeseek
Distance matrix between two data sets. Expectation - maximization clustering Proximity mapping and kernel construction Hierarchical clustering k-centers clustering k-means clustering Clustering by mode seeking
mds mds_cs mds_init mds_stress
Non-linear mapping by multi-dimensional scaling (Sammon) Linear mapping by classical scaling Initialisation of multi-dimensional scaling Dissimilarity of distance matrices
Plotting gridsize plotc plote plotf plotm ploto plotr plotdg scatterd scatterdui scatterr
Set gridsize of scatterd, plotd and plotm plots Plot discriminant function in scatterplot Plot error curves Plot feature distribution Plot mapping in scatterplot Plot object functions Plot error curves Plot dendrogram (see hclust) Scatterplot Scatterplot scatterplot with feature selection Scatter regression dataset
Examples prex_cleval Learning curves prex_combining Classifier combining prex_confmat Confusion matrix, scatterplot and gridsize prex_datafile Datafile usage prex_datasets Show scatter plots of standard datasets prex_density Various density plots prex_eigenfacesUse of images and eigenfaces prex_matchlab Clustering the Iris dataset prex_mcplot Multi-class classifier plot prex_plotc Dataset scatter and classifier plot prex_som Self-organizing map prex_spatm Spatial smoothing of image classification prex_cost Cost matrices and rejection prex_logdens Density based classifier improvement prex_regr Regression example
- 43 -
Various tests and support routines cdats iscolumn iscomdset isdataim isdataset isfeatim ismapping isobjim isparallel isstacked issym isvaldset matchlablist newfig newline nlabcmp prversion showfigs delfigs
Support routine for checking datasets Test on column array Test on compatible datasets Test on image dataset Test on dataset Test on feature image dataset Test on mapping Test on object image dataset Test on parallel mapping Test on stacked mapping Test on symmetric matrix Test on valid dataset Match entries of label lists Control of figures on the screen Generate a new line in the command window Compare two label lists and count the differences returns version information on PRTools Distribute all open figures over screen Delete all figures
- 44 -
8. Examples The following examples are available under PRTools. We present here the source codes and the output they generate. 8.1 PREX_CLEVAL Learning curves help prex_cleval echo on % set desired learning sizes learnsize = [3 5 10 15 20 30]; % generate Highleyman's classes A = gendath([100,100]); % define classifiers (untrained) W = {ldc,qdc,knnc([],1),treec}; % average error over 10 repetitions % test set is complement of training set E = cleval(A,W,learnsize,10); % output E is a structure, specially designed for plotr plotr(E) echo off
Learning curve computed on Higleyman Dataset
Averaged error (10 experiments)
0.4
Bayes−Normal−1 Bayes−Normal−2 1−NN Classifier Decision Tree
0.3
0.2
0.1
0
5
10
15 20 Training set size
- 45 -
25
30
8.2 PREX_COMBINING PRTOOLS example of classifier combining help prex_combining echo on % Generate 10-dimensional data A = gendatd([100,100],10); % Select the training set of 40 = 2x20 objects % and the test set of 160 = 2x80 objects [B,C] = gendat(A,0.2); % Define 5 untrained classifiers, (re)set their names % w1 is a linear discriminant (LDC) in the space reduced by PCA w1 = klm([],0.95)*ldc; w1 = setname(w1,'klm - ldc'); % w2 is an LDC on the best (1-NN leave-one-out error) 3 features w2 = featself([],'NN',3)*ldc; w2 = setname(w2,'NN-FFS - ldc'); % w3 is an LDC on the best (LDC leave-one-out error) 3 features w3 = featself([],ldc,3)*ldc; w3 = setname(w3,'LDC-FFS - ldc'); % w4 is an LDC w4 = ldc; w4 = setname(w4,'ldc'); % w5 is a 1-NN w5 = knnc([],1); w5 = setname(w5,'1-NN'); % Store classifiers in a cell W = {w1,w2,w3,w4,w5}; % Train them all V = B*W; % Test them all disp([newline 'Errors for individual classifiers']) testc(C,V); % Construct combined classifier VALL = [V{:}]; % Define combiners WC = {prodc,meanc,medianc,maxc,minc,votec}; % Combine (result is cell array of combined classifiers) VC = VALL * WC; % Test them all disp([newline 'Errors for combining rules']) testc(C,VC) echo off Errors for combining rules
Errors for individual classifiers klm - ldc NN-FFS - ldc LDC-FFS - ldc ldc
Product combiner Mean combiner Median combiner Maximum combiner Minimum combiner Voting combiner
0.125 0.506 0.100 0.094
- 46 -
0.075 0.275 0.113 0.275 0.094 0.088
8.3 PREX_CONFMAT Confusion matrix, scatterplot and gridsize %PREX_CONFMAT PRTools example confusion matrix, scatterplot and gridsize % Prtools example code to show the use of confusion matrix, % scatterplot and gridsize. help prex_confmat; echo on % Load 8-class 2D problem randn('state',1); rand('state',1); a = gendatm; % Compute the Nearest Mean Classifier w = nmc(a); % Scatterplot figure; gridsize(30); scatterd(a,'legend'); % Plot the classifier plotc(w); title([getname(a) ', Gridsize 30']); % Set higher gridsize gridsize(100); figure; scatterd(a,'legend'); plotc(w); title([getname(a) ', Gridsize 100']); % Classify training set d = a*w; % Look at the confusion matrix and compare it to the scatterplot confmat(d); echo off c = num2str(gridsize); disp(' ') disp('Classifier plots are inaccurate for small gridsizes.The standard'); disp('value of 30 is chosen because of the speed, but it is too low to'); disp('ensure good plots. Other gridsizes may be set by gridsize(n).') disp('Compare the two figures and appreciate the difference.')
Multi−Class Problem, Gridsize 100
Multi−Class Problem, Gridsize 30 7
7
aaa bbb ccc ddd eee fff ggg hhh
6 5
6 5
4
4 Feature 2
Feature 2
aaa bbb ccc ddd eee fff ggg hhh
3 2
3 2
1
1
0
0
−1
−1
−2 −1
0
1
2 3 Feature 1
4
5
6
−2 −1
- 47 -
0
1
2 3 Feature 1
4
5
6
8.4 PREX_DENSITY Various density plots help prex_density figure echo on % Generate one-class data a = gencirc(200);
Bayes−Normal−2 density estimation
Bayes−Normal−U density estimation
4
4
2
2 Feature 2
Feature 2
% Parzen density estimation w = parzendc(a); % scatterplot subplot(2,2,1); scatterd(a,[10,5]); plotm(w); title('Parzen Density') % 3D density plot subplot(2,2,2); scatterd(a,[10,5]); plotm(w,3);
0 −2 −4
−2 −4
−1
0
1 Feature 1
2
3
−1
Parzen Classifier density estimation
0
4
2
2
0 −2 −4
2
3
0 −2 −4
−1
0
1 Feature 1
2
3
−1
0
disp('Study figure at full screen, shrink and hit return') pause figure % Store four density estimators W = {qdc udc parzendc mogc}; % generate data a = +gendath; % plot densities and estimator name for j=1:4 subplot(2,2,j) scatterd(a,[10,5]) plotm(a*W{j}) title([getname(W{j}) ' density estimation']) end echo on
- 48 -
1 Feature 1
Mixture of Gaussians density estimation
4
Feature 2
Feature 2
% Mixture of Gaussians (5) w = mogc(a,5); % scatterplot subplot(2,2,3); scatterd(a,[10,5]); plotm(w); title ... ('Mixture of 5 Gaussians') % 3D density plot subplot(2,2,4); scatterd(a,[10,5]); plotm(w,3); drawnow
0
1 Feature 1
2
3
8.5 PREX_EIGENFACES Use of images and eigenfaces help prex_eigenfaces echo on % load one image for each subject (takes a while) a = faces([1:40],1); % compute eigenfaces w = pca(a); % show them newfig(1,3); show(w); drawnow % project all faces on eigenface space b = []; for j = 1:40 a = faces(j,[1:10]); b = [b;a*w]; % don't echo loops echo off end echo on % show scatterplot of first two eigenfaces newfig(2,3) scatterd(b) title('Scatterplot on first two eigenfaces') % compute leave-one-out error curve featsizes = [1 2 3 5 7 10 15 20 30 39]; e = zeros(1,length(featsizes)); for j = 1:length(featsizes) k = featsizes(j); e(j) = testk(b(:,1:k),1); echo off end echo on %plot error curve newfig(3,3) plot(featsizes,e) xlabel('Number of eigenfaces') ylabel('Error') echo off Scatterplot on first two eigenfaces −3000 −4000
2
−5000 −6000 −7000 −8000 −9000 −4500 −4000 −3500 −3000 −2500 −2000 −1500 −1000 1
- 49 -
8.6 PREX_MATCHLAB Clustering the Iris dataset help prex_matchlab echo on rand('state',5); a = iris; % Find clusters in Iris dataset. J1 = kmeans(a,3); % Finds about the same clusters but labels them J2 = kmeans(a,3); % differently due to random initialization. confmat(J1,J2); % 'best' rotation of label names as [J3,C] = matchlab(J1,J2); % confusion matrix is now almost diagonal. confmat(J1,J3); % Conversion from J2 to J3: J3 = C(J2,:); C echo off
| Estimated Labels True | Labels | 1 2 3 | Totals -------|---------------------|------1 | 0 38 0 | 38 2 | 61 1 0 | 62 3 | 0 0 50 | 50 -------|---------------------|------Totals | 61 39 50 | 150
| Estimated Labels True | Labels | 1 2 3 | Totals -------|---------------------|------1 | 38 0 0 | 38 2 | 1 61 0 | 62 3 | 0 0 50 | 50 -------|---------------------|------Totals | 39 61 50 | 150
- 50 -
8.7 PREX-MCPLOT Multi-class classifier plot help prex_mcplot echo on gridsize(100) % generate 2 x 2 normal distributed classes a = +gendath([20,20]);% data only b = +gendath([20,20]);% data only A = [a; b + 5];% shift 2 over [5,5] % generate 4-class labels lab = genlab([20 20 20 20],[1 2 3 4]'); A = dataset(A,lab);% construct dataset A = setname(A,'4-class dataset') % plot this 4-class dataset figure scatterd(A,'.'); drawnow; % make scatter plot for right size w = qdc(A);% compute normal densities based quadratic classifier plotc(w,'col'); drawnow; % plot filled classification regions hold on; scatterd(A); % redraw scatter plot hold off echo off
4−class dataset 8 6
Feature 2
4 2 0 −2 −4 0
2
4 Feature 1
- 51 -
6
8
8.8 PREX_PLOTC Dataset scatter and classifier plot help prex_plotc echo on % generate Highleyman data A = gendath([100 100]); % split in training and test set [C,D] = gendat(A,[20 20]); % compute classifiers w1 = ldc(C); % linear w2 = qdc(C); % quadratic w3 = parzenc(C); % Parzen w4 = lmnc(C,3); % neural net % compute and display errors W = {w1,w2,w3,w4}; % store classifiers in cell disp(D*W*testc); % plot errors % plot data and classifiers figure scatterd(A); % scatterplot plotc({w1,w2,w3,w4}); % plot classifiers echo off
Higleyman Dataset Bayes−Normal−1 Bayes−Normal−2 Parzen Classifier Levenberg−Marquardt Neur Classf
6
Feature 2
4 2 0 −2 −4 −2
−1
0 1 Feature 1
- 52 -
2
3
8.9 PREX_SPATM Spatial smoothing of image classification help prex_spatm echo on % load EM image a = emim31; % extract small training set b = gendat(a,500); % use it for finding 3 clusters [d,w] = emclust(b,nmc,3); % classify entire image and show it c = a*w; classim(c); title('Original classification') % smooth image, % combine spectral and spatial classifier, show it e = spatm(c)*maxc; figure classim(e); title('Smoothed classification') echo off
Original classification
Smoothed classification
20
20
40
40
60
60
80
80
100
100
120
120 20
40
60
80
100
120
20
- 53 -
40
60
80
100
120
8.10 PREX_COSTM PRTools example on cost matrices and rejection Prtools example code to show the use of cost matrices and how to introduce a reject class. % Generate a three class problem randn('state',1); rand('state',1); n = 30; class_labels = char('apple','pear','banana'); a = [gendatb([n,n]); gauss(n,[-2 6])]; laba = genlab([n n n],class_labels); a = setlabels(a,laba); % Compute a simple ldc w = ldc(a); % Scatterplot and classifier figure; gridsize(30); scatterd(a,'legend'); plotc(w); % Define a classifier with a new cost matrix, % which puts a high cost on misclassifying % pears to apples cost = [0.0 1.0 1.0; 9.0 0.0 1.0; 1.0 1.0 0.0]; wc = w*classc*costm([],cost,class_labels); plotc(wc,'b'); % Define a classifier with a cost matrix where % an outlier class is introduced. For this an % extra column in the cost matrix has to be defined. % Furthermore, the class labels have to be supplied % to give the new class a name. cost = [0.0 1.0 1.0 0.2; 9.0 0.0 1.0 0.2; 1.0 1.0 0.0 0.2]; class_labels = char('apple','pear','banana','reject'); wr = w*classc*costm([],cost,class_labels); plotc(wr,'--') The black decision boundary shows the standard ldc classifier for this data. When the misclassification cost of a pear to an apple is increased, we obtain the blue classifier. When on top of that a rejection class is introduced, we get the blue dashed classifier. In that case, all objects between the dashed lines are rejected. Cost of basic classifier = Cost of cost classifier = Cost of reject classifier =
0.51 0.24 0.10
- 54 -
- 55 -
8.11 PREX_LOGDENS Improving density based classifiers This example shows the use and results of LOGDENS for improving the classification in the tail of the distributions % Generate a small two-class problem randn('state',1); rand('state',1); a = gendatb([20 20]); % Compute two classifiers: Mixture of Gaussians and Parzen w_mogc = mogc(a); w_mogc = setname(w_mogc,'MoG'); w_parz = parzenc(a); w_parz = setname(w_parz,'Parzen'); % Scatterplot with MoG classifier subplot(3,2,1); scatterd(a); plotc(w_mogc); xlabel(''); ylabel(''); set(gca,'xtick',[],'ytick',[]) title('MoG density classifier','fontsize',12) drawnow % Scatterplot with Parzen classifier subplot(3,2,2); scatterd(a); plotc(w_parz); xlabel(''); ylabel(''); set(gca,'xtick',[],'ytick',[]) title('Parzen density classifier','fontsize',12) drawnow % Scatterplot from a distance : % far away points are inaccurately classified subplot(3,2,3); scatterd([a; [150 100]; [-150 -100]]); plotc(w_mogc); xlabel(''); ylabel(''); set(gca,'xtick',[],'ytick',[]) title('MoG: bad for remote points','fontsize',12) drawnow % Scatterplot from a distance : % far away points are inaccurately classified subplot(3,2,4); scatterd([a; [20 12]; [-20 -12]]); plotc(w_parz); xlabel(''); ylabel(''); set(gca,'xtick',[],'ytick',[]) title('Parzen: bad for remote points','fontsize',12) drawnow % Improvement of MOGC by LOGDENS subplot(3,2,5); scatterd([a; [150 100]; [-150 -100]]); plotc({w_mogc,logdens(w_mogc)},['k--';'r- ']); legend off xlabel(''); ylabel(''); set(gca,'xtick',[],'ytick',[]) title('MoG improved by Log-densities','fontsize',12) drawnow
- 56 -
% Improvement of PARZEN by LOGDENS subplot(3,2,6); scatterd([a; [20 12]; [-20 -12]]); plotc({w_parz,logdens(w_parz)},['k--';'r- ']); legend off xlabel(''); ylabel(''); set(gca,'xtick',[],'ytick',[]) title('Parzen improved by Log-densities','fontsize',12) echo off This example shows the use of the logdens() routine. It improves the classification in the tails of the distribution, which is especially important in high-dimensional spaces. To this end it is combined with normalization, generating posterior probabilities. Logdens() can only be applied to classifiers based on normal densities and Parzen estimates.
- 57 -
9. PRTools 4.0 release notes This is section supplies some information about changes in PRTools4.0 with respect to the PRTools3.1 versions. Changes are major and sometimes incompatible. A number of changes only involve the fundamental definitions, but are not is not yet implemented on the user level. 9.1 Datasets The dataset construct has been entirely redefined and rewritten. See datasets (section 5.2) for an online description. Many fields are added. There are separate commands for setting and getting each field separately like setlabels(A,labels). The main change for the user is that there are three different types of labels supported: ’crisp’ (as it was), ’soft’ (on the [0,1] interval) and ’targets’ (a multidimensional vector for each object). In the present state all higher level commands work for crisp labels and some for soft labels (e.g. for normal distributions) but nothing for targets. Also checking for appropriate labels is not done yet. As long as crisp labels are most routines work like before. A new system has been created for keeping track of images stored as features or objects. In the size fields of datasets the image sizes are stored. Datasets, classes and features may have names that are used to annotate plots. During creation of a dataset objects are given a unique identifier, that is not changed anymore by PRTools. This enables the user to retrieve the original object from, for instance, the classification dataset, also after random selection of a test set. See setident, getident, findident and seldat. Objects may be unlabeled. Such objects are not used for training classifiers. For features domains may be defined for their values. Checking is done when dataset values or domain definitions change. See setfeatdom. Programmers have to take care that all needed information is passed from one dataset to the other. The best thing to do is to ‘copy’ old datasets and create a new one by changing the data, .e.g. B = setdata(A,data,featlab) creates B out of A with new data and new names for the features, assuming that we have the same objects, object labels, prior probabilities, etcetera. 9.2 Mappings The mapping construct has been redefined and rewritten as well. See mappings for online information. Now a clear distinction is made between four types of mappings: untrained, trained, fixed and combiner. In the mapping definition the programmer has to specify the type explicitly. PRTools has to know about these types as they are treated differently: - untrained mapping cannot map data, but define the choice of the mapping and contain some parameter choices, e.g. W = ldc([],1e-6) defines a regularization value. Untrained mappings are useful for routines like cleval and featself that evaluate or use arbitrary untrained classifiers. V = A*W produces a ’trained’ mapping. How training (and also execution) of mappings
- 58 -
is done is not hidden anymore for the user. Each mapping definition contains a mapping_file field that points to the file by which this further processing is performed. - trained mappings map a dataset form one space to another, so D = B*V maps the dataset B by a trained classifier V from the feature space to a ‘classification’ space: each object has values for each class, e.g. a distance, a density, a posterior probability, a membership, etcetera. Routines for trained mappings typically have three ways they are called by PRTools and thereby have three program sections: the untrained call or definition, the training and the execution. See kernelm for a typical example. Sometimes execution is shared by some routines, e.g. normal_map handles all execution of normal densities based mappings. - fixed mappings are like trained mappings but don’t find their parameter values by training. Instead, they are set by other routines or by the user. As a result they don’t a part for training. So if W = sigm([],p), defining the sigmoid mapping, then W is called fixed (and not untrained) as A*W results in a dataset (B = sigm(A,p)) and not in a trained mapping. - combiners are mappings that know how to handle other mappings. If V is a mapping and W is a combiner (e.g. W = maxc) then V*W results in a call like U = maxc(V), in which U is an untrained or a trained mapping, dependent on V. If W is not a combiner, then V*W is stored as such in U (called a sequential mapping, which again can be trained or untrained) and execution is postponed until a dataset has to be processed by A*U = A*(V*W). How this is done depends on the mapping types of V and W. All the above is not really of importance for the users of PRTools, but just for programmers that like to write new mappings. For some users it may be of interest that the overload of the ‘*’ operator can always be avoided by map(), e.g. V = A*W is identical to V = map(A,W). The use of prior probabilities is now restricted to density based classifiers and the computation of means and covariance matrices over classes. If this has to be avoided, use A = setprior(A,[]), by which class priors are made identical to class frequencies. 9.3 The user level The old set of user routines has been corrected for the new definitions of datasets and mappings. During this revision some old constructs have been upgraded or removed. Some routines have been simplified (like testc, the new version of testc). Also plotd has been renamed to plotc for more consistency: plotc plots classifiers, plotm mappings (densities). Plotting routines have been extended and another default font size is introduced. On the whole, PRTools should behave about the same as before on the user level . Existing macros, however, have to be checked for sure. Important for users is that mappings like B*fisherc(A) now output unnormalized posterior probability estimates (class memberships) or for density based classifiers (B*qdc(A)) the true density. So this output is always positive. The routine classc takes care of normalization, converting outputs into proper posterior estimates: B*lmnc(A)*classc, or B*qdc(A)*classc. This new implementation may result in accuracy problems as densities may suffer from underflows in large areas of the feature space. For the normal density based classifiers like ldc,qdc and udc this can be circumvented by the use of logdens in the classifier definition (e.g. B*(qdc(A)*logdens) ). In that case log-densities are stored instead of densities.
- 59 -
10. PRTools 4.1 release notes This is section supplies some information about changes in PRTools4.1 with respect to PRTools4.0 A number of new possibilities has been created important for the handling of large datasets, multiple labels of objects, the optimisation of complexity and regularisation parameters and the handling of regression problems. 10.1 Compatibility Changes are generally upwards compatible. With a few exceptions old routines should still work. The main exception is that the undocumented feature of PRTools4.0 to obtain fields from dataset and mapping variables using the dot-construct (e.g. classnames = a.lablist) has been changed. From now on the official and guaranteed way to address fields is by using the get-commands (e.g. classnames = getlablist(a)). The reason is that for a number of fields subfields have been defined using structures, structure arrays and cell arrays. So users are urged to use the get-and setcommands as also in future releases the constructions may change. PRTools still recognizes datasets contructed in the old way and automatically converts them. 10.2 Datafiles A new object class, datafile, has bee created. The datafile class inherits most of the fields and methods of the dataset class, but extends them by allowing data that is not in core but stored in files on disk. As these may be large, handling of datafiles is restricted to administration, like desired sampling of objects and features and preprocessing (e.g. filtering and resizing of images). At some moment a datafile has to be converted into a dataset and it should fit then in the available memory. Datafiles are important to the extend PRTools possibilities with preprocessing and feature measurements within the same framework. Thereby classifiers may be designed and trained that can directly operate on raw images or other signals without the need to convert them first to datasets. For more information read datafiles help file. 10.3 Image processing routines In relation with the above a large set of image processing routines operating on datafiles and datasets has been included. They are helpful to convert (sets of) images to features and datasets. A number of them assume that the dip_image toolbox is available. 10.4 Multiple labels For some applications it is useful to have multiple labelings of the objects. For instance, pixels may be labeled according to the image region (grass, water, rock) as will as to the image category (mountains, seaside, city) as well as to some origin (France, England, Norway). A provision has been created to enable this. The various labelings and corresponding priors (and targets in case of soft labeling) are stored in the dataset, but just one of them is active and is accessed by getlablist, getlabels, getprior and getnlab. For more information read he multi_labeling help file.
- 60 -
10.5 Optimisation of complexity parameters and regularisation Many trainable classifiers and mappings depend on some parameter controlling its complexity or regularisation. A general routine has been created to optimise such parameters by cross-validation. This is always done in a standard way: 20 steps of 5-fold cross-validation. This increases the training time roughly by a factor 100. The automatic optimisation is activated (for the routines for which it is implemented) by using a NaN in the function call. So w=ldc(a) uses no regularisation, w=ldc(a,1e-6) uses a user defined value of 1e-6 and w=ldc(a,NaN) activates the automatic optimisation. The actually used parameter value may be retrieved afterwards by the routine getopt_pars. 10.6 Regression PRTools has already for a long time the possibility of datasets consisting of feature based vectors with one or more desired target values (the have the label type ’targets’ instead of ’crisp’ or ’soft’). Now a set of routines has been added to make use of this option, e.g. linearr for linear regression, svmr for support vector machine regression and testr of evalution. 10.7 Object and dataset annotation Datasets and objects inside datasets have fields to annotate them (’user’ and ’ident’). They are now structures and the routines for setting (setuser and setident) and reading (getuser and getident) can handle them. 10.8 Kernels A general routine has been added for defining kernels: kernelm. This routine may be used in the support vector classifiers svc and nusvc as well as in the general kernel based classifier kernelc. 10.9 Support vector classifiers The call of the general support vector classifier svc has been upgraded such that it included a recognizable kernel definition. In addition two other support vector classifiers are added, nusvc for using a regularisation parameter based on the expected error and rbsvc, which is parameter free as it estimates automatically the optimal radial basis kernel and the regularisation parameter. 10.10 Rejects Routines rejectc and rejectm have been added to facilitate the construction of rejecting classifiers. They add class labels on the output that are NaN or ’’ (empty string), the PRTools standard label for unlabeled objects.
- 61 -