PSE: Explaining Program Failures via Postmortem Static Analysis Roman Manevich Tel Aviv University
[email protected]
Manu Sridharan University of California Berkeley manu
[email protected]
ABSTRACT In this paper, we describe PSE (Postmortem Symbolic Evaluation), a static analysis algorithm that can be used by programmers to diagnose software failures. The algorithm requires minimal information about a failure, namely its kind (e.g. NULL dereference), and its location in the program’s source code. It produces a set of execution traces along which the program can be driven to the given failure. PSE tracks the flow of a single value of interest from the point in the program where the failure occurred back to the points in the program where the value may have originated. The algorithm combines a novel dataflow analysis and memory alias analysis in a manner that allows for precise exploration of the program’s behavior in polynomial time. We have applied PSE to the problem of diagnosing potential NULL-dereference errors in a suite of C programs, including several SPEC benchmarks and a large commercial operating system. In most cases, the analysis is able to either validate a pointer dereference, or find precise error traces demonstrating a NULL value for the pointer, in less than a second.
Categories and Subject Descriptors D.2.4 [Software Engineering]: Software/Program Verification; D.2.5 [Software Engineering]: Testing and Debugging
General Terms Algorithms, Reliability, Security, Verification
Keywords Postmortem analysis, Value flow, Alias analysis, Typestate
1.
INTRODUCTION
The advent of the internet has opened up a new opportunity for software providers to find and fix failures exposed
Permission to make digital or hard copies of all or part of this work for personal or classroom use is granted without fee provided that copies are not made or distributed for profit or commercial advantage and that copies bear this notice and the full citation on the first page. To copy otherwise, to republish, to post on servers or to redistribute to lists, requires prior specific permission and/or a fee. SIGSOFT’04/FSE-12, Oct. 31–Nov. 6, 2004, Newport Beach, CA, USA. Copyright 2004 ACM 1-58113-855-5/04/0010 ...$5.00.
Stephen Adams, Manuvir Das, Zhe Yang Center for Software Excellence Microsoft Corporation @microsoft.com by the use of their software in the field. It is now possible for users to send back crash reports, containing minimal information about the failure including failure location and stack dump, to the software provider. The Dr. Watson system [9] used by Microsoft is a good example. Unfortunately, the manual effort involved in diagnosing these failures is high enough that support teams are unable to deal with a large fraction of the reported issues. A tool that helps programmers quickly diagnose program failures, given minimal information, could significantly increase the number of failure reports that may be addressed. Manual inspection of program failures is time consuming for the following reasons: • Full execution traces are not available, because of the overhead of recording and transmitting this information. Also, the same failure may arise along multiple execution paths, all of which must be fixed in order to eliminate the failure. • Execution traces may be very long, may require a lot of book-keeping, and may contain many irrelevant computations. In this paper, we present PSE, a static analysis algorithm that addresses the first problem above. Given minimal information about a particular program failure, PSE automatically reconstructs a set of failing execution traces. PSE is able to handle a particular class of failures referred to as “typestate” errors [22]. Every object created during the execution of a program has a type, which does not change during execution, as well as a typestate, which is changed by operations in the program. Many common programming errors can be expressed as sequences of operations that transition an object to a special error typestate. For example, the dereference operation on a NULL pointer value transitions it to the error typestate; a write operation using a closed file handle transitions the file handle to the error typestate. Our algorithm requires the following input: a typestate specification of the failure, the program location l of the failure, and the “witness” memory location that holds the object of interest at l. Example 1. Consider the problem of diagnosing a NULL dereference error at program location 9 in the program shown in Figure 1(a). The typestate specification of failure is given in Figure 2(a); the failing program location is label 9; the witness memory location is y. 2
(a) [1] [2] [3] [4] [5] [6] [7] [8] [9]
(b) foo(rec * x, rec * z) { p = z->f; if (c) { d = 0; } else { d = 1; } if (b) { y = z; } else { y = x->f; } *y = ...; }
error super-trace 1 hx->f, hx->f, hx->f, hx->f,
{unsafe}i {unsafe}i {unsafe}i {unsafe}i — hx->f, {unsafe}i — hx->f, {unsafe}i — — hx->f, {unsafe}i — hy, {unsafe}i initial value : hy, {error}i
non-error super-trace 2 — hz, {}i hz, {unsafe}i hz, {unsafe}i — hz, {unsafe}i — hz, {unsafe}i hz, {unsafe}i — — — hy, {unsafe}i initial value : hy, {error}i
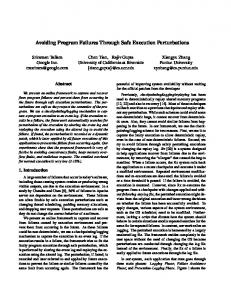
Figure 1: Example program and traces. Figure (a) above shows an example C program with a NULL dereference failure at label 9. All undeclared variables are global. Figure (b) above shows two super-traces discovered by our analysis. These traces are explained in Section 4. PSE (Postmortem Symbolic Evaluation) is a backwards value flow analysis that is based on the following insight: We are given the initial witness, i.e. the memory location which holds the value of interest at the point of failure. Starting from this point, we can step back through the statements in the program, using the effect of assignments to recompute the witness at every point. In this way, we transfer the blame for the error along the execution trace until we reach a point where the value was created, in which case we have found a failing execution trace, or we reach a contradiction, in which case we can rule out the particular trace. If no traces are found, we have shown that the error cannot occur. Failing traces are decorated with witness information from the dataflow analysis, providing the programmer with a history of how the value of interest was transferred along the failure path. PSE is path-sensitive, in the sense that information from different traces along which the witness is different is never merged. However, at any given program point, there are at most as many witnesses as the variables1 in the program. Therefore, we are able to obtain a path-sensitive algorithm that runs in polynomial time. In this paper we make the following contributions: • We describe a polynomial-time dataflow analysis for producing execution traces that show how a value flowed through a program to reach a particular failure point. Our analysis handles pointer-manipulating programs and is demand-driven, only performing work relevant to the identified failure point. • We describe an additional set of techniques that improve the scalability, accuracy, and usefulness of our core dataflow analysis. These techniques include the use of typestate information to eagerly prune infeasible traces, incorporation of stack-trace information when available, and methods for trading off soundness to improve the analysis results. • We use our analysis to diagnose potential NULL dereference errors in several SPEC benchmarks and the 1 More precisely, there are as many witnesses as the number of abstract memory locations used by the analysis.
Windows operating system. In most cases, the analysis is able to either validate a pointer dereference, or find precise error traces demonstrating a NULL value for the pointer, in less than a second. An alternative approach to PSE is to apply forwards analysis and find all failures matching a typestate specification. There are many examples of such systems [7, 8, 5, 11, 17]. The drawback of the forwards approach is that it is not demand driven; in particular, it may explore many paths through the program that do not lead to any failure. Our algorithm does not explicitly focus attention on the root causes of the failure within a trace. Rather, it can be combined with a technique for fault localization [1, 2, 13, 19, 16, 20, 6, 4] to provide a complete solution for postmortem analysis. The rest of the paper is organized as follows: In Section 2, we compare our technique with related work. In Section 3, we present a running example of our analysis on a small C program. In Section 4, we describe our analysis in detail. In Section 5, we evaluate the precision and scalability of our analysis. We conclude in Section 6.
2. RELATED WORK PSE can be viewed as a backwards typestate checker. Typestate [22] extends the ordinary types in the program, which remain invariant through the lifetime of an object, with a set of states between which values of a given type can transition. Many common failures, including memory leaks, double frees, NULL dereference and uninitialized data usage are simple instances of typestate errors.
2.1 Fault localization There is a large body of previous work on fault localization, the goal of which is to provide an explanation of a fault in a given execution trace [1, 2, 13, 19, 16, 20, 6, 4]. Our work is complementary to fault localization. We solve the problem of producing execution traces in an environment where they are not available, e.g. a bug report from the field. Therefore, our technique can be combined with
(a)
(b)
{uninit} uninit
create
unsafe
deref
create
{unsafe}
deref
{error}
deref
error
{} *
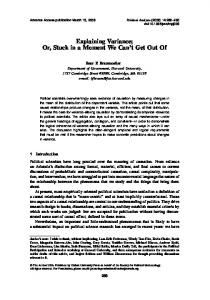
Figure 2: Example typestate specification. Figure (a) above shows the states associated with NULL values created during program execution. Any dereference of a NULL value moves the NULL value to the error typestate. The arrow emanating from ‘•’ marks the initial typestate; the double-circled states are the automaton’s accepting states. Figure (b) above shows the reversed automaton. The ‘{}’ state represents an empty set of states, indicating a non-failing trace. ‘*’ stands for any statement. fault localization techniques to provide a complete solution to diagnosis of program failures.
2.2 Backwards analysis Our algorithm tracks abstract information about program behavior backwards through the control flow of a program. Therefore, it is derived from the rich body of work on backwards dataflow analysis [3]. Liblit et. al. [18] first identified the problem that our work addresses. Their algorithm reconstructs, and compactly represents, all CFL-realizable failure traces2 that lead to the failure location. However, their trace exploration algorithm ignores value flow, leading to a large number of superfluous failure traces. Strom and Yellin [23] define a partially path-sensitive backwards dataflow analysis for checking typestate properties, specifically uninitialized variables. We are able to track a value backwards through pointer-based data structures and handle memory aliasing. Both of these advances over their work are necessary for dealing with real programs. We do not detect infeasible paths through simulation of program state. Another method for backwards dataflow analysis is program slicing [25, 24]. Program slicing reduces the amount of information a programmer has to consider by removing statements which cannot affect the failing statement. However, traditional static slicing techniques are not precise enough for postmortem analysis because they do not consider the error condition itself. Our analysis can be viewed as an instance of slicing that operates with respect to a given predicate at the failure label (e.g., that the pointer being dereferenced holds the NULL value). Our analysis can also be viewed as an instance of weakest preconditions [14]. We are able to handle pointer-based data structures and aliasing.
2.3 Forwards analysis An alternative approach to postmortem analysis is to symbolically evaluate the program forwards, using strongest postconditions [14]. In recent years, a multitude of typestate checkers that use some degree of strongest postconditions have been developed [7, 8, 5, 11, 17]. These algorithms are not demand-driven; in particular, their exploration cannot be tuned to a particular failure at a particular program location. 2
Traces with matched calls and returns.
The forwards analysis most similar to PSE is the property simulation algorithm employed by ESP [11]. The value flow computation in PSE can be viewed as the backwards counterpart of the forwards value-alias computation in ESP [15] (hence the name PSE).
3. EXAMPLE Example 2. Figure 1 shows a C program and two supertraces discovered by PSE. Each super-trace represents a set of traces. The input to PSE consists of the typestate automaton from Figure 2(a), failure location 9, and “witness” memory location y. In the automaton of Figure 2(a), the create transition occurs when NULL is assigned to an l-value (i.e., a memory location). This transition moves NULL into the unsafe state. The deref transition occurs when an l-value containing NULL is dereferenced. Because PSE is a backwards analysis, we reverse the automaton, as shown in Figure 2(b) (see Section 4.1). The first super-trace discovered by PSE describes two potentially crashing execution traces: [1, 2, 3, 4, 6, 8, 9] and [1, 2, 3, 5, 6, 8, 9]. Both executions result in a NULL dereference of the program variable y. The error arises because the program fails to check that x->f is nonNULL. The super-trace supplies, for each program point, information pertaining to the state of the program just before the corresponding statement is executed. The information is in the form of state tuples with the following components: 1. A witness l-value that holds the object that transitioned to the error typestate at the failure location.. 2. The typestate of the tracked object, taken from the reversed automaton. The information in the first super-trace, along with the source code of the statements along the trace, implies that in order for the program to crash at program point 9 with a NULL dereference, the following conditions must hold: Upon entry to function foo, x->f should evaluate to NULL, b should evaluate to 0 (point 8 is executed), and x should evaluate to a non-NULL value (x is successfully dereferenced at program point 8). This information can be used to understand the source of the crash and also to create a test case that recreates the failure scenario.
The two traces mentioned above are grouped into a single super-trace because they differ only in the way the condition at label 3 is handled. This condition is considered irrelevant, since it affects neither the l-value that holds the object of interest nor its typestate. The analysis discovers this fact and merges both traces into a single error super-trace. Along with helping to emphasize important statements in potentially long traces, trace merging also helps the analysis avoid an exponential blow-up in the number of traces it explores. The same technique is used by the forwards analysis in ESP [11, 15]. The second super-trace represents the traces [1, 2, 3, 4, 6, 7, 9] and [1, 2, 3, 5, 6, 7, 9], which are nonfailing, as indicated by the state tuple hz, {}i at program point 2. The state tuple hz, {}i results from a contradiction discovered between the information in the state tuple hz, {unsafe}i at label 3, which indicates that the variable z evaluates to NULL, and the assignment at program point 2, which must successfully dereference z in order for later program points to execute. This impossible typestate transition is represented by a transition to the {} state in the reversed automaton of Figure 2(b). PSE is successful in determining that all traces passing through program point 7 are non-failing. 2 Comparison with program slicing: Applying program slicing to the example program with the variable y and program point 9 would result in a slice containing the set of program points {1, 2, 6, 7, 8, 9}. Program point 7 is included in the slice because it influences the value of variable y at program point 9 in some execution. However it is not relevant because it does not affect the value of y in any executions that lead to a NULL dereference error. Comparison with reachability analysis: Applying the analysis of Liblit et. al. [18] to the example would yield all 4 possible execution paths from label 1 to label 9, and no additional information on how NULL was transferred to y. Comparison with forwards analysis: A path-sensitive forwards analysis that tracks the typestate of x->f from the beginning of the function would identify the correct set of execution traces. However, the analysis would need to track the typestate of every pointer that could evaluate to NULL at the beginning of the function. This approach would be unlikely to scale in practice.
4.
POSTMORTEM ANALYSIS
In this section, we describe our postmortem static analysis algorithm in detail.
4.1 Reversing the typestate automaton Since our analysis traverses traces backwards, we reverse the typestate automaton in order to compute the set of states before each statement executes. We first describe our forward automata in greater detail. A forwards automaton A is a tuple hT, C, SF , I, δi, defined as follows: • T is a finite alphabet naming transitions. • C ⊆ T is a set of distinguished creation transition names.
• SF is the set of forward typestates, including error. • I is the set of initial typestate. • δ ⊆ SF × T × SF is the transition relation. The creation transition names in C correspond to program events that create an object whose typestate is to be tracked, for example the initial assignment of NULL to a variable for the NULL dereference property. The transition relation δ is required to be adequately and properly defined, in the following sense: • δ is deterministic: ∀ s, s0 , s00 ∈ SF , t ∈ T.((s, t, s0 ) ∈ δ) ∧ ((s, t, s00 ) ∈ δ) ⇒ s0 = s00 . • Creation transitions must originate at the initial typestate: δ ∩ (SF − I) × C × SF = ∅. • There is no unspecified behavior: ∀ s ∈ SF − I − {error}, t ∈ T − C. ∃ s0 ∈ SF . (s, t, s0 ) ∈ δ (δ is total for non-initial or error typestates and non-creation transitions) The reversal algorithm is straightforward. Given the forward automaton, we first reverse δ, yielding a possibly nondeterministic automaton since some typestates may have multiple incoming edges with the same label in the forward automaton. We then perform a standard NFA to DFA transformation [3], which uses the powerset construction, to obtain the reversed automaton. We write SB ⊆ 2SF for the set of typestates in the reversed automaton, and δB : SB × T → SB for its transition relation, which is total and deterministic and thus can be written as a function. It is possible that the original automaton does not contain incoming edges for certain combinations of states and transitions. The reversed automaton, therefore, could have transitions to the empty terminal typestate {}, indicating that the forward transition is infeasible. These transitions to {} in effect refute superflous traces, thus improving the precision of the analysis. Example 3. In the automaton for the NULL dereference property (Figure 2(a)) the unsafe typestate does not have an incoming deref transition. In the reversed automaton (Figure 2(b)), the deref transition from the {unsafe} typestate to {} indicates that the forward execution twice dereferenced NULL. This is impossible, since the first dereference would have crashed the program. 2
4.2 A simple pointer language We define a simple language of pointer assignments, shown in Figure 3. A pointer expression (PointerExpr ) is either a variable or a field dereference of another pointer expression (e.g., x->f->g), with a dereference using the C ‘*’ operator treated as a dereference of the ALL field. The program points at which objects with relevant typestate are created are represented by an assignment of the scalar value CREATE. A transition statement (TransStmt ) is a statement that potentially changes the typestate of the value referenced by its pointer expression. Transition statements are inserted at program points that match certain source code patterns, by a separate prepass. They are the only statements that can affect an object’s typestate. Figure 4 presents some of the source code patterns for the NULL dereference property. The full specification includes patterns for functions like malloc() that
Field = ALL + FieldNames PointerExpr ::= Var | PointerExpr → Field LhsExpr = PointerExpr RhsExpr = PointerExpr | CREATE Assignment = LhsExpr × RhsExpr TransStmt = Transition × PointerExpr Statement = Assignment | TransStmt Witness = PointerExpr | AbstractLoc Figure 3: A simple language of pointer assignments and typestate transitions. C code pattern *(lval ) (lval)->f (lval)[i] lval = NULL
Transition deref deref deref create
Figure 4: Some source code patterns for the NULL dereference property. The patterns correspond to the following cases, respectively: dereferencing via the C ‘*’ operator, dereferencing via any structure field, dereferencing via access to an array index, and an initial assignment of NULL. may return NULL. For creation patterns, we insert both a TransStmt and an Assignment of CREATE.
4.3 Representation of Program States PSE operates on programs from the language in Figure 3. It computes an abstract state at every program point along a path. The abstract state consists of two components: • Witness. A single memory location that currently holds the object that eventually transitions to the error typestate at the failure location. A witness is either a pointer expression or an abstract location (Figure 3). A pointer expression is a precise representation because at any execution point it refers to exactly one memory location. An abstract location is an identifier taken from a finite partition of all memory locations obtained from a flowinsensitive alias analysis (see Section 4.4). This representation is less precise, since a single abstract location may represents a set of memory locations. We use abstract locations to ensure termination of the analysis (e.g. on programs with recursive data structures). • Typestate. A state b ∈ SB from the reversed automaton. Its elements are the typestates from the forward automaton that the witness could hold at the current program point.
4.4 Employing an aliasing oracle Our analysis includes a pre-processing stage, in which a scalable flow-insensitive memory alias analysis [12] is applied to the program. The alias analysis serves two purposes: 1. It provides an extremely efficient may-aliasing oracle, which is used to answer memory alias queries when
updating state tuples. More precise but potentially less efficient alias analyses could be used instead. 2. It provides a partition of the heap into a finite number of abstract memory locations.
4.5 A backwards dataflow solution We phrase our analysis as a backwards dataflow problem. The problem is defined on the supergraph [21] of a program, which includes a standard CFG for every procedure, and edges representing inter-procedural control flow. We assume that all indirect calls have been replaced with direct calls, that procedure calls have been simplified to parameterless calls, and that assignments from function return values have been replaced by assignments from specialized variables that store the function’s return value. We use the following sets and map to encode the CFG in this article. V A st : V → Statement
CFG nodes CFG edges Statement-at-the-CFG-node map
The analysis is very similar to the property simulation algorithm of ESP [11, 15], except that the direction of information flow is reversed, and we do not have a simulation state component. The unit of dataflow facts [21] of our analysis is a state tuple hw, bi ∈ S = Witness × SB , consisting of a witness l-value w and a typestate b in the reversed automaton. The backwards transfer functions for the two components are updateWitness : Statement × Witness → 2Witness and updateTypestate : Statement × Witness × SB → 2SB , respectively explained in Sections 4.6 and 4.7. The function update : Statement × S → 2S then defines the overall backwards effect of a statement on a state tuple: update(st , hw, bi) = { hw0 , b0 i | w0 ∈ updateWitness (st, w) ∧ b0 ∈ updateTypestate (st, w, b) } The initial state tuple for the backwards analysis is given by init = hlerror , {error}i, where the l-value lerror is specified in the input of the analysis. We can now phrase our analysis problem as an ESP-style interprocedural dataflow problem. Since we do not use a simulation component, the analysis is indeed an instance of the IFDS problems [21]. Without going to the detail of the meet-over-all-valid-path requirement of the IFDS solutions, here we simply present the intraprocedural problem: We look for the least solution to the following system of recursive equations, one equation for every v ∈ V : S S Sv = (v,u)∈A s∈S update(st(v), s) u
such that update(st (ve ), init) ⊆ Sve , where ve denotes the error point. The solution is obtained by applying the worklist algorithm of ESP [11, 15], which, due to the absence of a simulation component, is simply the Tabulation Algorithm for solving IFDS problems. Our analysis uses the supergraph of the program to propagate state tuples backwards (by following the reversed direction of control edges) from the error point, and simultaneously keeps error trace links that connect these state tuples. In each step, we apply update on a
[1] [2] [3] [4] [5] [6]
u->f = CREATE; p = &z; *p = u; y = z; x = y->f; *x = ...;
trace 1 — hu->f, ?i hu->f, ?i hz->f, ?i hy->f, ?i hx, ?i
trace 2 hz->f, ?i hz->f, ?i hz->f, ?i hz->f, ?i hy->f, ?i hx, ?i
updateWitness (st = (lhs, rhs), w) 8 {checkAppend (rhs, fs)} > > > > < ∅ > > > > : {w} ∪ mayUpdate (st, w)
= w = lhs →∗ fs ∧ rhs 6= CREATE w = lhs ∧ rhs = CREATE otherwise
mayUpdate(st = (lhs, rhs), w) =
Figure 5: An example of a backwards value flow computation on a small program. state tuple su along a CFG edge (v, u) to obtain an overapproximation of the program states before the statement. The resulting state tuples Sv are stored in the source vertex and an error trace predecessor link is created from each sv ∈ Sv of the state tuples at the source to the state tuple su at the target. Backwards propagation continues for each trace, until one of the following cases is encountered: (a) the analysis reaches a top-level function (a function with no incoming calls); (b) the analysis reaches a creation point for the tracked value, which implies that we have traced the value from the point of the error back to its creation (see Section 4.7 for details); or (c) the trace is found to be infeasible. In the first two cases, a trace is reconstructed from the error trace links and shown to the user. In the final case, the tracing is aborted. The technique employed by our backwards dataflow analysis is fully context-sensitive. Conceptually, every function is re-analyzed separately for every different state tuple with which it is reached. Similarly, every program point is reprocessed separately for every state tuple with which it is reached.
{ checkAppend (rhs, fs) | w = pe →∗ fs ∧ MayAlias(pe, lhs) ∧ rhs 6= CREATE} checkAppend (pe, fs) = pe →∗ fs length(pe →∗ fs) < max ∗ AbstrLoc(pe → fs) otherwise Figure 6: Definition of updateWitness .
In this subsection we describe a new dataflow analysis that computes, at every program point, a witness for the l-value that holds the object of interest at the failure point.
Our algorithm can most easily be understood as simply performing substitutions going backwards (just as when computing weakest preconditions [14]), with appropriate handling of fields and other C language constructs. We start with a witness x at program point 6 of Figure 5. At program point 5, we see that the value in x was copied from y->f, and we substitute for our witness accordingly. Program point 4 updates a prefix of our witness, y, so we substitute z for y in the witness, yielding z->f. At program point 3, we do not have a syntactic match with the witness, but a query to our aliasing oracle tells us that *p and z may be aliased. To handle this case soundly, we split our trace into two traces, one in which *p and z are aliased (leading to a witness u->f), and one in which they are not. Finally, at program point 1, we see the value of interest being created and assigned to u->f, so no witness exists in trace 1. 2
Example 4. We first use the example program shown in Figure 5 to demonstrate how the witness is computed. The example uses the address-of operator (&), which is not included in the language of Figure 3 for simplicity, but our implementation handles the operator correctly. The example ignores typestates. The idea of the analysis is as follows: at the error point, we know which witness l-value l holds the value of interest. As we proceed backwards, we re-trace the chain of assignments that caused the value of interest to be transferred to this lvalue. At every point, there is a single witness l-value l’ that currently holds the value of interest, such that subsequent statements will copy the value of interest from l’ to l. We refer to this observation as the single witness property. To better understand the single witness property, consider program point 5 in Figure 5. Notice that just before 5, the value held by x at the point of the error is also held by the l-values y->f, u->f, and z->f. However, only y->f is a witness for the value, since it is the value held by y->f before program point 5 that is copied to x. The single witness property of the backwards analysis is the central reason why our algorithm has polynomial complexity. At any program point, the number of states is bounded by the number of different witnesses, which is linear in the size of the program.
The operation updateWitness accepts a statement st and a witness l-value, w, and conservatively computes a superset of the l-values that are copied by st to w. The trace splitting seen in Example 4 (at program point 3 in Figure 5) is performed by the update function from Section 4.5, as separate error trace links are created for each of the possible l-values. Figure 6 defines the updateWitness function for assignments; the function is identity for other statements. We use e →∗ e0 to represent the pointer expression obtained by appending an access path e0 of 0 or more dereferences to a pointer expression e. In updateWitness , if the left-hand side of the assignment lhs is some prefix of the witness access path w (with fs naming the remaining suffix of w), we check if the righthand side rhs is the CREATE scalar. If not, our result is a substitution of rhs for lhs in the witness, yielding rhs →∗ fs. We use checkAppend to ensure that the resulting access path does not exceed some maximum length; if it does, we switch to the AbstractLoc representation. If rhs is CREATE while lhs matches the witness, we return ∅, since the value does not exist before this statement and hence no witness exists. If we do not have a syntactic match between w and lhs, we use mayU pdate to find other possible witness l-values due to aliasing. For each split of lhs into a prefix pointer
4.6 Updating witness information
updateTypestate (st = (trans , lval), w, b) = 8 {δB (b, trans )} w = lval > > < {b, δB (b, trans )} w 6= lval ∧ MayValAlias(w, lval) > > : {b} otherwise Figure 7: Definition of updateTypestate . expression pe and suffix fs, if pe and w can be aliased and rhs is not CREATE, we add checkAppend (rhs, fs) to the set of possible witness l-values. We also keep w in the set, since it is possible that w and pe are not aliased at the point. Our implementation handles the full C language. The address-of operator (&) sometimes requires removing a level of indirection. For example, if our witness is *y, and we encounter the statement y = &x, the new witness will just be x. We elide a full discussion of this operator for space and simplicity. For C constructs that are difficult to statically reason about, such as pointer arithmetic, we fall back on an AbstractLoc representation, using information provided by the aliasing oracle on which AbstractLoc s are modified and used by each statement.
4.7 Updating typestate information The transfer function updateTypestate takes a statement st , a witness l-value w, and a typestate b ∈ SB and returns the set of possible typestates for w before st . Figure 7 defines updateTypestate for transition statements st, with transition trans and l-value lval; the function is identity for other statements. The three cases are strong transitions, where the w syntactically matches lval, weak transitions, where w does not match lval but they are possibly value-aliased (i.e., they can hold the same value) according to the aliasing oracle, and no transition, when w and lval cannot be value-aliased. Example 5. For the NULL dereference property, the simplicity of the automaton—that it has only state that is not uninit or error)—renders it unnecessary to keep track of the typestate: it could only be {unsafe}. But typestate tracking still helps by refuting infeasible path, as illustrated in Example 3, when the witness matches the l-value being dereferenced. 2 The dataflow engine handles certain typestates resulted from an application of updateTypestate specially. The typestate {} can always be eliminated from the result set since it has no outgoing transitions. If after this elimination the result set is empty, the trace is infeasible and the analysis need not explore further. If an reversed typestate that contains an initial typestate i ∈ I of the forward automaton (e.g., {uninit}) is present in the result, then the engine constructs and reports an error trace, just as a forward analysis engine would do if an object reaches the error state.
4.8 Improvements We have three other techniques for improving the scalability and usability of our postmortem analysis. Exploiting stack trace information: If, in addition to the actual error point, we are given the stack trace at the time of the error, we can use it to improve our analysis as follows. The functions included in the stack trace indicate all of the functions that were called and did not return
(incomplete calls due to the crash). We maintain a pointer to the current stack trace function in the dataflow engine. The dataflow analysis uses this pointer when following call arcs from callees to callers on incomplete calls. In particular, only call arcs to a caller that matches the next position on the call stack are followed, and the stack-trace pointer is updated to point to the next position on the stack-trace. This technique reduces the number of error traces that the dataflow solver creates and the amount of code it analyzes, thus improving both efficiency and precision. Handling simple NULL checks: We detect simple cases of NULL checks of expressions at conditional branches, eg. if (p != NULL) and if (p). If we find such a check for the witness, and if we have reached the condition through its true branch, we know the witness is non-NULL and the path is infeasible. This simple technique manages to eliminate a significant number of our false-positive traces. Ignoring imprecise alias information: While quite accurate for scalars, our flow-insensitive alias analysis becomes more inaccurate as we track expressions with multiple levels of dereferences, since the analysis is field-insensitive and it unifies most locations at that level [10]. Even when the alias analysis is accurate, reported traces that involved may-aliasing are difficult to understand in our experience, since the “reason” for the aliasing is not apparent from the control flow displayed in the trace. We could of course improve our alias analysis in several ways, but we have found that making our analysis unsound with respect to aliasing still provides good results while sometimes greatly improving scalability. One method for working around the field-insensitivity of the alias analysis is to assume that the program is typesafe; this allows us to at least distinguish fields of integer type from fields of pointer types. Such an assumption is unsound for C/C++ programs, since a program could cast a pointer to an integer and then back, but such cases are rare in the code bases we have analyzed. A second technique is to ignore may-aliasing completely and only report traces in which we precisely track the witness back from the error point to a creation point. Another source of inaccuracy stems from our use of a finite heap partition from the alias analysis for soundly bounding the length of the expressions we track. We almost always reach this bound because of recursive data structures whose size we cannot statically bound. As a compromise in this situation, we have a flag which disables using the heap partition and instead simply does not track expressions involving recursive data structures beyond the maximum length we set for them. Given a length limit k, this unsoundness would only eliminate all traces for a given error point if they all required more than k dereferences in some witness expression. This does not seem to occur in typical programs for reasonable k (we set k = 3 in our experiments). Recursive data structures are usually initialized in loops, with a statement like x = x->next used to move through the data structure; in such cases, k = 1 would suffice for soundness.
4.9 Termination and complexity Since the backwards analysis algorithm is essentially the Tabulation Algorithm for solving IFDS problems, the complexity is polynomial in the size of the following domains. LVALs: the set of memory locations for the tracked object component. This set consists of all pointer expressions
Bench compress li go m88ksim ijpeg perl vortex gcc
Size (kloc) 2 10 20 20 30 30 70 140
Derefs 22 778 104 1225 5416 7894 8806 21522
Figure 8: Information on the SPEC95 benchmarks. The Derefs column gives the number of static pointer dereferences in the program, as a rough measure of how extensively it makes use of pointers. of some bounded size, which is roughly linear in the number of variables (since the number of fields associated with each variable is close to a constant), and the set of memory location identifiers, which is dependent on the aliasing analysis (we use GOLF [12], which in the worst-case can result in a linear number of partition of the heap, but usually gives smaller number of partitions). TStates : the set of typestates of the reversed automaton. This set could be in the worst-case exponential in the number of states in the original automaton, due to the determinization step. Several useful automatons, however, seem to be deterministic upon reversal and have a set of states linear in the size of the input automaton. The size of dataflow facts is |LVALs| × |TStates |. Instantiating the complexity results of the Tabulation Algorithm [21], we have that the worst-case space complexity is O(|V | × |LVALs|2 × |TStates |2 ), and the worst-case time complexity is O(|V | × |LVALs|3 × |TStates|3 ) analysis steps. Here, each analysis step uses the transfer function and therefore possibly queries the alias oracle, which is always polynomial in time. In fact, precomputing the results of all possible queries using the GOLF alias engine would make the total cost of alias queries be worst-case O(|LVALs |3 ) in time and worst-case O(|LVALs |2 ) in space.
5.
EXPERIMENTAL RESULTS
We have implemented PSE using a pre-existing generic infrastructure for path-sensitive, context-sensitive dataflow analysis that was built for ESP. In this section, we summarize the results of two experiments using this implementation. The first experiment tests the hypothesis that PSE is scalable and precise on a set of real, complex benchmarks. The second experiment tests the hypothesis that PSE can be used to diagnose real program failures. In both cases, we restricted our experiments to diagnosing NULL dereference errors. These errors occur commonly, are well understood, and provide a challenging test for our technique because pointer dereferences are common in most C programs.
5.1 Scalability and precision: SPEC In order to test the precision and scalability of PSE, we applied it to postmortem analysis of pointer dereferences in the integer benchmarks from Spec95. In particular, we
Bench compress li go m88ksim ijpeg perl vortex gcc
Normal 0.001 0.524 0.002 0.003 0.017 2.990 0.531 0.400
No Ts 0.001 0.773 0.007 0.012 0.039 5.447 1.270 0.927
No May 0.001 0.288 0.002 0.002 0.002 1.396 0.283 0.319
No Ab 0.001 0.571 0.002 0.003 0.017 3.135 0.521 0.388
No May/Ab 0.001 0.111 0.002 0.002 0.002 2.836 0.283 0.330
Figure 9: Average tracking times for our different configurations on the SPEC benchmarks. Bench compress li go m88ksim ijpeg perl vortex gcc
Normal 0 25 1 2 3 44 17 18
No Ts 0 39 1 5 14 76 47 51
No May 0 13 1 2 0 35 12 12
No Ab 0 25 1 2 3 44 17 17
No May/Ab 0 5 1 2 0 29 12 2
Figure 10: Number of dereferences for which a trace was found on the SPEC benchmarks. selected 100 dereference points at random from each of the benchmarks (except for compress, which only has 22). These programs are expected to be largely free of NULL dereference errors. Therefore, we can use the number of traces generated by PSE as an indicator of its precision. Because there are no stack dumps available in this experiment, we are forced to run PSE without stack trace information. Therefore, this experiment serves as a strong test of the scalability of the approach. Figure 8 gives information on the size and pointer use of each benchmark. For each benchmark, we ran our analysis in several configurations. The “Normal” configuration is our standard analysis. The “No Ts” configuration disables the use of typestate to prune false paths. The improvement of the Normal column over the No Ts column measures the benefit of false path pruning based on typestate. Both of these configurations are sound. We also tested three unsound configurations in which we disabled checking for may aliasing (“No May”), disabled switching to an abstract location on long recursive paths (“No Ab”), and disabled both (“No May/Ab”). Scalability. Figure 9 gives the average query time in seconds (tracking time per dereference) for each SPEC benchmark and configuration. The average query time is almost always under a second. This result supports our hypothesis that PSE is scalable in practice. Although most queries are very fast, some benchmarks contain a few outliers that can consume large amounts of time. In our experience, PSE is not able to produce useful traces in these cases. Therefore, we limited each query to at most 50000 analysis steps (approximately 15 seconds of analysis time). It is important to note that almost all queries finished within this bound. The experiments were performed on a Pentium 4 3.2Ghz machine with 2GB RAM. The apparently surprising increase in average query time for perl and gcc in the “No May/Ab” configuration over the “No May” configuration can be explained by our limit
on the analysis steps for each query. In the “No May/Ab” configuration, more steps of the analysis propagate syntactic expressions, which is a more expensive computation that propagating abstract locations. Precision. Figure 10 gives the total number of dereferences for which a trace was found for each SPEC benchmark and configuration. The results show that for most benchmarks, PSE is able to validate most of the pointer dereferences on which it is applied. The exception is the perl benchmark, which makes extensive use of recursive data structures and heap-based pointers, exposing weaknesses in our flow-insensitive aliasing oracle; a more accurate aliasing oracle may address this issue. Notice that the structure of perl causes our analysis to suffer in scalability as well. In Figure 10, the traces from the “Normal” configuration that are not reported in the “No May/Ab” configuration are likely to be false positives, because of the inaccuracy of our aliasing oracle. Note that backwards typestate checking still significantly reduces the number of false traces, seen by comparing the “Normal” and “No Ts” configurations. We manually inspected several of the errors reported in the “No May/Ab” configuration. For perl, most of the traces led back to a safemalloc function that handles exhausted memory by either returning NULL or exiting, depending on a global flag. Such traces could easily be suppressed by appropriately modeling safemalloc (we already model other allocation functions as possibly returning NULL). In several of the benchmarks, a global pctype variable is dereferenced, with no actual initialization in the code. This variable is initialized by the runtime prior to the execution of main(). Finally, several traces are false positives resulting from cases where we still must use an abstract location representation because the witness expression does not represent a single memory location. A common example is an array dereference, e.g. a[i], where the expression represents several locations depending on the value of i.
comparison shows the advantage of our demand-driven approach. We made use of the stack trace information available for each error to prune our search space. Without the stack trace information, analysis performance was not significantly impacted, but in two cases, the analysis produced extra traces irrelevant to the error (although not necessarily false positives). We believe that for failures that occur within commonly used utility functions, stack trace information will be crucial for good performance. In summary, the experiments described above suggest that in most cases, PSE is both scalable and precise enough to diagnose real failures in real programs. In particular, the situations where PSE lacks precision appear to match those where PSE consumes unusually large resources. Therefore, by using timers appropriately, we can produce a practical diagnosis tool that usually provides useful traces quickly, but sometimes fails to provide any result.
6. CONCLUSIONS In this paper, we have described PSE, a polynomial time algorithm for producing execution traces that show how a program is driven to a given failure. PSE requires minimal information about the failure, making it suitable for automated diagnosis of bug reports produced by deployed software. We have implemented PSE and evaluated its precision and scalability on a set of benchmarks including all of the integer benchmarks from Spec95, and the Windows operating system. Our experience shows that PSE is both scalable and precise enough to be of practical use. In particular, the situations where PSE is imprecise match those where it is unusually expensive, meaning that we can automatically limit its output to those situations where it is effective for diagnosing failures.
5.2 Diagnosing real failures: Windows
Acknowledgements
In order to test the ability of our technique to diagnose real program failures, we randomly chose 5 NULL dereference errors found by the whole program static analysis tool PREfix [7] on a version of Windows that is currently under development. We first manually verified that the traces were not false positives, meaning that we could expect to see NULL dereference reports for these program locations if this version were given to users3 . We then applied our analysis to each of these errors. The “No May” configuration of PSE produced exactly the trace reported by PREfix in each case, with an analysis time of well under 1 second and no false positives. The sound “Normal” configuration had poor performance in one case because of inaccurate alias information, but otherwise performed nearly as well as the “No May” configuration. This result suggests that PSE may be useful as a crash dump diagnosis tool in a real setting, which is the ultimate goal of our work. We also experimented with using a forwards analysis to exhaustively verify the NULL dereference property on several Windows DLLs. We found that the analysis times ranged from six minutes to almost two hours, much longer than the time for a single query using our analysis. This
Brian Hackett, Ted Kremenek, Mooly Sagiv, and Eran Yahav provided valuable feedback on previous drafts. The anonymous referees helped us position and validate our results appropriately. Amit Rao, Hari Hampapuram, and Jason Yang helped implement parts of the underlying ESP infrastructure. The PREfast and PREfix teams at Microsoft Research provided the compiler front-end and test automation harness for PSE.
3
These errors have since been fixed.
7. REFERENCES [1] Hiralal Agrawal and Joseph R. Horgan. Dynamic Program Slicing. In Proceedings of the ACM SIGPLAN Conference on Programming Language Design and Implementation, June 1990. [2] Hiraral Agrawal, Joseph R. Horgan, Saul London, and W. Eric Wong. Fault Localization using Execution Slices and Dataflow Tests. In Proceedings of the IEEE International Symposium on Software Reliability Engineering, October 1995. [3] Alfred V. Aho, Ravi Sethi, and Jeffrey D. Ullman. Compilers: Principles, Techniques, and Tools. Addison-Wesley, 1986.
[4] Thomas Ball, Mayur Naik, and Sriram Rajamani. From Symptom to Cause: Localizing Errors in Counterexample Traces. In Conference Record of the Thirtieth ACM Symposium on Principles of Programming Languages, 2003. [5] Thomas Ball and Sriram K. Rajamani. Automatically Validating Temporal Safety Properties of Interfaces. In Proceedings of SPIN ’01, 8th Annual SPIN Workshop on Model Checking of Software, May 2001. [6] Peter Bunus and Peter Fritzson. Semi-Automatic Fault Localization and Behavior Verification for Physical System Simulation Models. In Proceedings of the IEEE International Conference on Automated Software Engineering, October 2003. [7] William R. Bush, Jonathan D. Pincus, and David J. Sielaff. A Static Analyzer for Finding Dynamic Programming Errors. Software - Practice and Experience, 30(7):775–802, 2000. [8] J. Corbett, M. Dwyer, J. Hatcliff, C. Pasareanu, Robby, S. Laubach, and H. Zheng. Bandera: Extracting Finite-state Models from Java Source Code. In Proceedings of the 22nd International Conference on Software Engineering, 2000. [9] Microsoft Corporation. Microsoft Online Crash Analysis. http://oca.microsoft.com/en/dcp20.asp. [10] Manuvir Das. Unification-based pointer analysis with directional assignments. In ACM SIGPLAN 2000 Conference on Programming Language Design and Implementation, 2000. [11] Manuvir Das, Sorin Lerner, and Mark Seigle. ESP: Path-sensitive Program Verification in Polynomial Time. In ACM SIGPLAN 2002 Conference on Programming Language Design and Implementation, 2002. [12] Manuvir Das, Ben Liblit, Manuel F¨ ahndrich, and Jakob Rehof. Estimating the Impact of Scalable Pointer Analysis on Optimization. In 8th International Symposium on Static Analysis, 2001. [13] Richard A. DeMillo, Hsin Pan, and Eugene H. Spafford. Critical Slicing for Software Fault Localization. In Proceedings of the International Symposium on Software Testing and Analysis, January 1996. [14] E. W. Dijkstra. A Discipline of programming. Prentice-Hall, 1976.
[15] Nurit Dor, Stephen Adams, Manuvir Das, and Zhe Yang. Software Validation via Scalable Path-Sensitive Value Flow Analysis. In International Symposium on Software Testing and Analysis, 2004. Also available as Microsoft Research Technical Report MSR-TR-2003-58. [16] Margaret Francel and Spencer Rugaber. Fault Localization using Execution Traces. In Proceedings of the ACM Annual Southeast Regional Conference, 1992. [17] Seth Hallem, Benjamin Chelf, Yichen Xie, and Dawson Engler. A system and language for building system-specific, static analyses. In Proceedings of the ACM SIGPLAN 2002 Conference on Programming Language Design and Implementation, 2002. [18] Ben Liblit and Alex Aiken. Building a better backtrace: Techniques for postmortem program analysis. Technical Report UCB/CSD 02/1203, UC Berkeley Computer Science Division, October 2002. [19] Hsin Pan and Eugene H. Spafford. Toward Automatic Localization of Software Faults. In Proceedings of the Pacific Northwest Software Quality Conference, October 1992. [20] Brock Pytlik, Manos Renieris, Shriram Krishnamurthi, and Steven P. Reiss. Automated Fault Localization Using Potential Invariants. In Proceedings of the International Workshop on Automated and Algorithmic Debugging, September 2003. [21] Thomas Reps, Susan Horwitz, and Mooly Sagiv. Precise interprocedural dataflow analysis via graph reachability. In Proc. ACM Symp. on Principles of Programming Languages, pages 49–61. ACM Press, January 1995. [22] R. Strom and S. Yemini. Typestate: A Programming Language Concept for Enhancing Software Reliability. IEEE Transactions on Software Engineering, 12(1):157–171, 1986. [23] Robert E. Strom and Daniel M. Yellin. Extending Typestate Checking Using Conditional Liveness Analysis. IEEE Transactions on Software Engineering, May 1993. [24] Frank Tip. A survey of program slicing techniques. Journal of programming languages, 3:121–189, 1995. [25] Mark Weiser. Program slicing. In Proceedings of the 5th international conference on Software engineering, pages 439–449. IEEE Press, March 1981.