Psychological Assessment What Item Response Theory Can Tell Us About the Complex Span Tasks Christopher Draheim, Tyler L. Harrison, Susan E. Embretson, and Randall W. Engle Online First Publication, March 9, 2017. http://dx.doi.org/10.1037/pas0000444
CITATION Draheim, C., Harrison, T. L., Embretson, S. E., & Engle, R. W. (2017, March 9). What Item Response Theory Can Tell Us About the Complex Span Tasks. Psychological Assessment. Advance online publication. http://dx.doi.org/10.1037/pas0000444
Psychological Assessment 2017, Vol. 1, No. 2, 000
© 2017 American Psychological Association 1040-3590/17/$12.00 http://dx.doi.org/10.1037/pas0000444
What Item Response Theory Can Tell Us About the Complex Span Tasks Christopher Draheim, Tyler L. Harrison, Susan E. Embretson, and Randall W. Engle
This document is copyrighted by the American Psychological Association or one of its allied publishers. This article is intended solely for the personal use of the individual user and is not to be disseminated broadly.
Georgia Institute of Technology Working memory capacity is an important construct in psychology because of its relationship with many higher-order cognitive abilities and psychopathologies. Working memory capacity is often measured using a type of paradigm known as complex span. Some recent work has focused on shortening the administration time of the complex span tasks, resulting in different versions of these tasks being used (Foster et al., 2015; Oswald, McAbee, Redick, & Hambrick, 2015). Variations in the complex span tasks, such as the number of set sizes, can lead to varying power to discriminate individuals at different ability levels. Thus, research findings may be inconsistent across populations due to differing appropriateness for the ability levels. The present study uses a combination of item response theory and correlational analyses to better understand the psychometric properties of the operation span, symmetry span, and rotation span. The findings show that the typical administration of these tasks, particularly the operation span, is not suitable for above average ability samples (Study 1; n ⫽ 573). When larger set sizes are added to the tasks (Study 2; n ⫽ 351), predictive validity and discriminability is improved for all complex span tasks, however the operation span is still inferior to the spatial tasks. The authors make several conclusions about which tasks and set sizes should be used depending on the intended population, and further suggest avoiding the standard-length operation span for average or higher ability populations.
Public Significance Statement The authors take a novel approach at further understanding a set of popular tasks used to measure working memory capacity. By using an advanced modeling technique known as item response theory, we demonstrate that the most widely used of these tasks, the operation span, is not good at measuring individuals of high cognitive ability. The authors increase the number of to-beremembered items in the tasks and demonstrate that they are much better at measuring higher-ability individuals.
Keywords: working memory capacity, complex span, item response theory, measurement Supplemental materials: http://dx.doi.org/10.1037/pas0000444.supp
reading span, correlated quite strongly with reading comprehension. This was an important finding because measures of STM typically have low or even nonsignificant correlations to higherorder cognitive abilities (Dempster, 1981). Tasks similar to the reading span (known as complex span tasks) have since emerged, and performance on these tasks correlate strongly with a wide array of cognitive abilities and real-world behavior, including following directions (Engle, Carullo, & Collins, 1991), multitasking (Hambrick, Oswald, Darowski, Rench, & Brou, 2010), language learning (e.g., Baddeley, Gathercole, & Papagno, 1998), language comprehension (e.g., Daneman & Merikle, 1996), and attentional control (e.g., Kane, Bleckley, Conway, & Engle, 2001). Most notably for cognitive psychology, complex span performance correlates strongly with measures of fluid intelligence (Gf), indicating a strong relationship between WMC and the ability to reason in novel situations (Ackerman, Beier, & Boyle, 2005; Engle, Tuholski, Laughlin, & Conway, 1999; Kane, Hambrick, & Conway, 2005; Oberauer, Schulze, Wilhelm, & Süß, 2005). Within the realm of clinical psychology, WM deficits have been linked to multiple psychopathologies such as schizophrenia (e.g., Silver, Feldman, Bilker, & Gur, 2003), attention-deficit/hyperactivity disorder (ADHD; e.g., Martinussen, Hayden, Hogg-Johnson,
Working memory (WM) has become an increasingly important concept in psychology since the early 1970s, when researchers began to focus on the active and controlled mechanisms of primary memory more than the passive characteristics of short-term memory (STM; e.g., Baddeley & Hitch, 1974). Work investigating individual differences in WM began shortly thereafter, and with this new line of research came the first measure of WM capacity (WMC): the reading span (Daneman & Carpenter, 1980). Daneman and Carpenter demonstrated that WMC, as measured by the
Christopher Draheim, Tyler L. Harrison, Susan E. Embretson, and Randall W. Engle, School of Psychology, Georgia Institute of Technology. This work was supported by grants from the Office of Naval Research (N00014-12-1– 0406 and N00014-12-1–1011) to Randall Engle. We thank Zach Shipstead, Page Sloan, and Neesia Smith for their assistance in data collection. We thank Tim Moran for his assistance with the manuscript. Correspondence regarding this article should be addressed to Christopher Draheim, School of Psychology, Georgia Institute of Technology, Atlanta, GA 30332. E-mail:
[email protected] 1
This document is copyrighted by the American Psychological Association or one of its allied publishers. This article is intended solely for the personal use of the individual user and is not to be disseminated broadly.
2
DRAHEIM, HARRISON, EMBRETSON, AND ENGLE
& Tannock, 2005), and clinical depression (e.g., Christopher & MacDonald, 2005). To emphasize the importance of WM in clinical research; a PsycINFO search using the keywords “working memory” and “schizophrenia” from 1995 to 2015 produced 2,115 articles published in academic journals. Analogous searches for “working memory” and “ADHD” resulted in 698 articles, and “working memory” and “depression” resulted in 813. In regards to measuring WMC, the complex span tasks have seen increasing use because of the demonstrably high reliability of partial span scores (e.g., Redick et al., 2012), their high predictive validity in terms of predicting other cognitively complex abilities, and their accessibility our on our lab website (http://englelab.gatech .edu/). This popularity has both benefits and drawbacks. On the positive side, researchers can have confidence in their results without being concerned about the reliability and validity of their measures. Furthermore, having uniformity in task administration permits easier comparison across studies from different labs. On the negative side, it may be the case that the tasks are not suitable for all populations and it is possible that researchers are not using the correct task given characteristics of their sample or study in general. In particular, the operation span is a task that we have often found problematic in our research in that it typically has a weaker relationship with other cognitive abilities than the other complex span tasks and has smaller loadings on a latent WMC factor. It is our opinion that over use of the operation span and underutilization of some of the other complex span tasks have resulted in some researchers finding lower effect sizes than would be expected, or even failing to find significant results outright. An additional drawback of the tasks is the amount of time required to administer them. To reliably measure WMC, a battery of three complex span tasks requires approximately an hour, with the operation span itself taking around 30 min. To this end, recent work has focused on making these tasks more efficient by reducing the number of trials without sacrificing their psychometric properties (e.g., Foster et al., 2015; Oswald et al., 2015). The efforts to shorten the complex span tasks have made them more accessible to researchers who, due to time or other resource constraints, would not otherwise be able to conduct WM work. However, the availability of the shortened tasks also results in different versions of the task being used. As such, no longer is there one single version of any specific complex span task, as researchers can choose to administer the standard-length version, the Foster et al. (2015) version with fewer blocks, or the Oswald et al. (2015) version with fewer blocks, fewer set sizes, and less practice. It is also common for researchers to modify the existing tasks to fit their study needs. Consequently, results and research findings may be inconsistent across studies, making cross-study comparisons more difficult. An important consideration is how the difficulty and other psychometric properties of the different complex span tasks match characteristics of both the tested population and the individual subject. With multiple versions of the tasks, some will inevitably be better administered to particular populations than others, and some will outperform others in different regards. This raises questions such as to what extent do the different set sizes among the tasks contribute to the psychometric properties of the task as a whole. Are some set sizes more useful in prediction than others? In what ways do the different administrations of the complex span tasks differ, and in what ways do the tasks themselves differ? Another consideration is how the complex span tasks discriminate
in terms of high and low ability subjects. For instance, some measures of cognitive ability are more suited to lower-ability subjects due to having a lower overall difficulty and thus providing the most information at the low end of the ability spectrum. But the complex spans are commonly administered to individuals at all ability ranges, as they have been employed in children, clinical, and aging studies along with given to both high-achieving university students and low socioeconomic status community members alike. The aforementioned questions are difficult to answer with the limited information provided by classical test theory, and thus in the present studies we will also use item response theory (IRT) to further explore the nature of the complex span tasks. Overall, our goals are to obtain a better idea of which complex span tasks are better for different situations, which set sizes are overall more predictive and discriminating both within and across tasks, and to use a different approach than Foster et al. (2015); Oswald et al. (2015) in investigating how these tasks can be further made more efficient without sacrificing reliability and validity. Our work can also potentially illuminate other shortcomings of the complex span tasks that have not been reported to date. Ultimately, it is our hope that this work will lead to more in-depth analyses on the complex span tasks and that they are eventually made adaptive such that different tasks, stimuli, and set sizes are administered based on the individual subject’s ability level.
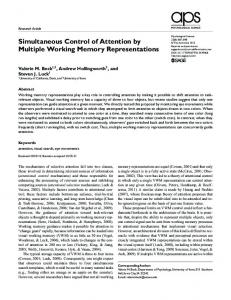
Introduction to the Complex Span Tasks The complex span tasks follow a similar design, with the principle difference being the nature of the stimuli. They are in essence dual tasks with both a storage and a processing component. The processing component is interweaved between the to-beremembered stimuli to prevent rehearsal, thus serving as a distractor. The subject’s job is to maintain an active representation of the to-be-remembered stimuli in the face of this distraction, and as proactive interference builds up from trial-to-trial. To ensure that subjects are fully attending to the processing portion of the task and not rehearsing the to-be-remembered stimuli instead, the processing trials have a subject-adaptive response deadline equal to 2.5 SDs above mean reaction time (RT) on the practice trials. In addition, data from subjects who do not perform the processing trials with at least 85% accuracy are typically thrown out. The presence of the processing (i.e., distractor) trials is the main distinguishing characteristic of complex span tasks, and differentiates them from traditional simple span tasks and other measures of STM. Figure 1 shows three of the common complex span tasks. In the operation span, subjects make a judgment as to if a simple arithmetic string is correct or not, and the to-be-remembered stimulus is a letter. In the symmetry span, subjects make a judgment as to if a figure is symmetrical about the vertical axis, and the to-beremembered stimulus is a particular cell within a 4 ⫻ 4 grid. In the rotation span, subjects make a judgment as to if the letter displayed can be rotated to be a forward-facing letter, and the to-beremembered stimulus is either a large or small arrow pointing in one of eight possible directions. Because the rotation and symmetry span are spatial and have more complex to-beremembered stimuli than the operation span, they are more difficult and as such the standard administration only includes
This document is copyrighted by the American Psychological Association or one of its allied publishers. This article is intended solely for the personal use of the individual user and is not to be disseminated broadly.
WHAT IRT CAN TELL US ABOUT COMPLEX SPAN TASKS
3
Figure 1. Illustration of three common complex span tasks. Subjects are shown a processing or distractor task and given their mean RT on practice trials ⫹ 2.5 ⫻ their SD to respond. Then the to-be-remembered stimulus is displayed. This process repeats a number of times until a recall screen appears. In the standard-length tasks, each set size from 3 to 7 is administered three times in the operation span, and each set size from 2 to 5 is administered three times in the symmetry and rotation span. See the online article for the color version of this figure.
set sizes 2, 3, 4, and 5 for these tasks for a possible partial span score of 42.
Overview of IRT IRT is a psychometric assessment and modeling technique with many advantages over classical test theory (for a critique of classical test theory, see Embretson, 1996). Whereas classical test theory focuses primarily on scores for an entire test, IRT allows for more sophisticated latent analysis of items independent from the test as a whole. In addition, IRT can estimate parameters on both the item and individual side independently, permitting a more nuanced investigation into person ability level, item difficulty, item discrimination, and so forth. The main advantage of IRT over classical test theory is that items are treated separately and independent from one another, and thus it is not assumed that each item in a test is equally difficult or contributes equally to the overall test score. For our purposes, we are most interested in the item difficulty () parameter for both individual items and the test as a whole.
When looking at binary or dichotomous data, the item difficulty estimate of an item equates to a particular subject ability level (; conceptually analogous to a Z-score) such that a subject of the same ability level has a 50% chance of getting an item correct and information is maximized at that point (for models without parameters for guessing). For example, if an item with a  of 1 is given to a subject with a of 1, the subject has a 50% chance to answer that item correctly and information for that subject is maximized. Note that information is inversely related to standard error, and thus it is desirable to match item difficulties with the ability level of subjects to minimize error and maximize discrimination. When looking at polytamous data (such as the data presented here), it is not appropriate to interpret equivalent item difficulty and ability level parameters in terms of the subject having a 50% chance to answer the item correctly, but it is still desirable to match item difficulty with ability level for the same reasons as with binary data. Item discrimination estimates (␣) will also be presented. This parameter relates to the slope of the item characteristic curve and gives information about how narrowly or broadly an item can
DRAHEIM, HARRISON, EMBRETSON, AND ENGLE
4
differentiate based on ability level. A high ␣ value for an item means the item has a steeper characteristic curve and narrowly differentiates subjects by ability level. Because we are interested in the general location of different set sizes and not the precision, we will not discuss item discrimination of the complex span tasks in much detail.
This document is copyrighted by the American Psychological Association or one of its allied publishers. This article is intended solely for the personal use of the individual user and is not to be disseminated broadly.
Study 1 Study 1 was a large-scale correlational study consisting of 50 cognitive tasks administered over four 3-hr long sessions and two research locations. In Study 1 we are interested in the properties of the complex span tasks under typical administration (i.e., three blocks of set sizes 2–7 for verbal tasks and set sizes 3–5 for spatial tasks).
Method Participants. Sessions were run at Georgia Tech and Indiana University-Purdue University. Proper ethical guidelines were followed and the experimental protocol received approval from the Institutional Review Board of both universities. Our screening process required all subjects to be native English speakers aged 18 –35 with normal or corrected-to-normal vision. A total of 585 subjects completed all four sessions, and the final sample consisted of 573 subjects (214 Georgia Tech students, 84 Indiana UniversityPurdue University students, 246 individuals from the greater Atlanta community of which 81 indicated they were attending or had attended college, and 29 without valid demographic information). The mean age for the sample was 22.4 years (SD ⫽ 4.5 years). Tasks: Complex span. Automated operation span. In the automated operation span (Unsworth, Heitz, Schrock, & Engle, 2005), subjects recall a series of serially presented items, the presentation of which is interrupted by a simple processing task. The to-be-remembered items are letters from the English alphabet. The processing task is a simple mathematical equation in which subjects must indicate if it is correct (e.g., “(2 ⫻ 2) ⫹ 1 ⫽ 5”) or not (e.g., “(3 ⫻ 4) – 3 ⫽ 8”) before the next letter of a sequence is presented (see Figure 1). Set sizes varied between 3 and 7 items. These sets were presented in a randomized order, with the constraint that a given set could not repeat until all sets had been presented. Each set size was used three times. The dependent variable is the partial span score, which is the total number of letters recalled in proper serial position. Automated symmetry span. In the automated symmetry span (Unsworth, Redick, Heitz, Broadway, & Engle, 2009), subjects recall a series of serially presented items, the presentation of which is interrupted by a simple processing task. The to-be-remembered items are particular cells within a 4 ⫻ 4 grid. The processing task requires subjects to judge whether or not a figure in an 8 ⫻ 8 grid is symmetrical (see Figure 1). Set sizes were two to five items. The sets were presented in a randomized order, with the constraint that a given set size could not repeat until all sets had been presented. Each set was used three times. The dependent variable is the partial span score, which is the total number of letters recalled in proper serial position. Automated rotation span. The automated rotation span (Harrison et al., 2013) consists of to-be-remembered items that are a sequence of long and short arrows, radiating from a central point.
The processing task required subjects to judge whether a rotated letter was forward facing or mirror-reversed (see Figure 1). Set sizes varied between two and five items. The sets were presented in a randomized order, with the constraint that a given set could not repeat until all other sets had been presented. Each set was used three times. The dependent variable is the partial span score, which is the total number of letters recalled in proper serial position. Analysis. All analyses were conducted using IRTPRO software using the generalized partial credit model (for more information on this model, see Muraki, 1992). This particular model was selected because the response data are polytomous and we also assume that item discrimination will not be the same across different set sizes. Individual set sizes (e.g., 3 for the operation span) were treated as independent items to examine the differences in item difficulty estimates for each set size in each task. For estimating the item parameters, ability level was specified as N(0,1) such that subject’s ability level followed a normal distribution with a mean of 0 and SD of 1. We constrained item discrimination and item threshold across blocks of the same task for each set size (e.g., set size 3 in block 1 and set size 3 block 2), as these are assumed to be equivalent items. Estimation was conducted using marginal maximum likelihood, with 30 quadrature points and the logit scale. Note that although we provide overall model fit statistics (e.g., ⫺2loglikelihood), these values are most useful for model comparison, and not particularly informative when looking at one model in isolation (see Kang, Cohen, & Sung, 2005). We also report fit estimates for individual items, which are more informative for our purposes. For each task, a total information curve will be shown. In classical test theory, the standard error of measurement is used as an indicator of the stability of the test score, with smaller standard errors indicating more dependable true score estimates. In IRT, the same is true, but standard error of estimate is allowed to vary for different ability levels. As such, the total information curve (information being inversely related to standard error) displays how well different ability levels are being estimated by the test in question (Thorpe & Favia, 2012). Thus, we can learn about how well the complex span tasks are measuring individuals of differing ability based on the location of the ability level information curve peak. If the information curve peaks at ⫽ ⫺1, for instance, this suggests that the test is better suited for lower ability subjects, particularly those 1 SD below mean performance. It is important to note that the distribution of subject ability levels do not affect the resulting information curve, and thus these curves are invariant to samples of differing ability levels.
Results Classical test theory. To get a better idea of the performance differences across our sample, descriptive statistics are provided on Table 1, broken down by which college subjects reported attending (Georgia Tech, Indiana University-Purdue University, and Atlanta community). Georgia Tech students (SAT average of 1430 out of 1600 for admitted freshmen) outperformed Indiana University-Purdue University students (SAT average of 1080 out of 1600 for admitted freshmen), who in turn outperformed community members. It is worth mentioning that community members who reported attending college significantly outscored community members who did not operation span (M ⫽ 51 and M ⫽ 45,
WHAT IRT CAN TELL US ABOUT COMPLEX SPAN TASKS
5
Table 1 Descriptive Statistics of Partial Span Scores by Demographic in Study 1 GT (n ⫽ 214)
IUPUI (n ⫽ 84)
Community (n ⫽ 246)
Task
M
SD
Skew
Kurt
M
SD
Skew
Kurt
M
SD
Skew
Kurt
OSpan SymSpan RotSpan
61 31 29
11 8 9
⫺1.2 ⫺.59 ⫺1.3
1.8 ⫺.27 1.8
54 26 26
15 8 9
⫺1.0 ⫺.42 ⫺.67
.74 ⫺.09 ⫺.27
47 23 20
17 8 9
⫺.36 ⫺.22 ⫺.19
⫺.67 ⫺.72 ⫺.38
This document is copyrighted by the American Psychological Association or one of its allied publishers. This article is intended solely for the personal use of the individual user and is not to be disseminated broadly.
Note. Ospan ⫽ operation span; RotSpan ⫽ rotation span; SymSpan ⫽ symmetry span; GT ⫽ Georgia Tech; IUPUI ⫽ Indiana University-Purdue University; Community ⫽ Subjects from the Atlanta community; Skew ⫽ skewness; Kurt ⫽ kurtosis.
respectively) but not the symmetry span (M ⫽ 22 and M ⫽ 23) or rotation span (M ⫽ 21 and M ⫽ 20). We also present descriptive statistics by set size for each task across the entire sample to explore potential ceiling or floor effects (see Table 2). Mean performance in the symmetry and rotation span appears to more or less plateau when more than two items are administered, however variance continues to increase with larger set sizes. In the operation span, performance plateaus around set size 5, though variance also continues to rise with large set sizes. For all three tasks, the performance on the lowest set size is near ceiling. As a validity check, we obtained the Pearson correlations of each complex span task. Partial span scores for all tasks were significantly correlated, demonstrating convergent validity. Specifically, the operation span correlated r ⫽ .54 with the symmetry span and r ⫽ .53 with the rotation span, and the symmetry span correlated r ⫽ .68 with the rotation span. Finally, the last check we did was for unidimensionality. Given that there could be multiple response processes, practice or learning effects, or other factors going into performance of the complex span tasks, it is possible that more than one factor could be accounting for the observed scores. For example, subjects might be responding differently to items in the first block of trials as opposed to the third due to developing strategies, the building of proactive interference, or that they are not sufficiently practiced on the task during the first block. For each task, we entered all individual set sizes (e.g., set size 3 block 1 operation span) within a task into an exploratory factor analysis and using a Varimax rotation. For each task, one dominant factor accounted for the bulk of the variance with no evidence1 of additional factors contributing to performance variance. The tasks therefore do not appear to be multidimen-
Table 2 Mean Performance for Each Task Based on Set Size in Study 1 OSpan
SymSpan
RotSpan
Set size
M
SD
M
SD
M
SD
2 3 4 5 6 7
— 2.6 3.3 3.9 4.1 4.1
— .55 .94 1.3 1.6 1.8
1.8 2.3 2.5 2.4 — —
.37 .75 1.1 1.4 — —
1.7 2.1 2.3 2.0 — —
.49 .80 1.2 1.3 — —
Note. OSpan ⫽ operation span; SymSpan ⫽ symmetry span; RotSpan ⫽ rotation span.
sional, as subjects are responding similarly across blocks and set sizes. IRT. Operation span. Because of fit issues with the constrained model of the operation span,2 we lifted the constraints that items of the same set size across blocks had equal parameters. As such, item discrimination and item difficulty parameters could vary across blocks for trials of the same set size. We only report results from the unconstrained model of the operation span. Fit. The ⫺2loglikelihood was 21,817. At the item level, Set size 3 of block 1 and set size 6 of block 2 failed to fit (p ⬍ .01). We tested if the unconstrained model had an overall better fit by comparing the change in ⫺2loglikelihood (21,977 – 21,817) and the change in df (90 –30). The resulting test of 2(160, 60), p ⬍ .001, was significant, indicating that indeed the unconstrained model does fit better than the constrained. Difficulty. The overall difficulty of the operation span was low, at around  ⫽ ⫺1.1 (see Figure 2) with no items having positive  value (see Table 3). The largest set size (7) had a difficulty of  ⫽ ⫺.45. Items became slightly easier in later blocks, with an average difference of  ⫽ .24 between set sizes in block 1 and the corresponding set size in block 3. Following this trend, the easiest item was set size 3 of block 3 ( ⫽ ⫺2.0) and the hardest was set size 7 of block 1 ( ⫽ ⫺0.34). Symmetry span. Fit. The ⫺2loglikehood was 16,793. At the item level, Set size 4 of block 2 did not have acceptable item fit (p ⬍ .01). Because only one item failed to fit, additional modeling was not undertaken. Difficulty. The overall difficulty of the symmetry span was higher than that of the operation span, but still low at  ⫽ ⫺0.5 (see Figure 3). At the item level, set size 2 had a difficulty of  ⫽ ⫺2.13, set size 3 had a difficulty of ⫺1.23, set size 4 had a difficulty of ⫺.58, and set size 5 had a difficulty of .05 (see Table 3). Rotation span. Fit. The ⫺2loglikehood was 5,304. At the item level, all items were at levels of acceptable fit (p ⬎ .01) and thus additional modeling was not undertaken. 1 Scree plots highly suggested one factor for each task, and eigenvalues for the second largest factor in each task was never larger than 1.1. 2 In the constrained model, three of the 15 items did not fit at the acceptable level of p ⬎ .01, and an additional three were borderline at p ⬍ .02.
DRAHEIM, HARRISON, EMBRETSON, AND ENGLE
This document is copyrighted by the American Psychological Association or one of its allied publishers. This article is intended solely for the personal use of the individual user and is not to be disseminated broadly.
6
approaching the p ⫽ .01 criterion for misfit in the unconstrained model as well, indicating this item was especially problematic in terms of parameter estimation. Furthermore, whereas the smallest three set sizes of the first block of the operation span failed to fit in the constrained model, only one of these three failed to fit in the unconstrained model. Symmetry and rotation span items fit much better, with only one total misfitting item among the two tasks. We will return to the issue of model fit in the operation span later. The overall difficulty of the complex span tasks is low in this study, with s between ⫺1.1 and ⫺0.5. This indicates that subjectlevel information and discrimination is maximized for below average subjects with these tasks. For subjects of ability levels higher than ⫽ .5 in the operation span and ⫽ 1 in the symmetry and rotation span, standard error is actually larger than information. In other words, these complex span tasks as they are typically administered are very poor at discriminating subjects whose ability levels are around .5 SDs above the mean and higher. This is a surprising and worrying finding given that the complex span tasks are often administered to higher ability subjects (e.g., college undergraduates). Releasing the constraints of equal parameters for the same set size across blocks on the operation span had no meaningful impact on the overall test or item difficulty, but it is interesting that items in the later blocks have lower difficulty estimates than items the first block. If it were the case that the buildup of proactive interference was having a strong impact on later items, items would become increasingly more difficult as proactive interference continued to increase. As such, later items being easier suggests that practice and learning effects are having a larger influence on performance than the buildup of proactive interference.
Figure 2. Total information curve for the unconstrained operation span in Study 1. Three blocks of set sizes 3–7 were administered. Item parameters were specified from a normal distribution N(0,1) and were allowed to vary in set sizes of the same length across different blocks.
Difficulty. The overall difficulty of the rotation span was between the operation and symmetry span at around  ⫽ ⫺0.9 (see Figure 4). Despite this, the individual items were all more difficult than the corresponding set size for the symmetry span. Set size 2 had a difficulty of  ⫽ ⫺1.29, set size 3 had a difficulty of ⫺0.91, set size 4 had a difficulty of ⫺0.36, and set size 5 had a difficulty of .41 (see Table 3).
Discussion In terms of fit, the items in the operation span task do not fit well, with the smaller set sizes in the first block being most problematic. In general, item misfit suggests that the pattern of responses for that particular item are different than the other items, and that the model is not accounting for this difference. Thus the smaller set sizes of the first block in the operation span are qualitatively different than the rest in terms of how subjects are responding, although it should be noted that other set sizes in the operation span were either below or barely achieved the level of acceptable fit (p ⬎ .01). When we lifted the constraints across blocks in the operation span and tested a nested model, the unconstrained model fit significantly better than the constrained overall, but two items still failed to fit. Set size 6 of block 2 did not fit in the constrained model, but it also was
Study 2 Study 2, like Study 1, was a large-scale correlational study designed to answer a multitude of research questions. Study 2 consisted of 45 cognitive tasks administered over four 2-hr long sessions at Georgia Tech. We modified each complex span task based on the results from Study 1 by adding two larger set sizes, and also followed the Foster et al. (2015) procedure by eliminating the third block for each task. Our primary questions for this study are whether adding the larger set sizes helps the task discriminate higher ability subjects, and if so to what extent.
Table 3 Item Parameters for Models in Study 1 OSpan
SymSpan
RotSpan
Set size
␣
SE

SE
␣
SE

SE
␣
SE

SE
2 3 4 5 6 7
— .75 .64 .56 .46 .44
— .06 .04 .04 .03 .03
— ⫺1.94 ⫺1.40 ⫺1.18 ⫺.84 ⫺.45
— .11 .08 .07 .06 .05
.92 .79 .68 .55 — —
.08 .05 .04 .04 — —
⫺2.13 ⫺1.23 ⫺.58 .05 — —
.13 .08 .06 .05 — —
1.62 .90 .84 .69 — —
.20 .10 .09 .07 — —
⫺1.29 ⫺.91 ⫺.36 .41 — —
.12 .11 .09 .12 — —
Note. Ospan ⫽ operation span; RotSpan ⫽ rotation span; SymSpan ⫽ symmetry span. ␣ ⫽ item discrimination;  ⫽ item difficulty. Results for OSpan are from the unconstrained model.
This document is copyrighted by the American Psychological Association or one of its allied publishers. This article is intended solely for the personal use of the individual user and is not to be disseminated broadly.
WHAT IRT CAN TELL US ABOUT COMPLEX SPAN TASKS
Figure 3. Total information curve for the symmetry span in Study 1. Three blocks of set sizes 2–5 were administered. Item parameters were specified from a normal distribution N(0,1) and constrained to be equal in set sizes of the same length across the three blocks.
Method Participants. Subjects were run at Georgia Tech. Proper ethical guidelines were followed and the study received approval from Georgia Tech’s Institutional Review Board. Our screening process required all subjects to be native English speakers aged 18 –35 with normal or corrected-to-normal vision. A total of 351 subjects completed all four sessions. Subjects were recruited from Georgia Tech, Georgia State University, and the greater Atlanta community. Subjects were compensated at a rate of $10/hour plus a $10 completion bonus after the final session. Georgia Tech students could choose to receive participation credit instead of financial compensation (1 credit ⫽ $10). Approximately half of the subjects were recruited from Georgia Tech or Georgia State, with the other half coming from the greater Atlanta community. Overall, 339 subjects had usable data for the operation span, 349 for the symmetry span, and 343 for the rotation span. Tasks. Complex span (WMC). The complex span tasks were the same as in Study 1, with two notable exceptions. First, we added two larger set sizes to each task (8 and 9 for operation span, 6 and 7 for symmetry and rotation spans). Second, two blocks of each set size were administered instead of three. Fluid Intelligence. Raven’s Advanced Progressive Matrices. In the Raven’s Advanced Progressive Matrices (Raven; Raven, 1962; odd problems), each trial contained eight abstract figures that were embedded in a 3 ⫻ 3 matrix. The ninth space was blank. Subjects chose which of several options completed the sequence. Ten minutes were allotted to solve 18 problems. The dependent variable is the number of correct responses. Letter sets. In the letter sets (Ekstrom, French, Harman, & Dermen, 1976), five strings of four letters were presented in each trial. Four of the strings followed a specific rule whereas one string did not. The subject needed to discover this rule and decide which string did not follow it. Seven minutes were given to complete 30 problems. The dependent variable is the number of correct responses.
7
Number series. In the number series task (Thurstone, 1938), a series of numbers was presented on a computer screen. A rule joined these numbers. The subject needed to discover this rule and decide which number was next in the sequence. Five minutes were given to complete 15 problems. The dependent variable is the number of correct responses. Analysis. All IRT analyses were conducted in a similar manner as in Study 2. IRT results. Operation span. Fit. As with the operation span in Study 1, to address item misfit we ran an unconstrained model in which the item parameters of the same set size were free to vary across blocks. For overall model fit, the ⫺2loglikelihood was 14,070. At the item level, all but one item (set size 8 of block 2) failed to fit at the p ⫽ .01 criterion, however set size 3 of block 1 and set size 4 of block 2 were very close (p ⬍ .02) to this threshold. We tested if the unconstrained model of the operation span had an overall significant fit by comparing the change in ⫺2loglikelihood (14,160 –14,070 and the change in df (96 – 48). The resulting test of 2(90, 48), p ⬍ .001, was significant, indicating that the unconstrained model did indeed fit better than the constrained. Difficulty. Overall, the operation span had a difficulty of around  ⫽ ⫺.5 (see Figure 5). With respect to item difficulty, the trend was similar to Study 1 in that corresponding set sizes were easier in block 2 than block 1, but to a lesser extent. Importantly, the two largest set size (8 and 9) had an item difficulty of  ⬎ 0 (see Table 4). Symmetry span. Fit. The ⫺2loglikelihood was 11,396. All 12 items met the criterion for acceptable model fit. Additional modeling was not conducted due to this. Difficulty. Overall difficulty for the increased set size symmetry span was above 0, at  ⫽ .5 (see Figure 6). What is most
Figure 4. Total information curve for the rotation span in Study 1. Three blocks of set sizes 2–5 were administered. Item parameters were specified from a normal distribution N(0,1) and constrained to be equal in set sizes of the same length across the three blocks.
DRAHEIM, HARRISON, EMBRETSON, AND ENGLE
This document is copyrighted by the American Psychological Association or one of its allied publishers. This article is intended solely for the personal use of the individual user and is not to be disseminated broadly.
8
Figure 5. Total information curve for unconstrained operation span in Study 2. Two blocks of set sizes 3–9 were administered. Item parameters were specified from a normal distribution N(0,1) and were allowed to vary in set sizes of the same length across the two blocks.
Figure 6. Total information curve for symmetry span in Study 2. Two blocks of set sizes 2–7 were administered. Item parameters were specified from a normal distribution N(0,1) and constrained to be equal in set sizes of the same length across the two blocks.
noteworthy is that the two largest set sizes both had a difficulty over  ⫽ 1 (see Table 4). Rotation span. Fit. The ⫺2loglikelihood was 10,717. All 12 items met the criterion for acceptable fit except set size 7 of block 1. Because only one item demonstrated misfit, additional modeling was not undertaken. Difficulty. Overall item difficulty of the rotation span was high, with a  ⫽ .7 (see Figure 7). As with the increased set size symmetry span, the largest two set sizes of the rotation span have an item difficulty of  ⬎ 1 (see Table 4). Classical test theory. Descriptives. We obtained descriptive statistics for each set size, similar to Study 1 (see Table 5). Of importance is that operation span performance still plateaus at around a set size of 5, although variance plateaus at around 7. For both the rotation and symmetry span tasks, performance plateaus at set size 5, but surprisingly drops after 5. Variance in these two tasks plateau at around a set size of 4 or 5. Reliability. Partial span scores for the standard administration of the complex span tasks have demonstrably high reliability (see Redick et al., 2012). We estimated reliability among the Study 2
tasks to ensure that adding larger set sizes and removing the third block of trials did not affect this. Given that there are not parallel forms of the complex span tasks, and that they were only administered once to each subject, internal consistency is the only approximation of reliability that could be obtained. We measured internal consistency by splitting each complex span task into two halves based on block (i.e., blocks 1 and 2), correlating the two halves, and stepping-up the correlations according to the Spearman-Brown prophecy formula. Using this calculation, the partial span scores of each complex span task were highly reliable. The partial span scores for all tasks had an internal consistency at or above .80. Specifically, .86 for the operation span, .80 for the symmetry span, and .83 for the rotation span. Note that the values are very close to the estimates for the operation and symmetry span tasks reported in Engle, Tuholski, Laughlin, and Conway (1999) and Kane et al. (2004). Correlational analyses. As in Study 1, we first wanted to demonstrate convergent validity by obtaining the Pearson correlations among the complex span tasks. All tasks strongly and significantly correlated with one another. Specifically, the operation span correlated r ⫽ .57 with the symmetry span and r ⫽ .55 with
Table 4 Item Parameters for Models in Study 2 OSpan
SymSpan
RotSpan
Set size
␣
SE

SE
␣
SE

SE
␣
SE

SE
2 3 4 5 6 7 8 9
— .60 .53 .44 .48 .53 .40 .48
— .07 .06 .05 .05 .05 .05 .05
— ⫺1.70 ⫺1.28 ⫺.99 ⫺.68 ⫺.18 .14 .10
— .16 .12 .11 .09 .07 .08 .08
.77 .79 .55 .54 .42 .48 — —
.10 .08 .06 .05 .04 .05 — —
⫺1.88 ⫺.83 ⫺.19 .31 1.02 1.28 — —
.20 .10 .09 .08 .12 .13 — —
.87 .69 .71 .73 .52 .51 — —
.10 .07 .07 .07 .05 .05 — —
⫺1.59 ⫺.84 ⫺.06 .64 1.35 1.60 — —
.15 .10 .08 .08 .13 .16 — —
Note. Ospan ⫽ operation span; RotSpan ⫽ rotation span; SymSpan ⫽ symmetry span. ␣ ⫽ item discrimination;  ⫽ item difficulty. Results for OSpan are from the unconstrained model.
WHAT IRT CAN TELL US ABOUT COMPLEX SPAN TASKS
9
Table 6 Item Analysis: Correlations to Fluid Intelligence for Each Set Size in Study 2
This document is copyrighted by the American Psychological Association or one of its allied publishers. This article is intended solely for the personal use of the individual user and is not to be disseminated broadly.
OSpan
SymSpan
RotSpan
Set size
r
p
r
p
r
p
2 3 4 5 6 7 8 9
— .50 .55 .61 .66 .70 .77 .67
— ⬍.001 ⬍.001 ⬍.001 ⬍.001 ⬍.001 ⬍.001 ⬍.001
.42 .66 .67 .68 .67 .64 — —
⬍.001 ⬍.001 ⬍.001 ⬍.001 ⬍.001 ⬍.001 — —
.46 .61 .68 .70 .67 .67 — —
⬍.001 ⬍.001 ⬍.001 ⬍.001 ⬍.001 ⬍.001 — —
Note. OSpan ⫽ operation span; SymSpan ⫽ symmetry span; RotSpan ⫽ rotation span Figure 7. Total information curve for rotation span in Study 2. Two blocks of set sizes 2–7 were administered. Item parameters were specified from a normal distribution N(0,1) and constrained to be equal in set sizes of the same length across the two blocks.
the rotation span, and the symmetry span correlated r ⫽ .70 with the rotation span. We also did the same check for unidimensionality as in Study 1 and found no evidence that any of the tasks were multidimensional. Subsequent correlational analyses are directed toward the relationship between individual trials and tasks with Gf. The relationship between WMC and Gf is a hallmark of WM research, and thus the extent to which a WM task performance relates to Gf is an indicator of predictive validity. Table 6 shows the correlation to Gf (defined as composite Z-Score of the three Gf tasks) for each individual trial of the complex span tasks. The correlations to Gf are stronger for the larger set sizes, and are strongest for set size 8 in the operation span and 5 in the symmetry and rotation span. With the recent work geared toward shortening the complex spans to make them more efficient, it seems prudent to attempt a direct comparison of these different methodologies. We accomplished this by deriving a total partial span score for each task in which certain set sizes are eliminated from the scoring. We followed the scoring procedure used in Foster et al. (2015) and Oswald et al. (2015), comparing these to the full-length task (i.e., when all trials and set sizes are scored). In addition, we removed the two smallest set sizes in each task and derived a partial span Table 5 Mean Performance for Each Task Based on Set Size in Study 2 OSpan
SymSpan
RotSpan
Set size
M
SD
M
SD
M
SD
2 3 4 5 6 7 8 9
— 2.5 3.1 3.6 3.9 3.8 3.7 3.8
— .73 1.1 1.5 1.8 2.2 2.2 2.3
1.7 2.0 2.1 2.1 1.8 1.7 — —
.49 .91 1.3 1.4 1.4 1.5 — —
1.7 2.9 2.0 2.7 1.5 1.5 — —
.53 .94 1.2 1.4 1.3 1.3 — —
Note. OSpan ⫽ operation span; SymSpan ⫽ symmetry span; RotSpan ⫽ rotation span.
score. Table 7 shows the correlations of each of the different scoring procedures to Gf. From this table we can see that removing the two smallest set sizes for each task does not at all impact the correlation between WMC performance and Gf. When the Foster et al. scoring procedure is used (two blocks, set sizes 3–7 for operation span and 2–5 for symmetry and rotation span) correlations to Gf are slightly lower but the only statistically different correlations between the Foster et al. tasks and the full-length tasks are with the operation span (p ⬍ .05). As for the Oswald et al. tasks (two blocks, set sizes 4 – 6 for operation span and 3–5 for symmetry and rotation span), the correlations to Gf are statistically lower than all of the full-length tasks with the exception of the symmetry span. When comparing the Foster et al. and Oswald et al. score correlations to Gf, the two different scoring procedures were not statistically different. At the composite level, all correlations were statistically different from one another, largely due to the high intercorrelation between the composite WMC scores (above .93 in all cases).3 Next, we divided the dataset into three groups based on composite WMC Z-Scores and ran the same correlations as in Table 7, but only for the highest scoring group (high spans, defined here as the top third of performers). Looking at only the high end inevitably lead to smaller overall correlations due to restriction of range, but the question of interest here is how the larger set sizes (e.g., 6 and 7 in the symmetry span) impact predictive validity at the highest end of the ability spectrum. These results are shown in Table 8 and overall are congruent with expectations from the IRT analyses.
Discussion IRT analyses. When the larger set sizes were added to the complex span tasks, they performed much better in terms of providing information for average and high-ability subjects. This was particularly true for the spatial tasks, as both the symmetry and rotation spans had an item difficulty above  ⫽ .5, meaning they provided the most information for subjects who are about .5 SDs above the mean. For the operation span, adding the two larger set 3 We used the Williams test of dependent correlations recommended by Steiger (1980) to test the statistical difference between the correlations, and used an uncorrected alpha of .05 for each test.
DRAHEIM, HARRISON, EMBRETSON, AND ENGLE
10
Table 7 Item Analysis: Comparison of Different Scoring Methods from Study 2 OSpan
SymSpan
RotSpan
WMC
Method
r
p
r
p
r
p
r
p
1 2 3 4
.55 .56 .50 .49
⬍.001 ⬍.001 ⬍.001 ⬍.001
.57 .57 .55 .54
⬍.001 ⬍.001 ⬍.001 ⬍.001
.61 .61 .60 .57
⬍.001 ⬍.001 ⬍.001 ⬍.001
.67 .69 .65 .64
⬍.001 ⬍.001 ⬍.001 ⬍.001
This document is copyrighted by the American Psychological Association or one of its allied publishers. This article is intended solely for the personal use of the individual user and is not to be disseminated broadly.
Note. Correlations to Gf. OSpan ⫽ operation span; SymSpan ⫽ symmetry span; RotSpan ⫽ rotation span; WMC ⫽ composite Z-score; Method 1 ⫽ all set sizes; Method 2 ⫽ smallest 2 set sizes removed; Method 3 ⫽ Foster et al. (2015) scoring method; Method 4 ⫽ Oswald et al. (2015) scoring method.
sizes brought the overall difficult up by almost two thirds of one SD, although the overall difficulty was still low and the difficulty of sets 8 and 9 were barely above average ability level. A further concern with the operation span is that five out of fourteen items did not meet levels of acceptable item fit before releasing the cross-set constraints, with four of them being in the first block. Correlational analyses. The correlational results from the individual set sizes are consistent with what expectations given the IRT data, as our sample was diverse and the highest correlations to Gf are found with the set sizes that discriminate best at the average ability level. That is, it is ideal in individual differences research to match the ability level of a sample with the difficulty of a test of item as this maximizes variance and results in the highest reliability and validity possible for that test or item. These high correlations to Gf for the set sizes that discriminate at the average ability level are a product of this maximization of reliability and validity. Looking at the different scoring procedures, a key result is that removing the two smallest set sizes (i.e., Method 2) did not result in lower correlations to Gf. This suggests that the smallest set sizes can be removed from the tasks to reduce administration time without affecting predictive validity. Furthermore, the Oswald et al. (2015) method of removing the largest and smallest set sizes from the typical administration of the operation span and smallest set size for the symmetry and rotation span performed the worst in terms of predictive validity, but not statistically different from the Foster et al. method.4 Another interesting and perhaps surprising result is that there was no difference in the correlations to Gf across the scoring procedures with the larger set sizes and Foster et al. (2015) for the two spatial tasks. That is, although the IRT results show that adding set sizes 8 and 9 to the symmetry and rotation span tasks increased their difficulty such that they discriminated high ability subjects better, the predictive validity was not affected. However adding the larger set sizes to the operation span (8 and 9) did impact predictive validity, as evidenced by the increased correlation to Gf over the Foster et al. method. Thus, despite it being the case that even the highest set sizes of the operation span (8 and 9) do not discriminate much above average ability level, the operation span benefitted the most from the additional set sizes in terms of predictive validity of the partial span scores. The results shown in Table 8 illustrate quite clearly the benefit of adding larger set sizes to the complex span tasks, and provide converging evidence with the IRT results that the typical administration of the complex spans (e.g., set sizes 3–7 for the operation span and 2–5 for the operation span, as in Study 1) are not
adequate for discriminating high ability subjects. When looking at only high span subjects (operationalized here as the top third of performers), the scoring procedures without the largest set sizes fail to significantly predict Gf in both the operation and symmetry span tasks. Furthermore, although the WMC composite scores from these two methods do significantly correlate to Gf, the magnitude of this correlation is much smaller than the methods with the largest set sizes included, as they predict less than 10% of the variance in performance whereas the scoring procedures with the larger set sizes included predict 22% and 25% of the variance. This provides strong evidence that adding the larger set sizes increases the utility of the complex span tasks when discriminating higher ability subjects, particularly in regards to the operation and symmetry span. Interestingly although the difference between the correlation of rotation span performance and Gf was significantly different between the Foster and Oswald tasks and the full-length and tasks, the magnitude of this difference was small in comparison to the other two tasks and the WMC composite. Overall, these results suggest that the smallest set sizes can be removed, at least from scoring, in the complex span tasks for normal populations. Furthermore, even the largest set sizes in the symmetry and rotation span tasks (6 and 7) are not necessary in studies involving a diverse sample, and the case can be made that these two tasks should have more set sizes around the 4 –5 range to maximize validity and discrimination. For example, it might be better to administer multiple sets of trials of sizes 4 and 5 and fewer sets of trials of set size 2, 3, 6, and 7 for the spatial tasks. In the operation span, however, the very largest set sizes (7–9) are the best overall, and thus a better administration of this task would be multiple sets of 6, 7, 8, and 9. As a final point about these data, the operation span scores had the weakest relationship to Gf of all the tasks in this dataset, which is on the whole not surprising given our previous experience with this task.
General Discussion Studies 1 and 2 have illuminated quite a bit about the complex span tasks. The most salient of which is that the operation span, the most commonly used complex span task, is not appropriate for discriminating high or even average ability subjects. The standard 4 Oswald et al. (2015) did not actually include the rotation span in their analyses. However, it is safe to assume that they would have removed the smallest set size in this task just as they did with the other tasks in their study.
WHAT IRT CAN TELL US ABOUT COMPLEX SPAN TASKS
11
Table 8 Item Analysis: Comparison of Different Scoring Methods from Study 2 in High Spans
This document is copyrighted by the American Psychological Association or one of its allied publishers. This article is intended solely for the personal use of the individual user and is not to be disseminated broadly.
OSpan
SymSpan
RotSpan
WMC
Method
r
p
r
p
r
p
r
p
1 2 3 4
.25ⴱ .27ⴱ .09 .07
.020 .013 .403 .491
.29ⴱ .31ⴱ .20 .19
.008 .004 .064 .295
.35ⴱ .38ⴱ .29ⴱ .29ⴱ
⬍.001 ⬍.001 .007 .010
.46ⴱ .50ⴱ .31ⴱ .27ⴱ
.013 ⬍.001 .004 .020
Note. Correlations to Gf among high spans only (tertile split). OSpan ⫽ operation span; SymSpan ⫽ symmetry span; RotSpan ⫽ rotation span; WMC ⫽ composite Z-score; Method 1 ⫽ all set sizes; Method 2 ⫽ smallest 2 set sizes removed; Method 3 ⫽ Foster et al. (2015) scoring method; Method 4 ⫽ Oswald et al. (2015) scoring method. ⴱ p ⬍ .05.
administration of the operation span includes set sizes 3–7, and in both studies set size 7 had an item difficulty below average ability level. In addition, operation span performance (when only scoring set sizes 3–7) did not significantly relate to Gf in the top third of performers in Study 1. However, adding set sizes 8 and 9 helped quite a bit in this regard. Thus while the operation span with set sizes 3–7 is not appropriate for discriminating subjects of average or above average ability, an operation span with set sizes 4 –9, for instance, would likely be a good verbal WMC task. The item misfit in the first block of trials of the unconstrained operation span is also a cause for concern, as it suggests subjects are responding somewhat differently in the first block compared to the second block. There are a few potential reasons for this. In terms of methodology, the operation span task is often the first task we administer in our studies, which was the case for both studies presented here. With individual differences work, counterbalancing is not advised as it creates a difference between subject A and subject B (i.e., task order) that potentially adds construct irrelevant variance, making it more difficult to find the effects of interest. Given that the operation span is the first task subjects complete, it could be the case that in the first block of trials they are merely getting used to being in the testing environment and familiarizing themselves with how to use our computer adaptive tasks. Some subjects will have more experience in this regard due to either participating in a previous study, or simply being more familiar with using a computer. In addition, it could be the case that subjects are well-learned on the general design of complex span tasks after completing the first block of the operation span, and thus we do not see item misfit in the rotation and symmetry span to the same extent because of this familiarity. If task order is the explanation, then the problem of item misfit does not lie with the operation span itself but rather our methodology.5 Another possibility is related to proactive interference build up. If it takes a few trials for proactive interference to build (through letters being repeatedly displayed), then the latter trials are qualitatively different from the earlier ones. However, proactive interference buildup is not the most likely explanation. Items in the latter blocks were less difficult than in block 1, albeit only slightly, but if proactive interference impacted performance it would be detrimental and not beneficial. Furthermore, it has been shown that proactive interference builds up very quickly, and thus is likely in full effect from the beginning of the real trials or, at the latest, after the first set size or two has been administered (Bunting, 2006; Keppel & Under-
wood, 1962). The unconstrained models thus suggest that strategy implementation and/or practice effects have a slightly stronger impact on performance in repeated blocks of the operation span than does proactive interference buildup. An important question is why exactly the operation span does not perform as well as the symmetry and rotation span tasks in terms of discriminating at the higher end of the ability spectrum. As Study 2 shows, adding larger set sizes helped to a large extent, but the two spatial tasks still outperformed the operation span in this regard. Item misfit could be an issue, but it is also the case that the operation span has the simplest stimuli, thus allowing subjects to engage in more strategic rehearsal of the stimuli. The processing task in the operation span might contribute to this as well, as simple arithmetic is likely automatic for higher ability subjects, and thus is not a useful distractor to prevent rehearsal. It also should be reiterated that the operation span is verbal in nature whereas the rotation and symmetry spans are spatial, which is a key distinction between the tasks. As it stands, it is not yet clear whether one of these factors is the main reason for the operation span not being as good of a task or if multiple factors contribute. In regards to the rotation span, this task is excellent in terms of predictive validity and discriminating high ability subjects, even when set sizes 6 and 7 are not present. The item difficulties of set sizes 3, 4, and 5 in the rotation span result in it being a good task to employ to a wide array of populations. The correlational analyses support this conclusion, as when we scored the rotation span following the Oswald et al. (2015) and Foster et al. (2015) procedures, it had the highest correlation among the complex span tasks to Gf and still significantly predicted Gf in high spans (defined). As a result, the typical administration of the rotation span does seem to be appropriate even for high ability samples. One caveat being that that the overall information curve for the standard administration of the rotation span is more left-shifted than the symmetry span (i.e., less information for higher ability subjects). 5 Note that there is good reason in administering the operation span task first. In general, our lab is most interested in WMC performance and given this plus the length of the complex span tasks, it is our approach to administer the complex span tasks at the beginning of sessions. The operation span is the easiest complex span task to grasp in terms of the instructions and nature of the stimuli, and as such it is usually the first complex span task we show the subjects so that they can better understand the symmetry and rotation span tasks later in the study.
This document is copyrighted by the American Psychological Association or one of its allied publishers. This article is intended solely for the personal use of the individual user and is not to be disseminated broadly.
12
DRAHEIM, HARRISON, EMBRETSON, AND ENGLE
Yet at the item level, the rotation span with set sizes 2–5 is more difficult than the symmetry span for corresponding set sizes. Adding the larger set sizes of 6 and 7 to the rotation span does still improve overall prediction and should be done if the target population is that of particularly high ability. Finally, the symmetry span task is quite similar to the rotation span in regards to difficulty and predictive validity. The standard administration of this task is appropriate for average ability subjects, and decent for high ability subjects, as the symmetry span did not significantly predict Gf performance in high spans but overall had a higher correlation to Gf than the operation span. However, we advise using the larger set sizes of 6 and 7 for higher ability samples, as with the rotation span.
Limitations Some limitations and caveats of our results warrant further discussion, namely in regards to the tasks, our sample, and unidimensionality assumption of our modeling approach. First, neither of our studies included the reading span task. The reading span is another popular verbal complex span tasks that likely parallels the operation span in terms of discrimination, reliability, predictive validity, and so forth. This particular task has fallen out of favor with our lab due to its reliance upon vocabulary and other non-WM related skills that introduce construct-irrelevant variance. Second, the nature of our sample differs from what is normally seen within the field of psychology. Whereas most cognitive studies rely on undergraduate psychology students, both samples here contained a large amount of Georgia Tech students (higher than average spatial and mathematical abilities, along with high SAT scores) combined with lower socioeconomic status community subjects. As such, the population we sample from is more diverse but includes two extremes. While we can speculate that the mean of these two groups will average out to be similar to the more typical public university used in most studies, this is not guaranteed. In addition, even if the means are similar, the combined distribution of Georgia Tech students and Atlanta community members will assuredly be much different (e.g., leptokurtic) than a distribution of more homogenous psychology undergraduates. Even though IRT estimates are said to be invariant to the sample, this is only true in theory rather than in practice, and as such the results of our studies could be in part a function of our population. To this end, we did run an additional analysis on the operation span from Study 1 in which only noncollege students were included to see how the operation span performs at the lower end of the distribution.6 The IRT analysis of the operation span on these 165 individuals shows that it is still discriminating at a lower-than-average ability level (see Figure 8, note that the model sets the average ability level at ⫽ 0). This provides strong evidence that the results and conclusions outlined throughout this paper and not a function of our population. In addition, it suggests that the standard operation span is not even good at discriminating higher ability subjects within the lowest performing group. Third, one reviewer noted that our findings and interpretations need to be qualified with respect to model fit. In instances of poor fit, results cannot be trusted to the fullest extent. We readily admit that the operation span had relatively poor fit, although releasing parameter constraints did improve overall and item fit. The spatial complex span
Figure 8. Total information curve for unconstrained operation span in Study 1, noncollege students only. Three blocks of set sizes 3–7 were administered. Item parameters were specified from a normal distribution N(0,1) and were allowed to vary in set sizes of the same length across different blocks. This analysis only includes subjects who indicated never attending college (n ⫽ 165).
tasks had a good overall fit, though there were some instances in which individual items did not achieve acceptable levels. Finally, the dimensionality of the tests should be addressed given that the IRT models we ran assumed unidimensionality. We ran an exploratory factor analysis on all complex span tasks in both studies, broken down by each individual set size (e.g., set size 3 for block 1 in the operation span was treated as a separate item from set size for block 2) and there was no evidence of multidimensionality. For all tasks, there was a large first factor with an eigenvalue above 4, and the next largest factor had an eigenvalue below 1.1. Examination of scree plots also indicated that only one factor was necessary. One caveat to this is that there are other ways to access multidimensionality. One such method is running multidimensional IRT models, which we attempted to do but the models would not converge. The evidence therefore suggests that performance in all complex tasks reported here is not multidimensional.
Conclusions This goals of this article were to further expand on our knowledge of the complex span tasks as well as to help guide researchers in terms of which of these tasks are best used in their study. In this regard, there is no one-task-fits-all explanation, but rather the appropriate task(s) depends on multiple factors, such as time constraints, type of sample, desire to have verbal or spatial tasks, the particular research question, and which statistical analyses are to be used. It cannot be overstated that measuring WMC as a construct should be done using multiple tasks. In this case, it is not as necessary to include larger set sizes and indeed the shortened 6 Subjects complete a demographic form prior to engaging in any computer tasks. One of the questions asks if they are attending or have ever attended college. For this analysis, only the 165 who indicated “no college” were included. Thus community subjects who had attended college (n ⫽ 81) were omitted.
This document is copyrighted by the American Psychological Association or one of its allied publishers. This article is intended solely for the personal use of the individual user and is not to be disseminated broadly.
WHAT IRT CAN TELL US ABOUT COMPLEX SPAN TASKS
tasks will work just fine.7 However, when using just a single complex span task it is imperative to select the appropriate one for the study and take into consideration the number of trials being administered. Correlational results demonstrate that the typical administration of the operation span is not adequate for high, and even average, ability subjects. IRT results showed item misfit with the first block of trials in the operation span, suggesting another concern and uncertainty about this task. As such, we strongly encourage researchers to avoid using the standard administration of operation span task on samples of higher ability, such as ones consisting entirely of university undergraduates. If researchers are interested in measuring WMC more broadly (at the latent or composite level), the operation span does however serve as a useful verbal WMC task. But as an individual measure of WMC, the operation span seems most useful for lower ability samples, and we recommend adding larger set sizes to the task to improve validity in almost all cases. In contrast, the symmetry and rotation span tasks are superior to the operation span in many ways. First, there are fewer issues of item misfit, suggesting that response patterns remain fairly consistent across blocks. Second, task performance correlates more strongly to Gf, demonstrating better predictive validity. Third, the stimuli are more complex and thus are not as susceptible to strategies and factors that could lead to construct irrelevant variance. Fourth, these tasks are much better at measuring higher ability subjects. And, fifth, these tasks take less time than the operation span to administer due to shorter practice instructions and less overall trials. To this point, adding larger set sizes to the spatial tasks results in approximately the same administration time as the standard-length operation span, but gives the researcher much more in terms of predictive validity. The rotation and symmetry span tasks with set sizes 2–5 is a good task to administer for most studies, but in some cases it is advised to include the larger set sizes as well. In terms of removing trials, our results provide substantive evidence that, at a minimum, the smallest set size for each task can be removed. These trials discriminate at such a low ability that they are not useful for just about any subject who could realistically participate in a psychology experiment, and furthermore performance on these trials correlates minimally with Gf. It also appears safe to remove the second smallest set size for each task as well (e.g., 4 for operation span, 3 for symmetry and rotation span), as these trials are not predictive at the average and high ability range. However, one potential concern is that removing trials does indirectly affect performance on other trials, and our analyses from Study 2 cannot speak to this issue. Thus more research is required to closely explore the impact removing smaller set sizes has on the task as a whole. For instance, it may be the case that practice has to be lengthened if some set sizes are to be removed. There is a trend in psychology for shorter, more efficient, tasks. This trend ultimately leads toward the employment of adaptive tasks that can accomplish more in 5–10 min than a nonadaptive task can accomplish in twice that. IRT analyses are essential in creating and understanding adaptive tasks, and it is our hope that IRT will become a more popular diagnostic tool for understanding tasks of different cognitive constructs. Ultimately, we also hope to use data-driven techniques to create adaptive complex span tasks such that we can get stable and valid estimates of WMC from a
13
fraction of the time it currently takes. The analyses presented here are an important first step for this to become a reality.8
7 Although these data are not presented here, we conducted confirmatory factor analyses from the data in Study 2 looking at the latent correlation of WMC and Gf while using all of the different scoring procedures for WMC (e.g., Foster, Oswald, full-length). The difference in the magnitude of this correlation was minimal across the different scoring procedures, suggesting that the shortened tasks are adequate for measuring WMC at the latent level. 8 As per APA guidelines, we are receptive to sharing any and all data from this paper in aggregate and de-identified form. The main data sets for both studies containing the complex span task set size scores and composite Gf scores can be found in the supplemental material as well as on our website (http://englelab.gatech.edu/data.html). You can also email Christopher Draheim at
[email protected] for questions regarding the data.
References Ackerman, P. L., Beier, M. E., & Boyle, M. O. (2005). Working memory and intelligence: The same or different constructs? Psychological Bulletin, 131, 30 – 60. http://dx.doi.org/10.1037/0033-2909.131.1.30 Baddeley, A. D. (1986). Working memory. Oxford, UK: Oxford University Press. Baddeley, A. D. (1992). Working memory. Science, 255, 556 –559. http:// dx.doi.org/10.1126/science.1736359 Baddeley, A. D., Gathercole, S. E., & Papagno, C. (1998). The phonological loop as a language learning device. Psychological review, 105, 158 –173. Baddeley, A. D., & Hitch, G. J. (1974). Working memory. In G. H. Bower (Ed.), The psychology of learning and motivation: Advances in research and theory (Vol. 8, pp. 47– 89). New York, NY: Academic Press. Bunting, M. (2006). Proactive interference and item similarity in working memory. Journal of Experimental Psychology: Learning, Memory, and Cognition, 32, 183–196. http://dx.doi.org/10.1037/0278-7393.32.2.183 Christopher, G., & MacDonald, J. (2005). The impact of clinical depression on working memory. Cognitive Neuropsychiatry, 10, 379 –399. http://dx.doi.org/10.1080/13546800444000128 Conway, A. R. A., Jarrold, C., Kane, M. J., Miyake, A., & Towse, J. N. (2007). Variation in working memory: An introduction. In A. R. A. Conway, C. Jarrold, M. J. Kane, A. Miyake, & J. N. Towse (Eds.), Variation in working memory (pp. 3–17). New York, NY: Oxford University Press. Conway, A. R. A., Kane, M. J., Bunting, M. F., Hambrick, D. Z., Wilhelm, O., & Engle, R. W. (2005). Working memory span tasks: A methodological review and user’s guide. Psychonomic Bulletin & Review, 12, 769 –786. http://dx.doi.org/10.3758/BF03196772 Daneman, M., & Carpenter, P. A. (1980). Individual differences in WM and reading. Journal of Verbal Learning & Verbal Behavior, 19, 450 – 466. http://dx.doi.org/10.1016/S0022-5371(80)90312-6 Daneman, M., & Merikle, P. M. (1996). Working memory and language comprehension: A meta-analysis. Psychonomic Bulletin & Review, 3, 422– 433. http://dx.doi.org/10.3758/BF03214546 Dempster, F. N. (1981). Memory span: Sources of individual and developmental differences. Psychological Bulletin, 89, 63–100. http://dx.doi .org/10.1037/0033-2909.89.1.63 Ekstrom, R. B., French, J. W., Harman, H. H., & Dermen, D. (1976). Manual for kit of factor referenced cognitive tests. Princeton, NJ: Educational Testing Service. Embretson, S. E. (1996). The new rules of measurement. Psychological Assessment, 8, 341–349. http://dx.doi.org/10.1037/1040-3590.8.4.341 Engle, R. W. (2002). Working memory capacity as executive attention. Current Directions in Psychological Science, 11, 19 –23. http://dx.doi .org/10.1111/1467-8721.00160
This document is copyrighted by the American Psychological Association or one of its allied publishers. This article is intended solely for the personal use of the individual user and is not to be disseminated broadly.
14
DRAHEIM, HARRISON, EMBRETSON, AND ENGLE
Engle, R. W., Carullo, J. J., & Collins, K. W. (1991). Individual differences in working memory for comprehension and following directions. The Journal of Educational Research, 84, 253–262. http://dx.doi.org/10 .1080/00220671.1991.10886025 Engle, R. W., Tuholski, S. W., Laughlin, J. E., & Conway, A. R. A. (1999). Working memory, short-term memory, and general fluid intelligence: A latent-variable approach. Journal of Experimental Psychology: General, 128, 309 –331. http://dx.doi.org/10.1037/0096-3445.128.3.309 Foster, J. L., Shipstead, Z., Harrison, T. L., Hicks, K. L., Redick, T. S., & Engle, R. W. (2015). Shortened complex span tasks can reliably measure working memory capacity. Memory & Cognition, 43, 226 –236. http:// dx.doi.org/10.3758/s13421-014-0461-7 Hambrick, D. Z., Oswald, F. L., Darowski, E. S., Rench, T. A., & Brou, R. (2010). Predictors of multitasking performance in a synthetic work paradigm. Applied Cognitive Psychology, 24, 1149 –1167. http://dx.doi .org/10.1002/acp.1624 Harrison, T. L., Shipstead, Z., Hicks, K. L., Hambrick, D. Z., Redick, T. S., & Engle, R. W. (2013). Working memory training may increase working memory capacity but not fluid intelligence. Psychological Science, 24, 2409 –2419. http://dx.doi.org/10.1177/0956797613492984 Kane, M. J., Bleckley, M. K., Conway, A. R., & Engle, R. W. (2001). A controlled-attention view of working-memory capacity. Journal of Experimental Psychology: General, 130, 169 –183. http://dx.doi.org/10 .1037/0096-3445.130.2.169 Kane, M. J., Conway, A. R. A., Hambrick, D. Z., & Engle, R. W. (2007). Variation in working memory capacity as variation in executive attention and control. In A. R. A. Conway, C. Jarrold, M. J. Kane, A. Miyake, & J. Towse (Eds.), Variation in working memory (pp. 21– 48). New York, NY: Oxford University Press. Kane, M. J., Hambrick, D. Z., & Conway, A. R. A. (2005). Working memory capacity and fluid intelligence are strongly related constructs: Comment on Ackerman, Beier, and Boyle (2005). Psychological Bulletin, 131, 66 –71. http://dx.doi.org/10.1037/0033-2909.131.1.66 Kane, M. J., Hambrick, D. Z., Tuholski, S. W., Wilhelm, O., Payne, T. W., & Engle, R. W. (2004). The generality of working memory capacity: A latent-variable approach to verbal and visuospatial memory span and reasoning. Journal of Experimental Psychology: General, 133, 189 – 217. http://dx.doi.org/10.1037/0096-3445.133.2.189 Kang, T., Cohen, A. S., & Sung, H. J. (2005, March). IRT model selection methods for polytomous items. Paper presented at the Annual Meeting of the National Council on Measurement in Education, Montreal, Canada. Keppel, G., & Underwood, B. J. (1962). Proactive inhibition in short-term retention of single items. Journal of Verbal Learning & Verbal Behavior, 1, 153–161. http://dx.doi.org/10.1016/S0022-5371(62)80023-1 Kyllonen, P. C., & Christal, R. E. (1990). Reasoning ability is (little more than) working-memory capacity?! Intelligence, 14, 389 – 433. http://dx .doi.org/10.1016/S0160-2896(05)80012-1 Martinussen, R., Hayden, J., Hogg-Johnson, S., & Tannock, R. (2005). A meta-analysis of working memory impairments in children with attention-deficit/hyperactivity disorder. Journal of the American Academy of
Child & Adolescent Psychiatry, 44, 377–384. http://dx.doi.org/10.1097/ 01.chi.0000153228.72591.73 Muraki, E. (1992). A generalized partial credit model: Application of an EM algorithm. ETS Research Report Series, 1992. Oberauer, K., Schulze, R., Wilhelm, O., & Süß, H. M. (2005). Working memory and intelligence–their correlation and their relation: Comment on Ackerman, Beier, and Boyle (2005). Psychological Bulletin, 131, 61– 65. Oswald, F. L., McAbee, S. T., Redick, T. S., & Hambrick, D. Z. (2015). The development of a short domain-general measure of working memory capacity. Behavior Research Methods, 47, 1343–1355. http://dx.doi .org/10.3758/s13428-014-0543-2 Raven, J. C. (1962). Advanced Progressive Matrices: Sets I and II. London, UK: H.K. Lewis. Redick, T. S., Broadway, J. M., Meier, M. E., Kuriakose, P. S., Unsworth, N., Kane, M. J., & Engle, R. W. (2012). Measuring working memory capacity with automated complex span tasks. European Journal of Psychological Assessment, 28, 164 –171. http://dx.doi.org/10.1027/ 1015-5759/a000123 Shah, P., & Miyake, A. (1996). The separability of working memory resources for spatial thinking and language processing: An individual differences approach. Journal of Experimental Psychology: General, 125, 4 –27. http://dx.doi.org/10.1037/0096-3445.125.1.4 Silver, H., Feldman, P., Bilker, W., & Gur, R. C. (2003). Working memory deficit as a core neuropsychological dysfunction in schizophrenia. The American Journal of Psychiatry, 160, 1809 –1816. http://dx.doi.org/10 .1176/appi.ajp.160.10.1809 Steiger, J. H. (1980). Tests for comparing elements of a correlation matrix. Psychological Bulletin, 87, 245–251. http://dx.doi.org/10.1037/00332909.87.2.245 Thorpe, G. L., & Favia, A. (2012). Data analysis using item response theory methodology: An introduction to selected programs and applications. Psychology Faculty Scholarship, 20. Retrieved from http:// digitalcommons.library.umaine.edu/psy_facpub/20/ Thurstone, L. L. (1938). Primary mental abilities. Chicago, Illinois: University of Chicago Press. Turner, M. L., & Engle, R. W. (1989). Is working memory capacity task dependent? Journal of Memory and Language, 28, 127–154. http://dx .doi.org/10.1016/0749-596X(89)90040-5 Unsworth, N., Heitz, R. P., Schrock, J. C., & Engle, R. W. (2005). An automated version of the operation span task. Behavior Research Methods, 37, 498 –505. http://dx.doi.org/10.3758/BF03192720 Unsworth, N., Redick, T. S., Heitz, R. P., Broadway, J. M., & Engle, R. W. (2009). Complex working memory span tasks and higher-order cognition: A latent-variable analysis of the relationship between processing and storage. Memory, 17, 635– 654.
Received May 26, 2016 Revision received December 16, 2016 Accepted December 26, 2016 䡲