June 29, 2017
12:50
WSPC/INSTRUCTION FILE
ws-ijufks
International Journal of Uncertainty, Fuzziness and Knowledge-Based Systems c World Scientific Publishing Company
PSYCHOLOGICAL FEATURES FOR AUTOMATIC TEXT SUMMARIZATION
David E. Losada Centro Singular de Investigaci´ on en Tecnolox´ıas da Informaci´ on (CiTIUS) Universidade de Santiago de Compostela, Spain
[email protected] Javier Parapar Information Retrieval Lab Department of Computer Science University of A Coru˜ na, Spain
[email protected] Received (received date) Revised (revised date) Automatically summarizing a document requires conveying the important points of a large document in only a few sentences. Extractive strategies for summarization are based on selecting the most important sentences from the input document(s). We claim here that standard features for estimating sentence importance can be effectively combined with innovative features that encode psychological aspects of communication. We employ Quantitative Text analysis tools for estimating psychological features and we inject them into state-of-the-art extractive summarizers. Our experiments demonstrate that this novel set of features is a good guidance for selecting salient sentences. Our empirical study concludes that psychological features are best suited for hard summarization cases. This motivated us to formally define and study the problem of predicting the difficulty of summarization. We propose a number of predictors to model the difficulty of every summarization problem and we evaluate several learning methods to perform this prediction task. Keywords: Automatic Text Summarization; Psychology of Natural Language use; Linguistic Inquiry Word Count; Predicting Summarization Difficulty
1. Introduction Automatic Text Summarization (ATS) is indispensable for dealing with the rapid growth of online content. It is a powerful technology that can quickly digest and skim large quantities of textual documents. ATS has been employed in numerous application domains 1,2 , such as news media –for instance, summaries of multiple stories on the same topic or event summarization over streams of documents 3 – , scientific literature –for instance, summaries of online medical literature 4 –, or intelligence gathering -for example., biographical summaries for use by intelligence analysts 5 . 1
June 29, 2017
2
12:50
WSPC/INSTRUCTION FILE
ws-ijufks
D.E. Losada & J. Parapar
Extractive Summarization has been an active subarea of ATS for decades. Extractive summarizers often apply shallow methods that extract salient parts of the source text and arrange them in some effective manner 1 . Features such as cue words, position within the text, or centrality (similarity to the text’s centroid) are widely exploited for estimating salience. In this paper we argue that language provides a full range of powerful indicators about emotions, cognition, and other psychological states; and these indicators can be exploited to extract salient sentences from the text. The style in which people use words reveals important aspects of their worlds, intentions, emotional states and cognitive styles 6 . In the Social Sciences, the relationship between word use and many social and psychological processes has been actively studied. Psychological word count approaches are potentially valuable for summarizing a text. When humans read a text, the occurrence of certain psychological dimensions –for instance, positive or negative emotions, or cognition words– might be noteworthy. Besides content words that relate to psychological processes, linguistic style markers –for example, pronouns– are also known to yield unexpected insights. Our study is an innovative way to understand what linguistic and psychological dimensions play a decisive role in revealing salient extracts of text. One of our conclusions is that psychological features are best suited for hard summarization cases. With this in mind, we decided to formally define and study the problem of predicting the difficulty of summarization. In this paper, we propose a number of predictors for modeling the difficulty of every summarization problem and we evaluate several learning methods to perform this prediction task. Using this predictive tool we also built a hybrid summarizer that, depending on the difficulty of the task, chooses between two base summarizers. The contributions of this paper are: • We define novel sentence features for extractive summarization based on Quantitative Text analysis tools developed from Psychology theories. To the best of our knowledge, this is the first attempt to include this type of features in the area of Text Summarization. • We combine these psychologically-derived features with more standard sentence features (position, centroid and length). This leads to a weighting function for sentence scoring that aggregates multiple types of evidence. • We inject this sentence scoring variant into a state-of-the-art summarization system that produces non-redundant summaries of the desired size. • We evaluate the resulting method for generic single-document and multidocument summarization tasks and compare it against standard baselines. • We analyze the feature’s weights in the best performing summarizers and find interesting connections with studies in the Social Sciences about types of writing and analytical thinking. • We define the problem of estimating the difficulty of summarization, propose predictive variables for handling this problem and build a hybrid sum-
June 29, 2017
12:50
WSPC/INSTRUCTION FILE
ws-ijufks
Psychological Features for ATC
3
marizer based on this new technology. The rest of the paper is organized as follows. Section 2 presents the main characteristics of the proposed summarization method. This includes a brief description of the psycholinguistic features and our proposal to integrate them into standard text summarizers. The experiments with the new text summarizers are reported in section 3. Section 4 describes our proposal of predicting summarization difficulty, and section 5 reports our experiments with a hybrid summarizer based on summarization difficulty technology. Related work is presented in section 6, and the paper ends exposing some conclusions. 2. Summarization Method Natural language use has been linked to personality, social status, contextual behaviour, and other psychological factors 6 . The linguistic style of an individual reveals aspects of himself, his target audience, and the situation he is in. The way in which people use words is a meaningful marker that has been studied with Quantitative Text analysis methods. These methods statistically analyze the occurrence of standard grammatical units, psychologically derived categories, and other linguistic dimensions. This tracking of language is potentially valuable in Text Summarization. For instance, the salient sentences of a text might exhibit certain stylistic patterns (for example, higher or lower percentage of personal pronouns; or higher or lower percentage of emotion words). Our method is based on exploiting these patterns in building extractive summaries. 2.1. LIWC Linguistic Inquiry and Word Count (LIWC) 7 is a Text analysis Tool that computes the degree to which people use different categories of words. There are more than 70 LIWC categories, which are hierarchically organised. The complete list of categories and some examples are reported in Table 1. The main top-level categories are linguistic processes (for example, personal pronouns, or verb tense), psychological processes (for example, affect words, emotions, or insights) and personal concerns (for example, work, or achievement). LIWC, which works from a dictionary of over 2300 words or word stems that have been associated to categories by independent judges, scans written text on a word by word basis and calculates the percentage of words in the text that match each category. LIWC is currently a reference tool that has been employed to quantitatively analyze a wide array of texts (for example, emails, speeches, or poems) in the context of numerous Text analysis studies. The interplay between these categories and different types of writing has been studied in the literature of the Social Sciences 8 . This led to findings such as the lower occurrence of I-words in formal writing, or the higher occurrence of quantifiers in analytical writing. LIWC categories are informative about writing styles and, therefore, potentially valuable to reveal salient content from text. This is precisely
June 29, 2017
4
12:50
WSPC/INSTRUCTION FILE
ws-ijufks
D.E. Losada & J. Parapar
the main aim of our research. Category Linguistic Processes Word count words/sentence Dictionary words Words ¿ 6 letters Function words Pronouns Personal pronouns 1st pers singular 1st pers plural 2nd person 3rd pers singular 3rd pers plural Impersonal pronouns Articles Common verb Auxiliary verbs Past tense Present tense Future tense Adverbs Prepositions Conjunctions Negations Quantifiers Numbers Swear words Psychological Processes Social processes Family Friends Humans Affective processes Positive emotion Negative emotion Anxiety Anger Sadness Cognitive processes Insight Causation Discrepancy Tentative Certainty Inhibition Inclusive Exclusive Perceptual processes See Hear Feel Biological processes Body Health Sexual Ingestion Relativity Motion Space Time Personal Concerns Work Achievement Leisure Home
Abbrev
Examples
wc wps dic sixltr funct pronoun ppron i we you shehe they ipron article verb auxverb past present future adverb prep conj negate quant number swear
I, them, itself I, them, her I, me, mine We, us, our You, your, thou She, her, him They, their It, it’s, those A, an, the Walk, went, see Am, will, have Went, ran, had Is, does, hear Will, gonna Very, really, quickly To, with, above And, but,whereas No, not, never Few, many, much Second, thousand Damn, piss, fuck
social family friend human affect posemo negemo anx anger sad cogmech insight cause discrep tentat certain inhib incl excl percept see hear feel bio body health sexual ingest relativ motion space time
Mate, talk,they, child Daughter,husband, aunt Buddy, friend, neighbor Adult, baby, boy Happy, cried, abandon Love, nice, sweet Hurt, ugly,nasty Worried,fearful, nervous Hate, kill,annoyed Crying, grief, sad cause, know, ought think, know,consider because, effect, hence should, would, could maybe, perhaps, guess always, never block,constrain, stop And, with, include But, without, exclude Observing, heard, feeling View, saw, seen Listen, hearing Feels, touch Eat, blood, pain Cheek, hands, spit Clinic, flu, pill Horny, love, incest Dish, eat, pizza Area, bend, exit, stop Arrive, car, go Down, in, thin End, until, season
work achieve leisure home
Job, majors, xerox Earn, hero, win Cook, chat, movie Apartment, kitchen, family Continued on next page
June 29, 2017
12:50
WSPC/INSTRUCTION FILE
ws-ijufks
Psychological Features for ATC Category
Abbrev
Examples
Money Religion Death Spoken categories Assent Nonfluencies Fillers
money relig death
Audit, cash, owe Altar, church, mosque Bury, coffin, kill
assent nonflu filler
Agree, OK, yes Er, hm, umm Blah, Imean, youknow
5
Table 1: LIWC dimensions
2.2. Injecting LIWC features into standard summarizers With LIWC, we computed sentence features to be taken into account for summarization. From each category, we defined a sentence feature. For instance, the LIWC feature we represents the percentage of first personal plural pronouns –or alike– (for example, we, us, or our) in the sentence. We normalised all feature values to [0,1] range. We intend to put LIWC categories into practice as a guidance mechanism for Text Summarization. We are committed not only to designing innovative summarization strategies but also to discovering what LIWC features are prominent in effective summaries. This latter objective will shed light on the (pyscho)linguistic constituents of abridged versions of text and will contribute towards understanding how information distillation works. We estimated sentence salience by combining multiple types of evidence. Standard signals, such as the position of a sentence in a text, or the similarity between the sentence and the document’s centroid, were combined with linguistically and psychologically derived signals obtained from LIWC. Our aggregation method is based on linearly combining all feature weights (position, centroid and LIWC) and, next, the combined score is employed for ranking sentences. We incorporated this new sentence weighting method into a state-of-the-art summarization system (MEAD). In areas like news summarization the leading sentences of each document are known to provide much information about the document’s contents. Therefore, extractive summarizers often weight the sentences appearing in the beginning of the documents more heavily. Another standard signal commonly employed in the literature of summarization is centroid similarity. First, a centroid is computed for each document (or cluster of documents) to be summarized. This centroid uses standard statistics –for example, tf-idf weighting– to estimate which words are central to the document (or cluster of documents). Next, each source sentence is also represented as a vector of weighted words and matched against the centroid using the cosine similarity metric or some variant. This similarity weight promotes sentences whose overall resemblance to the whole document (or cluster of documents) is high. MEAD 9 is a well-known toolkit that implements a variety of summarization algorithms. Besides providing us with effective baseline summarizers, MEAD has a flexible and modular architecture that permits to incorporate new sentence features. Some built-in features are the position (the position of the sentence in the
June 29, 2017
6
12:50
WSPC/INSTRUCTION FILE
ws-ijufks
D.E. Losada & J. Parapar
Table 2. Summarization DUC datasets and tasks. The table reports the main statistics of the collections and how we used them in our experiments (train or test). Single-doc summarization 2001T 2001 2002 (train) (test) (test) # docs or clusters summ. length avg #docs per cluster
2001MT (train)
Multi-doc summarization 2001M 2002M 2003M (test) (test) (test)
2004M (test)
298 100 words
308 100 words
534 100 words
30 100 words
29 100 words
116 100 words
30 100 words
50 665 bytes
-
-
-
9.97
10.17
9.59
9.93
10
document), centroid (cosine overlap of the sentence with the centroid vector of the document or cluster), and length.All feature values are linearly combined yielding an aggregated score for each sentence. These scores are used to build an initial ranking of sentences. Finally, a re-ranking module removes sentences that are too similar to sentences already in the ranking. The resulting ranked set of sentences is used to produce a summary of the desired size.
3. Summarization Experiments We performed single-document and multi-document summarization experiments, as defined by the Document Understanding Conferences (DUC)a . Two datasets were used for parameter tuning and the remaining datasets were used for testing (see Table 3). We implemented and tested the following summarization algorithms: • default MEAD. This is the default MEAD configuration based on centroid, position and length. The default feature weights are 1, 1, and 9, respectively. This means that sentences with less than 9 words are discarded, while sentences with 9 or more words are assigned an aggregated score equal to the sum of its centroid and position scores. • lead-based. This summarizer takes the initial sentences of the document or cluster to produce the summary. • random. Random selection of sentences from the document or cluster. • MEAD optimized (MEAD c+p tuned). This is the standard MEAD summarizer with centroid, position and length but we optimized the weights of these two features with the training data. • MEAD c+p+liwc. We computed LIWC features for each sentence and injected them into MEAD. The aggregated score was, therefore, a linear combination of centroid, position and the LIWC features. The combination weights were optimized with the training collection and the length cutoff was fixed to 9. Depending on the subset of LIWC features considered, this led to different summarizers (for example, MEAD c+p+ liwc(ling.)). a http://duc.nist.gov.
June 29, 2017
12:50
WSPC/INSTRUCTION FILE
ws-ijufks
Psychological Features for ATC
7
Following existing practice 10 , we employed the ROUGE-2 and ROUGE-SU4 metrics to automatically determine the quality of a summary by comparing it to summaries created by humans. The weights of the summarizer were tuned by optimizing ROUGE-2 with Particle Swarm Optimization (PSO) (full details in 11 , sect. 3.1). 3.1. Results The performance of each summarizer is reported in Table 3 (single-document summarization) and Table 4 (multi-document summarization). Not surprisingly, the random summarizer is the weakest for both types of tasks. The lead-based summarizer is comparable to default MEAD for single-document summarization but it is inferior to default MEAD for multi-document summarization. This makes sense. Summarizing a single document is easier and we can benefit from the journalistic style of writing (main ideas first). But summarizing multiple documents is harder and choosing leading sentences is suboptimal. Optimizing the centroid and position weights did not give much added-value: default MEAD and MEAD c+p tuned perform roughly the same. Including LIWC features was somehow beneficial, particularly for multi-document summarization. In most of the cases, the MEAD c+p+liwc(ling.) summarizer performed the best. The set of LIWC features associated with linguistic processes are the best performing LIWC features. The other subsets of LIWC features and the complete set of LIWC features (All) did not yield any consistent improvement. In the light of these results, we decided to further analyze the MEAD c+p+liwc(ling.) summarizerb . This summarizer gives preferences to sentences that i) have quantifiers, prepositions, conjunctions, impersonal pronouns, and ii) lack personal pronouns, 1st person plural, and adverbs. This fits well with some findings in the area of Psychology of Natural Language about writing and analytical thinking. A higher use of conjunctions, prepositions, and quantifiers is known to be associated with analytical thinking 8 . Our summarizer gives the most weight to sentences with conjunctions, prepositions, and quantifiers (very high weights to these three categories in both single-document and multi-document summarization). This suggests that it is trying to promote analytical excerpts, which are arguably core elements of the text. The summarizer’s weights also give preference to sentences with more self-references and fewer verbs (high 1st person singular weight and negative common/auxiliary verbs weights). The use of first-person singular pronouns has been associated with people writing about real experiences 8 . Additionally, real stories, when compared to imaginary or fabricated stories, have fewer verbs (particularly, fewer auxiliary verbs that express discrepancy such as would, could, or should). A sentence with both stylistic elements (more “I-words” and fewer verbs) has more chance to be selected as a summary sentence. Again, this makes sense because the summarizer is trying to b The
specifics of this analysis can be found in
11 .
June 29, 2017
8
12:50
WSPC/INSTRUCTION FILE
ws-ijufks
D.E. Losada & J. Parapar
Table 3. Test results (Single-Document Summarization). ROUGE-2 and ROUGE-SU4 scores are reported together with their 95% confidence intervals (in brackets). For each collection and performance measure the highest score is bolded. ROUGE-2 ROUGE-SU4 DUC2001 default MEAD .179 (.166,.194) .181 (.169,.192) random .127 (.116,.140) .142 (.133,.151) lead-based .193 (.179,.207) .182 (.172,.193) MEAD c+p .192 (.179,.206) .182 (.172,.192) MEAD c+p+liwc(all) .191 (.178,.205) .184 (.174,.195) MEAD c+p+liwc(ling.) .195 (.182,.209) .188 (.177,.199) MEAD c+p+liwc(psyc.) .191 (.177,.205) .185 (.174,.196) MEAD c+p+liwc(pers.) .191 (.178,.205) .186 (.175,.197)
ROUGE-2 ROUGE-SU4 DUC2002 .199 (.191,.208) .192 (.185,.200) .143 (.135,.152) .150 (.144,.157) .206 (.198,.215) .192 (.186,.200) .206 (.198,.215) .193 (.186,.199) .209 (.201,.218) .198 (.191,.205) .209 (.201,.218) .198 (.191,.204) .211 (.202,.219) .196 (.189,.203) .209 (.201,.218) .194 (.187,.201)
Table 4. Test results (Multi-Document Summarization). ROUGE-2 and ROUGE-SU4 scores are reported together with their 95% confidence intervals (in brackets). For each collection and performance measure the highest score is bolded.
default MEAD random lead-based MEAD c+p MEAD c+p+liwc(all) MEAD c+p+liwc(ling.) MEAD c+p+liwc(psyc.) MEAD c+p+liwc(pers.) default MEAD random lead-based MEAD c+p MEAD c+p+liwc(all) MEAD c+p+liwc(ling.) MEAD c+p+liwc(psyc.) MEAD c+p+liwc(pers.)
ROUGE-2 ROUGE-SU4 DUC2001M .051 (.037,.064) .082 (.068,.098) .031 (.021,.042) .064 (.054,.074) .030 (.021,.040) .063 (.054,.074) .057 (.042,.074) .088 (.072,.106) .055 (.042,.069) .085 (.073,.099) .066 (.049,.082) .100 (.082,.118) .058 (.042,.075) .086 (.072,.102) .056 (.039,.075) .086 (.070,.104) DUC2002M .068 (.061,.076) .095 (.0870,.103) .035 (.030,.041) .071 (.065,.076) .043 (.036,.050) .065 (.060,.071) .061 (.055,.067) .096 (.089,.103) .072 (.064,.081) .100 (.0937,.108) .071 (.063,.078) .104 (.097,.112) .062 (.056,.068) .093 (.086,.099) .066 (.059,.073) .099 (.091,.106)
ROUGE-2 ROUGE-SU4 DUC2003M .081 (.070,.093) .110 (.097,.122) .044 (.037,.053) .075 (.068,.082) .068 (.059,.077) .100 (.088,.111) .077 (.064,.091) .110 (.097,.123) .081 (.068,.093) .109 (.098,.121) .087 (.074,.101) .120 (.107,.133) .079 (.066,.091) .108 (.094,.121) .077 (.064,.089) .106 (.094,.117) DUC2004M .081 (.072,.089) .110 (.102,.119) .043 (.037,.050) .080 (.072,.087) .076 (.069,.082) .106 (.099,.114) .077 (.068,.086) .108 (.099,.117) .081 (.072,.089) .109 (.100,.117) .082 (.073,.090) .111 (.102,.119) .075 (.064,.084) .104 (.092,.114) .076 (.067,.085) .107 (.097,.117)
extract document passages that describe real stories or events. Another important conclusion of this analysis was that MEAD c+p+liwc(ling.) works well with difficult summarization cases, but easier summarization tasks can really be solved with standard summarizers. This motivated us to work on predicting the difficulty of summarization, which is the topic of the rest of this paper. 4. Predicting the Difficulty of Summarization Tasks The growth of digital contents calls for advanced tools that will be able to provide sophisticated Information Access services. For example, many search systems suffer from a radical variance in effectiveness when responding to users’ queries 12 . This has motivated the development of methods for estimating the query difficulty. Identifying difficult queries is essential for better servicing the users’ needs. Performance prediction technologies can be used by search engines in various ways. For example, to give direct feedback to the user, to guide metasearch and federated search, or to select the best search strategy for a given query.
June 29, 2017
12:50
WSPC/INSTRUCTION FILE
ws-ijufks
Psychological Features for ATC
9
The ability to predict query effectiveness has been recently studied in Information Retrieval 12 . Existing query difficulty methods can be roughly categorized into pre-retrieval and post-retrieval methods. Pre-retrieval methods predict the quality of search results before the search takes place. For example, by analyzing the user query and computing different statistics such as the average discriminative power of the query terms. In contrast, post-retrieval methods run the query and analyze the retrieved documents. For example, by looking for coherency and robustness of the ranked documents. Some query difficulty methods follow linguistic approaches –morphological, syntactical or semantical– and other methods follow statistical approaches. As argued by Carmel and Yom-Tov 12 , research on query difficulty has seen enormous progress in the last decade, but more accurate predictors are still required. We claim that this type of prediction technology can also be adopted for summarization tasks. Identifying difficult summarization problems can help to choose the best summarizer for a given input document or cluster. This could lead to improved summarizers that, depending on the difficulty of each case, choose among multiple base summarizers. In this section, we explain our proposal to create summarization difficulty effectiveness predictors and how to apply them for building hybrid summarizers. First, let us formally define the problem of predicting the difficulty of a summarization task. Given a document (single-document summarization) or cluster of documents (multi-document summarization), a summarizer takes the input and produces an automatic summary. As argued in previous sections, the quality of this automatic summary can be measured using metrics like ROUGE. The prediction task can be defined as a procedure that receives the input document(s) and returns a prediction to the quality of the resulting summary, i.e. the expected ROUGE. As argued above, there are two main classes of query difficulty predictors: preretrieval predictors and post-retrieval predictors. In a similar vein, predicting summarization difficulty could be done in a pre-summarization or post-summarization way. Pre-summarization predictors would only consider the input document(s) to make the prediction. Post-summarization predictors, instead, would employ a summarizer to obtain an automatic summary and, next, they would analyze both the resulting abstract and the input document(s). In this work, we will be only concerned with designing pre-summarization prediction methods, which have lower complexity. In any case, our formal definition of summarization prediction is a novel contribution of this paper, which opens the door to future developments in both pre- and post-summarization prediction.
4.1. A Regression Approach for Predicting Summarization Difficulty One possible approach for predicting the difficulty of summarization uses regression based on training data. The problem of estimating the quality of the output
June 29, 2017
10
12:50
WSPC/INSTRUCTION FILE
ws-ijufks
D.E. Losada & J. Parapar
summaries can be seen as a regression problem where the response variable is the ROUGE score of the output summary. How to extract a feature-based representation from each summarization case becomes a key modeling decision. We propose here a preliminary set of features that can act as predictor variables for the regression problem. These features capture different aspects of the input problem and we expect that some of them are indicative of the difficulty of the summarization task. Very much like pre-retrieval predictors in query difficulty estimation, these proposed features compute a number of statistics that model the characteristics of the input text (single document summarization) or cluster of texts (multi-document summarization). For example, some corpus statistics are indicative of how specific the topics of the documents are. This specificity (or lack of) has an impact on summarization difficulty. For single-document summarization, we propose the following features: X1 , X2 , X3 : Minimum, Maximum and Mean Inverse Document Frequency (IDF) of the terms (unigrams) of the input document. IDF is a well-known term weighting statistic that measures how discriminating a term is among documents. If a document has many high-idf (low-idf) terms then the document is quite specific (generic). From a summarization perspective, these situations could have an impact on the quality of the output summary. X4 : This is another idf-based feature that computes how many terms from the input document we need to get to one-fourth of the total idf. This feature is computed as follows. First, the total idf of the input document is computed by accumulating the idf of all terms. Next, the terms of the input document are ranked by decreasing idf. Finally, we inspect this ranking in a top-down fashion, we accumulate the idf of the terms and we stop when the accumulated idf exceeds 1/4 of the total idf of the document. If X4 is low then we just need a few high-idf terms to get to one-fourth of the total idf of the input document. If X4 is high then we need many terms to get to one-fourth of the total idf of the input document. Essentially, this feature captures how skewed the distribution of idfs of the document is (concentrated on a few high-idf terms vs or concentrated on many medium/low-idf terms). X5 : Mean length of the sentences of the input document. X6 : This is another length-based feature. It analyzes the distribution of the lengths of the sentences of the input document (in a similar way that X4 analyzes the idfs of the terms of the document). It encodes how many sentences we need to accumulate 1/4 of the total length of the document. X7 : Number of sentences of the input document. Documents with many sentences might be more difficult to summarize. X8 : Number of common words in the input document. A term is considered as a common word when its document frequency (df) in the corpus exceeds df M axCol/2, where df M axCol is the df of the term with the highest df in the collection. A document with too many common words might pose a problem for an automatic
June 29, 2017
12:50
WSPC/INSTRUCTION FILE
ws-ijufks
Psychological Features for ATC
11
summarizer. X9 : This is another df-based feature (equivalent to X6 for lengths or X4 for idfs). It computes the number of high-df terms needed to accumulate 1/4 of the total df of the terms in the input document. X10 : Number of high discriminative words in the input document. A term is considered as a high discriminative word when its IDF in the corpus exceeds idf M axCol/2, where idf M axCol is the idf of the term with the highest IDF in the collection. X11 : Equivalent to X9 , X6 and X4 . Number of high discriminative words needed to accumulate 1/4 of the total idf of the high discriminative words. X12 : Kullback Leibler Divergence (KLD) between the Language Model (LM) of the input document and the LM of the collection (both LMs are maximum likelihood estimators). This Information Theory measure captures the divergence between the word distribution of the input document and the word distribution of the corpus. It might be the case that documents with high overlapping with the topics of the collection are easier to summarize. X13 : Number of unique terms in the input document. X14 : type-token ratio, obtained by dividing the number of unique terms in the input document by the number of tokens (the total number of terms) in the input document. A high ratio indicates a high degree of lexical variation. X15 : percentage of terms of the input document that occur only once in the document. For multi-document summarization, we considered the following features: X1 − X15 : these features are the same as those considered for single-document summarization (computed at cluster-level). X16 , X17 , X18 : Maximum, median and minimum number of sentences in the input documents (cluster of documents to be summarized). X19 , X20 , X21 : Maximum, median and minimum pairwise similarity of the documents from the cluster. A cluster with many similar documents might be easier to summarize when compared to a cluster where most documents are dissimilar. It is quite possible that some features are correlated. However, we opted for considering a complete list of predictor variables and employed different model selection techniques that work well with redundant or correlated features. 4.1.1. Is there a relationship between ROUGE and our proposed features? In a multiple linear regression setting, the model takes the form: Y = β0 + β1 X1 + ... + βd Xd . In our case, Y is the ROUGE score of the output summaryc , and d c The
experiments reported in this section were performed with ROUGE-2 as the response variable and default MEAD as the base summarizer. However, equivalent predictive models can be built for ROUGE-SU4 and other summarizers.
June 29, 2017
12
12:50
WSPC/INSTRUCTION FILE
ws-ijufks
D.E. Losada & J. Parapar
is the number of features (15 for single-document summarization and 21 for multidocument summarization). Under this multiple regression setting, a first question we need to ask is whether the set of proposed features is useful at all. We can answer this question by testing if at least one of the features is related to the response variable. A formal way to approach this is to employ the F-statistic for multiple linear regression. This test consists of the following null and alternative hypotheses: H0 (null hypothesis): β1 = β2 = ... = βd = 0, H1 (alternative hypothesis): βj 6= 0, for at least one value of j. If there is compelling evidence against the null hypothesis, then we can conclude that at least one feature must be predictive of the response. Otherwise, we can conclude that there is no statistical evidence that our set of features is useful at all. For single-document summarization, this test provided evidence in favor of the proposed set of features (all p-values –2001T, 2001 and 2002 collections– were less than 10−4 ). For multi-document summarization, the test revealed that we cannot conclude that the set of 21 features has any predictive power (all p-values greater than 0.05). Perhaps we need more sophisticated features for predicting the quality of multi-document summarization tasks; or perhaps predicting the quality of multidocument summaries is not feasible at all. We left this exploration for future work and focused here on predicting the difficulty of single-document summarization tasks. 4.1.2. What model selection methods are more effective? Now, it is natural to wonder which are the predictive models that we must employ. It is likely that the response is only related to a subset of the predictors. Model selection techniques work with multiple input features and fit a single model involving only a subset of the features. In this section, we try alternative ways to do this fitting. The task of determining which features are associated with the target variable, in order to fit a single model involving only those features, is often referred to as feature selection. We can perform feature selection by trying out different models, each containing a different subset of the predictors. For example, with 2 features (X1 and X2 ) we can consider four different models (the model with no features, the model with all features, the model containing X1 only, and the model containing X2 only) and, next, select the best model out of the four. In order to make this selection, various alternatives have been proposed to judge the quality of a model. Some strategies, such as adjusted R2 , Cp and BIC, make an estimation of the test error. This works as follows. Given a model, constructed from a given subset of the features on the training data, its training error cannot be the main quality measurement. Model selection by training error would always end up selecting a model involving all of the features. We would choose models that overfit to the training cases (a low training error by no means guarantees a low test error). One possibility consists of indirectly estimating the test error by making an adjustment
June 29, 2017
12:50
WSPC/INSTRUCTION FILE
ws-ijufks
Psychological Features for ATC
13
to the training error to account for the bias due to overfitting. This is the approach followed by adjusted R2 , Cp and BIC. Another class of model selection consists of directly estimating the test error, using cross-validation. In this way, the average error obtained over a series of crossvalidation experiments is the estimate of test error employed for model selection. This approach has an advantage relative to the methods that make an indirect estimation of the test error, in that it provides a direct estimate of the error, and makes fewer assumptions about the underlying models. A different model selection alternative consists of fitting a model that contains all features using a method that constrains the feature coefficients towards zero. These shrinkage regression models, which do not follow the ordinary least squares procedure, can avoid overfitting because their fitting procedure automatically trades between the training error and the complexity of the model. The three classes of methods discussed so far involve regression models, fitted via least squares or shrunken approaches, that use the original set of features. The last possibility that we explore consists of transforming the features and then fit a model using the transformed variables. These methods are referred to as dimension reduction methods. Model Selection by indirect estimation of the test error. With supervised learning, we should not estimate the error of the models using the training error (effectiveness on the training subset). There are different ways to estimate the error that the models would make on unseen cases: adjusted R2 . The R2 statistic of a multiple regression model provides a measure of fit (proportion of variance explained by the model). But the R2 cannot be used to select among a set of models with a different number of features (the error decreases as more features are included in the model). The adjusted R2 is a statistic that introduces a penalty for the inclusion of unnecessary features in the model. Following standard practice, we employed a k-fold approach with the training data (k=4) and, thus, we got 4 different training subsets. With each training fold, we tested regression models built with every possible subset of features (215 modelsd ) and chose the model with the highest adjusted R2 . The four selected models have 7, 5, 7 and 7 features, respectively. Each model was then tested against its test fold, and the average error was computede . Cp . For a fitted least squares model containing d features, the Cp statistic of the test error adds a penalty to the training error based on the number of features and an estimate of the error variance. The procedure is equivalent to the procedure followed with adjusted R2 : four folds were extracted from the training data, every possible subset of features was tested on each training fold, and model selection was
d Best
subset selection is feasible here because the number of features is low. report here the results obtained with the single-document 2001 collection. Similar results were obtained with the other single-document summarization collections. e We
June 29, 2017
14
12:50
WSPC/INSTRUCTION FILE
ws-ijufks
D.E. Losada & J. Parapar
made with Cp . The number of selected features was 3, 4, 5, and 4, respectively. Bayesian Information Criterion (BIC). This is an alternative way of adjusting the training error based on the model size. It is derived from a Bayesian point of view, and it ends up looking similar to Cp . The BIC estimate places a heavier penalty on models with many features and hence results in sparser models when compared with Cp . The number of selected features was equal to 2 on all folds. Model Selection by estimation of the test error using cross-validation. The approaches described above extract four different training subcollections and do the estimation of the test error based only on information extracted from the training subsets (i.e. the test subsets are discarded). As an alternative, we can estimate the test error using cross-validation. With 4-fold cross-validation, every model built from each training subset is evaluated against its corresponding test subset, and the mean error obtained over the four partitions is used as an estimate of the test error. This procedure provides a direct estimate of the test error and, relative to adjusted R2 , Cp or BIC, makes fewer assumptions about the true underlying model. The lowest error of model selection using cross-validation was obtained with regression models with only 2 features. Model Selection with Shrinkage Methods. The approaches just discussed fit ordinary (least squares) regression models that contain a subset of the features. As an alternative, we can fit a model containing all features employing a technique that regularizes or constrains the coefficients (βi s) associated with the features. By shrinking the coefficient estimates towards zero we can significantly reduce their variance and improve the fit of the models: Ridge regression. It is similar to least squares regression, but it minimizes a quantity P that does not only take into account the training error (RSS +λ βj2 , where RSS is the residual sum of squares, which represents the error of the model on the training P examples; and λ βj2 is the regularization component). In this way, we do not only search for models that fit well with the training data, but also have low estimates of βj (ideally, many βj s equal to 0). Lasso regression. A problem with Ridge regression is that it often leads to final P 2 models that include all features. The penalty βj shrinks the coefficient of the features towards zero, but it does not set any of them exactly to 0. This creates a challenge in model interpretation. Lasso regression is an alternative that minimizes: P P RSS + λ |βj |. By replacing the L2-based penalty of Ridge ( βj2 ) by a L1-based P penalty ( |βj |), the Lasso has the effect of forcing some of the coefficients to be exactly zero and, hence, it automatically performs feature selection. In our experiments with Ridge, 15 features had always a non-zero coefficient. Lasso regression, instead, fitted sparse models: the best performing models had only 5 or 6 features with non-zero coefficients. Model Selection with Dimensionality Reduction Methods. The approaches that we have discussed so far are defined using the original features, and they try to avoid overfitting either by using a subset of the features or by shrinking their
June 29, 2017
12:50
WSPC/INSTRUCTION FILE
ws-ijufks
Psychological Features for ATC
Adj R2 Cp BIC Best sub. CV Lasso Ridge PCR PLS
2001T 0.0127 0.0126 0.0125 0.0125 0.0129 0.0131 0.0132 0.0129
2001 0.0137 0.0139 0.0133 0.0133 0.014 0.0134 0.0136 0.0136
15
2002 0.0071 0.0072 0.0072 0.0071 0.0071 0.0071 0.0072 0.0071
Table 5. Mean Squared Error of regression models built by different model selection strategies.
coefficients towards zero. Another class of approaches transform the features and then fit a model using the transformed features: Principal Component Regression (PCR). PCR uses Principal Component Analysis (PCA) for deriving a low-dimensional set of features. In particular, PCA constructs a set of principal components that are linearly uncorrelated. The first component encodes the direction of the data along which the observations vary the most. The second component has the highest variance possible under the constraint that it is orthogonal to the first component, and so forth. PCR constructs the first principal components and then uses these components as features in a linear regression model that is fit using least squares. Partial Least Squares (PLS). With PCR, the principal components are built in an unsupervised way: the response variable is not employed for determining the principal components. Consequently, there is no guarantee that the directions that best explain the features will also be the best directions for predicting the response. PLS is another dimension reduction method that identifies the new features in a supervised way (making use of the response variable). In this way, the transformed features not only approximate the original features well but also are related to the target variable. In our experiments, the lowest errors were found with a reduced number of components (4 components for PCR and 1 component for PLS). Let us now compare all these model selection approaches against the three singledocument summarization benchmarks. Table 5 reports the Mean Squared Errors (MSE) of the regression models fitted by all these strategies. Overall, there is not much difference among the methods tested. Still, best subset selection done with cross-validation is the most consistent approach and leads to regression models that are interpretable. We, therefore, set this approach as our reference method. 4.1.3. What features are important? The best subset selection method with cross-validation facilitates the analysis of the relevant features. For each collection, Table 6 lists the features included into the regression models fitted on each fold. Several interesting conclusions can be derived from this analysis. First, the sets of selected features are quite consistent across folds. Second, the X14 feature is always included into the selected regression
June 29, 2017
16
12:50
WSPC/INSTRUCTION FILE
ws-ijufks
D.E. Losada & J. Parapar
Fold Fold Fold Fold
1 2 3 4
2001T {X2 , X14 } {X2 , X14 } {X2 , X14 } {X2 , X14 }
Collection 2001 2002 {X1 , X14 } {X4 , X7 , X12 , X13 , X14 } {X1 , X14 } {X4 , X7 , X12 , X13 , X14 } {X1 , X14 } {X4 , X5 , X12 , X13 , X14 } {X1 , X14 } {X4 , X7 , X12 , X13 , X14 }
Table 6. Features included into the regression models fitted by the best subset selection method.
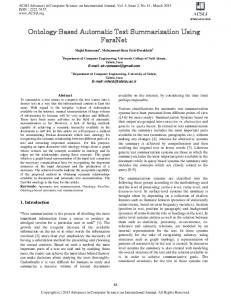
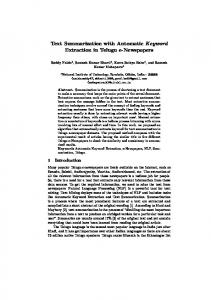
models. This is strong evidence to suggest that the type-token ratio of the document to be summarized is indicative of the difficulty of the summarization task. In all fitted models, the X14 feature had assigned a negative coefficient. This means that the higher the type-token ratio of the document, the lower predicted quality of the resulting summary. High type-token ratio means high vocabulary variation and low repetition of words. It makes sense that documents with high type-token ratio are harder to summarize because standard summarization strategies leverage word repetition and other related statistics to select extracts from the text. Other features that have been included into some regression models are idf-based (X1 , X2 , X4 ), length-based (X5 , X7 ), KLD-based (X12 ) and vocabulary-based (X13 ). Given these results, the reference models that we employed for our further experiments (next section) were a linear regression model with X2 and X14 (2001T collection); a linear regression model with X1 and X14 (2001 collection); and a linear regression model with X4 , X7 , X12 , X13 , and X14 (2002 collection). 5. A hybrid summarizer based on difficulty prediction Having decided on which prediction strategy performs the best, let us now inject this predictive technology as a component of a summarization system. As argued above, sophisticated linguistic-based summarizers –MEAD c+p+liwc(ling.)– work well with difficult summarization cases, but do not improve over standard summarizers –standard MEAD– when the summarization task is easy. A natural solution to this problem is to employ the MEAD c+p+liwc(ling.) summarizer for harder cases and the standard MEAD summarizer for easier cases. The decision on which base summarizer to choose would be based on the predicted difficulty of the summarization task. This hybrid summarizer has an implicit parameter, which is the threshold to differentiate difficult and hard summarization cases. Every document that needs to be summarizer is passed to the difficulty prediction module and if the predicted difficulty is above the threshold then the summarization is done with standard MEAD; otherwise, the summarization is done with MEAD c+p+liwc(ling.). To understand the limits of hybrid summarization, we also implemented an oracle summarizer, which always selects the summarizer whose output summary results in the highest ROUGE2. Figure 1 presents the results of these experiments. We compare this hybrid summarizer against standard MEAD, MEAD c+p+liwc(ling.), and the oracle summarizer. Fixing the threshold to 0.35 is the most consistent setting. Still, the improvements of the hybrid summarizer over MEAD c+p+liwc(ling.) are
June 29, 2017
12:50
WSPC/INSTRUCTION FILE
ws-ijufks
Psychological Features for ATC
Hybrid summariser (2002)
0.22
0.23
Hybrid summariser (2001)
0.21
Hybrid summariser (2001T)
Oracle
Oracle
0.22
0.21
0.20
Oracle
17
LIWC
0.21
ROUGE2
ROUGE2
LIWC
0.17
0.19
0.18
ROUGE2
0.20
0.19
LIWC
0.0
0.1
0.2
0.3
Threshold
0.4
0.5
0.20
Baseline
0.19
0.18
Baseline
0.17
0.15
0.16
Baseline
0.0
0.1
0.2
0.3
0.4
0.5
Threshold
0.0
0.1
0.2
0.3
0.4
0.5
Threshold
Fig. 1. Hybrid summarizers
insignificant. However, there is still room for improvement. The difference between the performance of the oracle summarizer and the hybrid summarizer is substantial (at least 10% improvement). This suggests that more sophisticated ways to do the prediction could lead to hybrid summarizers that are superior to both base summarizers. 6. Related Work Two broad approaches to Automatic Text Summarization have been identified in the literature 1 . Shallow approaches do not go beyond a syntactic level of representation and confine themselves to extracting salient parts of the text based on statistical, semantic –at word level–, or syntactic features. Deeper approaches employ natural language generation and semantic or discourse level representations. In Extractive Summarization, a large majority of approaches follow the classic framework proposed by Edmundson 13 , which is based on sentence scoring by the weighted combination of several predefined features. Some well-known summarization systems, such as MEAD 9 , follow this framework and incorporate new features or apply more sophisticated weighting methods. For instance, MEAD includes a re-ranking stage that removes redundant sentences following the Maximal Marginal Redundancy (MMR) principle 14 . To the best of our knowledge, our paper is the first attempt to inject psycholinguistic features into a state-of-the-art summarizer. Psychological aspects of natural language use have been studied for a broad range of applications 6 , e.g. to support analysis of emotions, personality, demography, health, deception, and other social or contextual variables. Word counting methods have helped to discover distinctive patterns of how people communicate in different situations. For instance, LIWC dimensions have been effectively used in opinion spam detection 15 , sexual predator identification 16 , or author gender identification 17 . A LIWC-based analysis was also recently conducted for predicting academic performance from students’ written
June 29, 2017
18
12:50
WSPC/INSTRUCTION FILE
ws-ijufks
D.E. Losada & J. Parapar
self-introductions 18 . Regarding evolutionary methods for summarization, we have to refer to the recent work done by Kumar et al. 19 . In this paper, the authors address the multidocument summarization task with Genetic Algorithms (GA). In a first step, they identify relations among documents; next, they score sentences from different documents taking into account the cross-document relations. Experiments against the DUC2002 dataset report improvements with respect to traditional cluster-based approaches. More recently, Khan et al. 20 also presented a method for multi-document summarization that employs GA to weight features resulting from a semantic role labelling process. Again with the DUC2002 corpus, they also obtained improvements over existing summarization methods. Attacking Text Summarization with psycholinguistic features is a novel and interdisciplinary way of approaching the problem. We expect that our current results stimulate discussion on this intriguing topic. 7. Conclusions In this paper, we have provided preliminary empirical evidence on the effect of psycholinguistic features in Automatic Text Summarization. Inspired by advances in the Social Sciences, we defined a novel set of features –related to psychological dimensions– and injected them into a state-of-the-art summarization system. We found that the summarizer that includes linguistic LIWC dimensions is the best performing summarizer. There are interesting connections between the occurrence of certain linguistic dimensions –for example, pronouns– and types of writing and thinking. Another important finding is that our novel summarization approaches are better suited for hard summarization cases. With this in mind, we decided to explore the selective application of standard summarization methods or more advanced summarizers depending on the estimated difficulty of the summarization task. To do so, we defined predictors for estimating the difficulty of summarizing a given document or cluster. Acknowledgments This work has received financial support from the i) “Ministerio de Econom´ıa y Competitividad” of the Government of Spain and FEDER Funds under the research project TIN2015-64282-R, ii) Xunta de Galicia (project GPC 2016/035), and iii) Xunta de Galicia – “Conseller´ıa de Cultura, Educaci´ on e Ordenaci´ on Universitaria” and the European Regional Development Fund (ERDF) through the following 2016-2019 accreditations: ED431G/01 (“Centro singular de investigaci´ on de Galicia”) and ED431G/08. References 1. I. Mani. Automatic Summarization. J. Benjamins Publishing Company, 2001. 2. Mahak Gambhir and Vishal Gupta. Recent automatic text summarization techniques: a survey. Artificial Intelligence Review, 47(1):1–66, 2017.
June 29, 2017
12:50
WSPC/INSTRUCTION FILE
ws-ijufks
Psychological Features for ATC
19
3. Chris Kedzie and Kathleen McKeown. Extractive and abstractive event summarization over streaming web text. In Proceedings of the Twenty-Fifth International Joint Conference on Artificial Intelligence, IJCAI 2016, New York, NY, USA, 9-15 July 2016, pages 4002–4003, 2016. 4. Rashmi Mishra, Jiantao Bian, Marcelo Fiszman, Charlene R. Weir, Siddhartha Jonnalagadda, Javed Mostafa, and Guilherme Del Fiol. Text summarization in the biomedical domain: A systematic review of recent research. Journal of Biomedical Informatics, 52:457 – 467, 2014. Special Section: Methods in Clinical Research Informatics. 5. Liang Zhou, Miruna Ticrea, and Eduard H. Hovy. Multi-document biography summarization. CoRR, abs/cs/0501078, 2005. 6. J. Pennebaker, M. Mehl, and K. Niederhoffer. Psychological aspects of natural language use: Our words, our selves. Annual Review of Psychology, 54(1):547–577, 2003. 7. Y. R. Tausczik and J. Pennebaker. The psychological meaning of words: Liwc and computerized text analysis methods. Journal of Language and Social Psychology, 29(1):24– 54, 2010. 8. J. Pennebaker. The secret life of pronouns: what our words say about us. Bloomsbury Press, New York, 2011. 9. D. Radev, T. Allison, S. Blair-Goldensohn, J. Blitzer, A. C ¸ elebi, S. Dimitrov, E. Drabek, A. Hakim, W. Lam, D. Liu, J. Otterbacher, H. Qi, H. Saggion, S. Teufel, M. Topper, A. Winkel, and Z. Zhang. MEAD – A platform for multidocument multilingual text summarization. In Conference on Language Resources and Evaluation (LREC), Lisbon, Portugal, 2004. 10. J. Steinberger and K. Jezek. Evaluation measures for text summarization. Computing and Informatics, 28(2):251–275, 2009. 11. D Losada and J. Parapar. Injecting multiple psychological features into standard text summarisers. In Proceedings of the 4th Spanish Conference on Information Retrieval, CERI ’16, pages 3:1–3:8, New York, NY, USA, 2016. ACM. 12. D. Carmel and E. Yom-Tov. Estimating the query difficulty for information retrieval. In Fabio Crestani, St´ephane Marchand-Maillet, Hsin-Hsi Chen, Efthimis N. Efthimiadis, and Jacques Savoy, editors, SIGIR, page 911. ACM, 2010. 13. H. P. Edmundson. New methods in automatic extracting. Journal of the Association for Computing Machinery, 2(16):264–285, 1969. 14. J. Carbonell and J. Goldstein. The use of MMR, diversity-based reranking for reordering documents and producing summaries. In Proceedings of the 21st Annual International ACM SIGIR Conference on Research and Development in Information Retrieval, SIGIR ’98, pages 335–336, New York, NY, USA, 1998. ACM. 15. M. Ott, Y. Choi, C. Cardie, and J. Hancock. Finding deceptive opinion spam by any stretch of the imagination. In Proceedings of the 49th Annual Meeting of the Association for Computational Linguistics: Human Language Technologies - Volume 1, HLT ’11, pages 309–319, Stroudsburg, PA, USA, 2011. Association for Computational Linguistics. 16. J. Parapar, D. Losada, and A. Barreiro. A Learning-Based Approach for the Identification of Sexual Predators in Chat Logs. In PAN 2012 Lab Uncovering Plagiarism, Authorship, and Social Software Misuse, at Conference and Labs of the Evaluation Forum CLEF, Rome, Italy, 2012. 17. N. Cheng, R. Chandramouli, and K.P. Subbalakshmi. Author gender identification from text. Digital Investigation, 8(1):78–88, 2011. 18. R. L. Robinson, R. Navea, and W. Ickes. Predicting final course performance from students’ written self-introductions: A LIWC analysis. Journal of Language and Social
June 29, 2017
20
12:50
WSPC/INSTRUCTION FILE
ws-ijufks
D.E. Losada & J. Parapar
Psychology, 32(4):469–479, 2013. 19. Y. Kumar, N. Salimb, A. Abuobiedac, and A.T. Albaham. Multi document summarization based on news components using fuzzy cross-document relations. Appl. Soft Comput., 21(C):265–279, August 2014. 20. A. Khan, N. Salim, and Y. Jaya Kumar. A framework for multi-document abstractive summarization based on semantic role labelling. Appl. Soft Comput., 30(C):737–747, May 2015.