Psychological Science http://pss.sagepub.com/
The Attentional Blink Reveals the Probabilistic Nature of Discrete Conscious Perception Christopher L. Asplund, Daryl Fougnie, Samir Zughni, Justin W. Martin and René Marois Psychological Science published online 16 January 2014 DOI: 10.1177/0956797613513810 The online version of this article can be found at: http://pss.sagepub.com/content/early/2014/01/15/0956797613513810 A more recent version of this article was published on - Mar 12, 2014
Published by: http://www.sagepublications.com
On behalf of:
Association for Psychological Science
Additional services and information for Psychological Science can be found at: Email Alerts: http://pss.sagepub.com/cgi/alerts Subscriptions: http://pss.sagepub.com/subscriptions Reprints: http://www.sagepub.com/journalsReprints.nav Permissions: http://www.sagepub.com/journalsPermissions.nav
Version of Record - Mar 12, 2014 >> OnlineFirst Version of Record - Jan 16, 2014 What is This?
Downloaded from pss.sagepub.com at Harvard Libraries on June 7, 2014
513810
research-article2014
PSSXXX10.1177/0956797613513810Asplund et al.Attentional Blink Reveals Discrete Conscious Perception
Psychological Science OnlineFirst, published on January 16, 2014 as doi:10.1177/0956797613513810
Research Report
The Attentional Blink Reveals the Probabilistic Nature of Discrete Conscious Perception
Psychological Science 201X, Vol XX(X) 1–8 © The Author(s) 2014 Reprints and permissions: sagepub.com/journalsPermissions.nav DOI: 10.1177/0956797613513810 pss.sagepub.com
Christopher L. Asplund1, Daryl Fougnie2, Samir Zughni3,4, Justin W. Martin5, and René Marois3,4 1
Division of Social Sciences, Yale-NUS College; 2Department of Psychology, Harvard University; Department of Psychology, Vanderbilt University; 4Vanderbilt Vision Research Center, Vanderbilt University; and 5Department of Cognitive, Linguistic and Psychological Sciences, Brown University 3
Abstract Attention and awareness are two tightly coupled processes that have been the subject of the same enduring debate: Are they allocated in a discrete or in a graded fashion? Using the attentional blink paradigm and mixture-modeling analysis, we show that awareness arises at central stages of information processing in an all-or-none manner. Manipulating the temporal delay between two targets affected subjects’ likelihood of consciously perceiving the second target, but did not affect the precision of its representation. Furthermore, these results held across stimulus categories and paradigms, and they were dependent on attention having been allocated to the first target. The findings distinguish the fundamental contributions of attention and awareness at central stages of visual cognition: Conscious perception emerges in a quantal manner, with attention serving to modulate the probability that representations reach awareness. Keywords attention, consciousness, cognitive processes Received 5/29/13; Revision accepted 10/30/13
How do the stimuli that engage people’s sensory systems rise to the level of conscious perception (Baars, 2005)? Some models view awareness as graded, with the quality of a conscious percept reflecting the amount of sensory information and attention available (Bar et al., 2001; Nieuwenhuis & de Kleijn, 2011; Overgaard, Rote, Mouridsen, & Ramsøy, 2006). Other models, by contrast, posit that although sensory information and attention may be graded, the resulting conscious percept is essentially discrete—either all or none (Dehaene, Changeux, Naccache, Sackur, & Sergent, 2006; Quiroga, Mukamel, Isham, Malach, & Fried, 2008; Vul, Hanus, & Kanwisher, 2009). This fundamental question has often revolved around the attentional blink (AB) paradigm (Chun & Potter, 1995; Nieuwenstein, Van der Burg, Theeuwes, Wyble, & Potter, 2009; Raymond, Shapiro, & Arnell, 1992), as it clearly implicates central attentional limits to conscious perception (Dux & Marois, 2009). The AB reflects the transient inability to consciously perceive the second of two
targets (T2) in a rapid serial visual presentation (RSVP) of distractors when T2 is presented at a short lag (200–400 ms) after the first target (T1). At issue here is whether failures to report T2 occur because no information about that target reaches postperceptual stages of information processing, or because the information is so degraded when it reaches those stages that the conscious representation of the target is inaccurate. Because standard AB tasks measure discrimination or detection accuracy, they cannot distinguish between these possibilities. To overcome this limitation, recent studies have relied either on inferring probabilistic distributions from multiple guesses (Vul et al., 2009) or on analyzing subjective judgments (Sergent & Dehaene, 2004) to determine whether target perception is all-or-none. However, Corresponding Author: René Marois, Department of Psychology, Vanderbilt University, 530 Wilson Hall, 111 21st Ave. South, Nashville, TN 37240 E-mail:
[email protected]
Downloaded from pss.sagepub.com at Harvard Libraries on June 7, 2014
Asplund et al.
2 indirect subjective methods, which involve subjects introspecting about how clearly they perceive a target or how confident they are about their perceptual decisions, may be unreliable (Clifford, Arabzadeh, & Harris, 2008; Hannula, Simons, & Cohen, 2005; Seth, Dienes, Cleeremans, Overgaard, & Pessoa, 2008). Moreover, previous approaches have yielded conflicting results, providing evidence both for (Sergent & Dehaene, 2004; Vul et al., 2009) and against (Nieuwenhuis & de Kleijn, 2011; Overgaard et al., 2006) quantal perception in the AB. To address the issue of whether conscious perception in the AB is discrete, we used a direct and continuous perceptual measure: Subjects reported the quality of their T2 representations by selecting values along a circular dimension of a target feature (e.g., color), and we examined the error distribution of these responses. On trials in which T2 is consciously perceived, a subject’s errors will be distributed around the correct value, with the width of the error distribution corresponding to the quality of the T2 percept (narrower distributions imply more precise information). The responses on trials in which T2 is not perceived will be random and uncorrelated with the correct value, so the distribution of response error will be uniform. The observed error distribution can thus be modeled as a mixture of these two component distributions in order to measure the probability that T2 is encoded (Pe) and the quality with which T2 is perceived
a
(standard deviation, σ; Anderson & Awh, 2012; Bays, Catalao, & Husain, 2009; Fougnie, Asplund, & Marois, 2010; Zhang & Luck, 2008). If awareness of T2 is all-ornone, then the lag between T1 and T2 should affect the probability that T2 is perceived, but not the precision with which it is perceived. By contrast, if awareness emerges in a graded manner, then an increasingly precise perception of T2 should be established with longer T1-T2 lags.
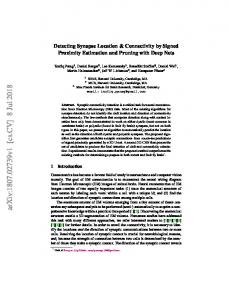
Experiment 1: Color AB Task Method Subjects. Twenty-eight subjects (13 males, 15 females; ages 18–28 years) from the Vanderbilt University community participated in this study after giving informed consent.1 The data from 4 additional subjects were removed owing to at-chance T1 performance (n = 3) or extremely poor T2 performance (n = 1). Stimuli and procedure. The task consisted of reporting the color of two squares presented on a computer monitor in an RSVP stream of colored circles (Fig. 1). A trial began with a centrally presented fixation dot (0.35° × 0.35°) that was followed by an RSVP stream of 10 to 23 colored disks and two square targets (T1 and T2;
T2 Response Instruction
T2 Response Wheel
T1 Response Instruction
Error: 6 degrees
FIRST square: black or white?
RSV
P
Color of SECOND square?
Feedback (500 ms)
T2
b
T1 7, 9, 11, or 13 Distractors
Fixation (500 ms) Fig. 1. The color attentional blink task (Experiment 1). Two targets (T1, T2) were embedded in a rapid serial visual presentation (RSVP) stream of colored circles (a). Subjects reported the color of T2 using a color wheel (b) and then reported whether T1 was black or white.
Downloaded from pss.sagepub.com at Harvard Libraries on June 7, 2014
Attentional Blink Reveals Discrete Conscious Perception 3 2.2° across; Fig. 1a). T1 was either black or white and appeared at serial position 8, 10, 12, or 14. T2 was 1 of 180 equiluminant colors (drawn from Commission Internationale de l’Éclairage L*a*b* color space, centered at L = 54, a = 18, b = –8, with a radius of 59) and appeared 1, 2, 4, or 8 serial positions (lags) after T1. T2 was always followed by 3 distractor circles that terminated the RSVP stream. Subjects reported the color of T2 by moving the mouse to select 1 of the 180 colors, which were displayed as a color wheel (6.5° radius, 1.1° wide; Fig. 1b). Feedback (error in degrees) was displayed for 500 ms. Subjects then indicated whether T1 was white or black via a key press. Responses were not time restricted. Prior to the experiment, subjects performed 8 practice trials. The stimulus duration was 190 ms for the first 2 practice trials and 130 ms for the remaining 6 trials. Each subject completed 160 experimental trials in each of four blocks. Stimulus duration for these trials began at 130 ms but was adjusted after every 8th trial to maintain T2 performance near 60% at Lags 1 and 2 (average duration = 115 ms, SD = 10 ms). Specifically, stimulus duration was adjusted (± ≤ 20 ms) based on the number of T2 responses in the preceding 8 trials that were within 45° of their respective targets. Analysis. Response error was calculated for each trial as the deviation between the target’s true color value and the subject’s response. Errors were modeled as a weighted mixture of two distributions, with guess responses drawn from a uniform distribution and nonguess responses drawn from a circular normal distribution defined by its
a
Results Although T1 performance was consistently high regardless of lag (Fig. 2a), a one-way within-subjects analysis of variance revealed that Pe for T2 was sharply affected by lag, F(3, 81) = 19.85, p < .001. The time course of encoding performance was consistent with the presence of an AB (Fig. 2b). A post hoc t test between the diagnostic AB lag (Lag 2) and a long lag (Lag 8) revealed that Pe was lower at Lag 2, t(27) = 7.29, p < .001 (see Fig. 3 for aggregated response-error data). Moreover, Pe was higher at Lag 1 than at Lag 2, t(27) = 2.94, p < .01, a well-known
b T1 Report Probability
1.0
0.9
T2T1 Report Probability (Pe)
30
p(Correct Report)
0.9
0.8 0.7 0.6 0.5
c
0.8 0.7
2
4
Lag
8
0.5
20
15
0.6
1
T2T1 Report Precision (σ)
25
σ (°)
1.0
p(Correct Report)
mean (µ, a measure of bias) and concentration (k, a measure of spread, converted to σ; Zhang & Luck, 2008). The mixture parameter Pe (relative weight of the circular normal distribution) reflected the probability of encoding T2. The parameter values for each subject and lag condition were computed using maximum likelihood estimation. As is typical in AB studies, only T2 responses for trials in which T1 was reported correctly (T2|T1) were analyzed. Except for a slight (2°) response bias (µ) at Lag 1, no response bias was detected. Conventional parametric statistical tests were used to assess the effects of lag on σ and Pe. The strength of evidence for key null effects reported here was also estimated using Bayes factor analysis (see Supplementary Analysis: Bayes Factors in the Supplemental Material available online). Finally, we ensured that a typical AB was observed when response options for T2 were discrete instead of continuous (see Supplementary Experiment 1 in the Supplemental Material).
1
2
4
8
Lag
10
1
2
4
8
Lag
Fig. 2. Results for the color attentional blink task (Experiment 1): (a) probability of correct report of the first target (T1) as a function of the lag between T1 and the second target (T2), (b) probability of T2 encoding (Pe) as a function of T1-T2 lag, and (c) precision of T2 encoding (σ) as a function of T1-T2 lag. Note that lower σ values (standard deviation of report error) correspond to better precision. The results for T2 were calculated using data only from those trials in which T1 was reported correctly (T2|T1). Error bars represent standard errors of the mean.
Downloaded from pss.sagepub.com at Harvard Libraries on June 7, 2014
Asplund et al.
4
Lag 2
Lag 8 P e = 0.719 σ = 20.4
–180
Frequency
Frequency
P e = 0.538 σ = 20.6
–90
0
90
180
–180
–90
Response Error (°)
0
90
180
Response Error (°)
Fig. 3. Distribution of response errors for the second target (T2) in the color attentional blink task (Experiment 1), aggregated across all subjects separately for Lags 2 and 8. Each distribution was modeled (black line) as a mixture of two distributions, with nonguess responses drawn from a circular normal distribution and random guesses drawn from a uniform distribution. Pe = probability of T2 encoding; σ = precision of T2 encoding (in degrees).
feature of the AB known as Lag-1 sparing (Raymond et al., 1992; Visser, Zuvic, Bischof, & Di Lollo, 1999). Unlike Pe, σ for T2 was barely affected by lag, F(3, 81) = 2.27, p = .09 (Fig. 2c). That marginal effect cannot account for the AB, however, as σ was no greater at Lag 2 than at Lag 8, t(27) = 0.34, p = .73. Instead, the marginal effect appears to have been driven by higher σ at Lag 1 than at Lag 2, t(27) = 1.87, p = .07, perhaps because the high contrast of T1 affected precision of encoding T2. A follow-up experiment ruled out the possibility that T2 perception was too impoverished for effects on σ to be observed, as the same pattern of results was obtained when Pe was above 80% at short lags (see Supplementary Experiment 2 in the Supplemental Material).
Experiment 2: Face AB Task Does the quantal nature of conscious perception found in Experiment 1 generalize to other stimulus classes and AB paradigms? Color stimuli contain little information and can be fully encoded in 50 ms (Todd, Han, Harrison, & Marois, 2011; Vogel, Woodman, & Luck, 2006). It is possible that lag effects on the precision of T2 encoding emerge only when stimuli are presented too briefly to be fully encoded, so that attention can play a role in increasing the amount of information that is extracted from T2. In addition, the results of Experiment 1 may have been tied to the specific structure of the task, in which the feature to be reported (color) was distinct from that used to identify T2 (shape). To address these issues in Experiment 2, we used faces as targets, as faces are complex stimuli that take several hundred milliseconds to be fully encoded (Curby
& Gauthier, 2007; Eng, Chen, & Jiang, 2005; Todd et al., 2011). Furthermore, instead of an RSVP design, we used a skeletal AB paradigm (Ward, Duncan, & Shapiro, 1996): The only stimuli were the two face targets (and surrounding masks), which allowed for straightforward selection of the T2 stimulus (Fig. 4). Two parameters were manipulated across trials: the stimulus onset asynchrony (SOA) of T1 and T2, which was either short (200 ms) or long (800 ms), and the duration of T2, which was either 100 or 200 ms. The latter manipulation provided a built-in control for assessing the sensitivity of the mixture-modeling analysis to detect changes in precision, as variations in stimulus duration modulate the amount of information extracted (e.g., Todd et al., 2011). Moreover, as AB effects are attenuated at longer stimulus durations (Reeves & Sperling, 1986), one would expect a much weaker AB with the 200-ms stimulus duration.
Method Subjects. There were 16 subjects (6 males, 10 females; ages 19–28 years). Four additional subjects were excluded because their T1 performance was at chance (n = 2) or their T2 report accuracy was too low (Pe < 10%, n = 2) for us to calculate reliable precision estimates (Anderson & Awh, 2012). Stimuli and procedure. Each trial consisted of the serial presentation of two masked face targets for subsequent report (Fig. 4a). T1 was one of two female faces, T2 was a face chosen from a pseudocontinuous stimulus space of 3 faces and 147 morphs between them, and the masks were mosaic scrambles of these faces.
Downloaded from pss.sagepub.com at Harvard Libraries on June 7, 2014
Attentional Blink Reveals Discrete Conscious Perception 5
a
T2 Response Wheel
Blank (210 ms) Mask (100 ms)
Error: 88 degrees
T2 (100 or 200 ms)
trea
m
Mask (100 ms)
Stim
ulu
sS
Blank (500 ms) Mask (100 ms)
Feedback (500 ms)
T1 Response Panel First face? < M or N >
b These Frames Omitted in Short-SOA Condition
T1 (100 ms) Fixation (500 ms)
Fig. 4. The face attentional blink task (Experiment 2). As illustrated in (a), two masked faces (T1, the first target; T2, the second target) were presented sequentially with either a short (200 ms) or a long (800 ms) stimulus onset asynchrony (SOA). Subjects used a face wheel (b) to report the identity of T2 and then reported which of two faces had been presented as T1.
To construct the morphed faces, we chose three highly distinct male faces as anchors and constructed a linear progression of 49 morphs between each pair of anchor faces using Norrkross MorphX (Norrkross Software, http://www.norrkross.com). Each target face subtended 4.2° × 4.2°. The scrambled faces (6.3° × 6.3°) were created by dividing a given morphed face into 16 tiles and randomly selecting the tiles with replacement to form a 6 × 6 grid. A trial began with the presentation of a fixation dot, followed by T1 (100 ms), and then a scrambled face (100 ms) that served as a backward mask (Fig. 4a). In the short-SOA condition (200 ms), T2 and its backward mask immediately followed T1’s mask. In the long-SOA condition (800 ms), T1’s mask was followed by a blank (500 ms), after which scrambled faces immediately preceded and followed T2. These sequences ensured that T2 was equally masked in the two SOA conditions because the T1 backward mask in the short-SOA condition also served as a forward mask for T2. The manipulations of SOA and T2 duration were fully crossed. To prevent subjects from focusing on specific locations in each face, we jittered each stimulus’s position by up to 0.7°. A probe face wheel appeared 210 ms after presentation of the T2 mask. Fifteen 2.0° × 2.0° faces (equally separated in the physical and morph space used to create the stimuli) appeared around the 11.9° wheel (Fig. 4b).
Subjects used a computer mouse to move a black indicator until it pointed to the perceived T2 face or a mental interpolation between two adjacent faces. Feedback on the response error (in degrees) was provided for 500 ms. Finally, a display (“First face?”) prompted subjects to indicate by button press which of the two female faces had been presented as T1. Subjects practiced on 8 trials before completing four blocks of 160 trials each. Supplementary Experiment 3 confirmed that a standard AB could be observed with the skeletal design and face stimuli, whereas Supplementary Experiment 4 confirmed that these effects were largely due to attending to T1 (see the Supplemental Material for details on these experiments).
Results T1 accuracy, as well as Pe and σ for T2, were submitted to two-way within-subjects analyses of variance with factors of SOA and T2 duration. T1 accuracy showed only a small effect of SOA, F(1, 15) = 16.22, p = .001 (Fig. 5a). For Pe, the SOA × T2 Duration interaction was significant, F(1, 15) = 13.82, p = .002. Pe was markedly reduced when the SOA and T2 duration were both short (Fig. 5b), which is the condition expected to produce an AB. In contrast, σ neither was affected by SOA, F(1, 15) = 0.02, p = .88, nor exhibited an interaction between SOA and T2
Downloaded from pss.sagepub.com at Harvard Libraries on June 7, 2014
Asplund et al.
6
a
T1 Report Probability
b
T2T1 Report Probability (Pe)
c
T2T1 Report Precision (σ)
100-ms T2 200-ms T2
1.0
1.0 0.9
0.8 0.7 0.6 0.5
45
0.8
σ (°)
p(Correct Report)
p(Correct Report)
0.9
50
0.7
35
0.6
200
800
0.5
40
200
SOA (ms)
800
SOA (ms)
30
200
800
SOA (ms)
Fig. 5. Results for the face attentional blink task (Experiment 2): (a) probability of correct report of the first target (T1) as a function of stimulus onset asynchrony (SOA) between T1 and the second target (T2), (b) probability of T2 encoding (Pe) as a function of SOA, and (c) precision of T2 encoding (σ) as a function of SOA. Note that lower σ (standard deviation of report error) values correspond to better precision. In each graph, results are shown separately for trials on which T2 was presented for 100 ms and trials on which T2 was presented for 200 ms. The results for T2 were calculated using data only from those trials in which T1 was reported correctly (T2|T1). Error bars represent standard errors of the mean.
duration, F(1, 15) = 0.70, p = .41 (Fig. 5c). This parameter was, however, strongly modulated by T2 duration, F(1, 15) = 11.11, p = .005, which indicates that the mixturemodeling analysis was sensitive to the precision at which a stimulus was encoded; doubling T2 duration should allow more information to be extracted and yield a more veridical face representation (Todd et al., 2011). As in Experiment 1, the strength of evidence for the key null effects was supported by Bayes factor analysis (see Supplementary Analysis: Bayes Factors in the Supplemental Material). Consistent with the results from Experiment 1, these findings suggest that the deficit in conscious target perception resulted solely from a change in the probability of encoding targets rather than from a modulation of the precision of target representations.
Discussion and Conclusions Across both stimulus classes (colors and faces) and experimental designs (RSVP and skeletal), we found that the reported precision of a target item is not affected in the AB, even though our paradigms had the sensitivity to detect such effects. Moreover, when we fit the data with an alternative variable-precision model that assumes that guesses are targets encoded at very low precision (van den Berg, Shin, Chou, George, & Ma, 2012; see also Fougnie, Suchow, & Alvarez, 2012), we found that our original model with distinct guess and precision parameters better accounted for the data (see Supplementary
Analysis: Variable Precision Model in the Supplemental Material). Finally, whereas precision judgments were made on the basis of consciously reported targets, guesses were not (see Supplementary Experiment 5 in the Supplemental Material). Although we cannot exclude the possibility that nonreported targets reached awareness but were immediately forgotten, together our results clearly support the hypothesis that conscious perception, at least at central stages of information processing, is allor-none (Dehaene et al., 2006; Sergent & Dehaene, 2004). Given that the AB results from the costs of attentional deployment to T1 (Supplementary Experiment 4; Dux & Marois, 2009), our findings also indicate that attention modulates the probability of a quantal episode of conscious perception. This account, however, does not rule out qualitative attentional effects at earlier stages of visual information processing (e.g., perceived contrast; Liu, Abrams, & Carrasco, 2009; Reynolds & Chelazzi, 2004). Instead, it suggests that under conditions in which stimuli compete for representation at postperceptual stages of information processing, attention regulates the probability of all-or-none conscious representations of taskrelevant events without affecting the precision of these representations. Author Contributions R. Marois developed the study concept. R. Marois, C. L. Asplund, and D. Fougnie contributed to the study design. C. L. Asplund, D. Fougnie, S. Zughni, and J. W. Martin collected data, and C. L. Asplund, D. Fougnie, and S. Zughni analyzed data. R. Marois
Downloaded from pss.sagepub.com at Harvard Libraries on June 7, 2014
Attentional Blink Reveals Discrete Conscious Perception 7 and C. L. Asplund drafted the manuscript, and all authors contributed to, and approved, the final version.
Acknowledgments We thank Ellie Conser for experimental assistance.
Declaration of Conflicting Interests The authors declared that they had no conflicts of interest with respect to their authorship or the publication of this article.
Funding This work was supported by National Institute of Mental Health Grant RO1 MH70776 to R. Marois and by National Eye Institute Grant P30-EY008126 to the Vanderbilt Vision Research Center.
Supplemental Material Additional supporting information may be found at http://pss .sagepub.com/content/by/supplemental-data
Note 1. Vanderbilt’s institutional review board approved the protocol for all experiments.
References Anderson, D. E., & Awh, E. (2012). The plateau in mnemonic resolution across large set sizes indicates discrete resource limits in visual working memory. Attention, Perception, & Psychophysics, 74, 891–910. doi:10.3758/s13414-012-0292-1 Baars, B. J. (2005). Global workspace theory of consciousness: Toward a cognitive neuroscience of human experience. Progress in Brain Research, 150, 45–53. Bar, M., Tootell, R. B., Schacter, D. L., Greve, D. N., Fischl, B., Mendola, J. D., . . . Dale, A. M. (2001). Cortical mechanisms specific to explicit visual object recognition. Neuron, 29, 529–535. Bays, P. M., Catalao, R. F. G., & Husain, M. (2009). The precision of visual working memory is set by allocation of a shared resource. Journal of Vision, 9(10), Article 7. Retrieved from http://www.journalofvision.org/content/9/10/7.full Chun, M. M., & Potter, M. C. (1995). A two-stage model for multiple target detection in rapid serial visual presentation. Journal of Experimental Psychology: Human Perception and Performance, 21, 109–127. Clifford, C. W. G., Arabzadeh, E., & Harris, J. A. (2008). Getting technical about awareness. Trends in Cognitive Sciences, 12, 54–58. doi:10.1016/j.tics.2007.11.009 Curby, K. M., & Gauthier, I. (2007). A visual short-term memory advantage for faces. Psychonomic Bulletin & Review, 14, 620–628. Dehaene, S., Changeux, J. P., Naccache, L., Sackur, J., & Sergent, C. (2006). Conscious, preconscious, and subliminal processing: A testable taxonomy. Trends in Cognitive Sciences, 10, 204–211. Dux, P. E., & Marois, R. (2009). The attentional blink: A review of data and theory. Attention, Perception, & Psychophysics, 71, 1683–1700. doi:10.3758/APP.71.8.1683
Eng, H. Y., Chen, D., & Jiang, Y. (2005). Visual working memory for simple and complex visual stimuli. Psychonomic Bulletin & Review, 12, 1127–1133. Fougnie, D., Asplund, C. L., & Marois, R. (2010). What are the units of storage in visual working memory? Journal of Vision, 10(12), Article 27. Retrieved from http://www .journalofvision.org/content/10/12/27.full Fougnie, D., Suchow, J. W., & Alvarez, G. A. (2012). Variability in the quality of visual working memory. Nature Communications, 3, Article 1229. Retrieved from http://www.nature.com/ncomms/journal/v3/n11/full/ ncomms2237.html Hannula, D. E., Simons, D. J., & Cohen, N. J. (2005). Imaging implicit perception: Promise and pitfalls. Nature Reviews Neuroscience, 6, 247–255. Liu, T., Abrams, J., & Carrasco, M. (2009). Voluntary attention enhances contrast appearance. Psychological Science, 20, 354–362. doi:10.1111/j.1467-9280.2009.02300.x Nieuwenhuis, S., & de Kleijn, R. (2011). Consciousness of targets during the attentional blink: A gradual or all-or-none dimension? Attention, Perception, & Psychophysics, 73, 364–373. doi:10.3758/s13414-010-0026-1 Nieuwenstein, M., Van der Burg, E., Theeuwes, J., Wyble, B., & Potter, M. (2009). Temporal constraints on conscious vision: On the ubiquitous nature of the attentional blink. Journal of Vision, 9(9), Article 18. Retrieved from http:// www.journalofvision.org/content/9/9/18.full Overgaard, M., Rote, J., Mouridsen, K., & Ramsøy, T. Z. (2006). Is conscious perception gradual or dichotomous? A comparison of report methodologies during a visual task. Consciousness and Cognition, 15, 700–708. Quiroga, R. Q., Mukamel, R., Isham, E. A., Malach, R., & Fried, I. (2008). Human single-neuron responses at the threshold of conscious recognition. Proceedings of the National Academy of Sciences, USA, 105, 3599–3604. doi:10.1073/ pnas.0707043105 Raymond, J. E., Shapiro, K. L., & Arnell, K. M. (1992). Temporary suppression of visual processing in an RSVP task: An attentional blink? Journal of Experimental Psychology: Human Perception and Performance, 18, 849–860. Reeves, A., & Sperling, G. (1986). Attention gating in short-term visual memory. Psychological Review, 93, 180–206. Reynolds, J. H., & Chelazzi, L. (2004). Attentional modulation of visual processing. Annual Review of Neuroscience, 27, 611–647. Sergent, C., & Dehaene, S. (2004). Is consciousness a gradual phenomenon? Evidence for an all-or-none bifurcation during the attentional blink. Psychological Science, 15, 720– 728. Seth, A. K., Dienes, Z., Cleeremans, A., Overgaard, M., & Pessoa, L. (2008). Measuring consciousness: Relating behavioural and neurophysiological approaches. Trends in Cognitive Sciences, 12, 314–321. Todd, J. J., Han, S. W., Harrison, S., & Marois, R. (2011). The neural correlates of visual working memory encoding: A time-resolved fMRI study. Neuropsychologia, 49, 1527– 1536. doi:10.1016/j.neuropsychologia.2011.01.040 van den Berg, R., Shin, H., Chou, W. C., George, R., & Ma, W. J. (2012). Variability in encoding precision accounts for visual
Downloaded from pss.sagepub.com at Harvard Libraries on June 7, 2014
Asplund et al.
8 short-term memory limitations. Proceedings of the National Academy of Sciences, USA, 109, 8780–8785. Visser, T. A., Zuvic, S. M., Bischof, W. F., & Di Lollo, V. (1999). The attentional blink with targets in different spatial locations. Psychonomic Bulletin & Review, 6, 432–436. Vogel, E. K., Woodman, G. F., & Luck, S. J. (2006). The time course of consolidation in visual working memory. Journal of Experimental Psychology: Human Perception and Performance, 32, 1436–1451.
Vul, E., Hanus, D., & Kanwisher, N. (2009). Attention as inference: Selection is probabilistic; responses are all-or-none samples. Journal of Experimental Psychology: General, 138, 546–560. doi:10.1037/a0017352 Ward, R., Duncan, J., & Shapiro, K. (1996). The slow timecourse of visual attention. Cognitive Psychology, 30, 79–109. Zhang, W., & Luck, S. J. (2008). Discrete fixed-resolution representations in visual working memory. Nature, 453, 233–235.
Downloaded from pss.sagepub.com at Harvard Libraries on June 7, 2014