Public Health Community Mining in YouTube Scott Burton, Richard Morris, Michael Dimond, Joshua Hansen, Christophe Giraud-Carrier Department of Computer Science Brigham Young University, Provo, UT 84602
{sburton, rmorris}@byu.edu, {dimondm, hansen.joshuaa}@gmail.com,
[email protected] ABSTRACT YouTube has become a vast repository of not only video content, but also of rich information about the reactions of viewers and relationships among users. This meta-data offers novel ways for public health researchers to increase their understanding of, and ultimately to more effectively shape, people’s attitudes and behaviors as both consumers and producers of health. We illustrate some of the possibilities here by showing how communities of videos, authors, subscribers and commenters can be extracted and analyzed. Tobacco use serves as a case study throughout.
Categories and Subject Descriptors H.4 [Information Systems Applications]: Miscellaneous; J.3 [Life and Medical Sciences]: Health
General Terms Algorithms, Experimentation
Keywords Community Mining, Public Health, YouTube
1.
INTRODUCTION
One of the difficulties of research in public health is determining —and ultimately influencing— the perception and reaction of the public with regard to health-related issues. Typical approaches, such as questionnaires (e.g., NHANES, HINTS), can be difficult and costly to administer. Furthermore, processing results and preparing them for analysis are tedious activities that cause studies based on questionnaires to be delayed and thus to lag behind important, relevant, and detectable, social media health communications, which arise spontaneously and much faster. Social networking websites, such as Facebook, MySpace, Twitter and YouTube, contain vast amounts of content that
Permission to make digital or hard copies of all or part of this work for personal or classroom use is granted without fee provided that copies are not made or distributed for profit or commercial advantage and that copies bear this notice and the full citation on the first page. To copy otherwise, to republish, to post on servers or to redistribute to lists, requires prior specific permission and/or a fee. IHI’12, January 28–30, 2012, Miami, Florida, USA. Copyright 2012 ACM 978-1-4503-0781-9/12/01 ...$10.00.
Joshua West, Carl Hanson, Michael Barnes Department of Health Science Brigham Young University, Provo, UT 84602
{joshua.west, carl_hanson, michael_barnes}@byu.edu
is constantly being updated by the public as a whole. One of the great advantages this offers is the ability to observe, in a timely manner, the attitudes and behaviors of people in their natural interactions with others. There has thus naturally been a growing focus on the importance of online social media in public health research [7, 31]. Recent studies have, for example, shown that online social interactions may carry enough positive peer pressure to encourage healthy behavior [22]. It has also been found that, while in some cases anonymity may promote increased antagonism [20], adolescents generally feel more comfortable discussing potentially embarrassing topics with some degree of anonymity, as afforded by social media [12, 30]. For public health practitioners, social media offer yet another significant advantage in that the interactive nature of Web 2.0 applications facilitates not only observations, but more importantly intervention, such as through tweets or chats [9]. In this paper, we focus our attention on YouTube. With the ability to easily post, view, and comment on videos, YouTube allows the ideas of a single user to be seen by millions in a matter of days. In addition to the obvious video content, YouTube is also a repository of rich meta-data giving relationships among related videos, users, and comments. Indeed, while it was designed primarily as a videosharing platform, each entry or submission to YouTube goes far beyond the video content and author’s name alone, to include such things as a list of author-defined tags or keywords to describe the video, a list of subscribers (i.e., people who “follow” the video’s author), comments left by viewers, ratings left by users (now simplified to like or dislike), statistics collected by YouTube, such as number of views and viewing history, and a ranked list of links to 20 related videos, as determined by YouTube’s proprietary algorithm based on viewers’ clickstream data, recency, etc. Unlike some who have argued that medical research based on statistics from YouTube may lend false credence to a “conduit of popular culture” [13], we believe that YouTube remains a valuable medium both for observing and for interacting with the public. Additionally, it has been noted that health topics are already being discussed in social networks, and in many cases the associated communications are dominated by businesses that have vested commercial interests [31]. It would seem not only reasonable, but in fact desirable, for the public health community to take advantage of YouTube, and other social media, to ensure that accurate, constructive and health-promoting viewpoints are widely represented and adequately expressed.
While much of what is presented here extends in principle to other social media platforms, there are several features of YouTube that make it particularly well suited to our applications. In particular, 1) YouTube is an open forum, 2) YouTube’s data is rich in natural relationships among its elements (e.g., friends, comments, related videos), and 3) YouTube possesses a rich application programming interface (API) that makes almost all of its data available for easy consumption by data mining tools. We take advantage of these features here and show how social network analysis tools can be used to build and analyze communities of videos, authors and comments from YouTube’s rich data. We give examples of the value of these communities with regard to public health, with specific emphasis on tobacco usage as a relevant case study.
2.
RELATED WORK
There is certainly no way for us to be exhaustive here about work in social network analysis or the use of social media in public health. However, we highlight several pieces of work most relevant to our own in the context of YouTube and community mining. The increase of YouTube’s popularity and the accessibility of its audio/visual material, textual comments, and friendships, is leading public health researchers to leverage this oracle to public perception and interaction. Most of the studies so far have focused exclusively on the content or message of videos returned by certain keywords. For example, videos have been examined for their potential role in implicitly influencing normative beliefs formation or for their explicit attempts at eliciting positive or negative sentiment in areas as varied as vaccinations/immunizations [16], recreational partial asphyxiation (i.e., the choking game) [21], and tanning beds [14], with a significant body of studies specifically targeted at smoking behavior [1, 11, 10, 27, 18]. Our research goes beyond content. It is interested in how videos and authors are connected to each other, and how such networks can inform our understanding of health issues. While others have studied structural properties of YouTube as a general social network (e.g., see [28, 29]), our work focuses on the unique notion of community. Indeed, social networks differ from other types of networks, such as technological or computer networks, in many ways that can be traced to the fact that they are inherently composed of communities [26]. Understanding these communities with regard to health concerns can lead to valuable research insights, yet discovering these communities within the context of YouTube is a non-trivial computational problem. At least part of the difficulty arises from the fact that many community mining algorithms depend on a complete enumeration of the network [5, 17, 24, 32, 25, 33]. Yet, YouTube does not make available a complete list of its videos, and even if it did that list would be much too large for its enumeration to be computationally feasible. Recently, new algorithms have begun to emerge that perform community discovery through a controlled iterative process [4]. We follow and extend this latter approach to community building here.
3.
YOUTUBE COMMUNITIES
One approach to defining a social network from YouTube data is to 1) consider videos as nodes, and 2) use the related video list provided by YouTube to define the edges of
the graph [6]. An alternative method still views the videos as nodes, but defines the edges based on “video responses” posted by users in response to an original video [2]. Once a social network of videos is defined, a social network of the users that authored those videos can also be derived rather straightforwardly [2]. We capitalize on the richness of implicit relationships embedded in YouTube’s data to build on these ideas. Indeed, while YouTube is essentially an extensive network of videos, the additional information available in tags, friends’ lists, subscribers’ lists, and comment trails can be used to build various focused communities of videos, authors and commenters relevant to public health research. In what follows, we present a basic analysis of several of these communities and illustrate their value in the context of tobacco usage.
3.1
Video Communities
As stated above, YouTube does not make available a complete list of its videos, and even if it did, that list would be unmanageable due to its sheer size. Hence, it is not possible to use most community building algorithms, which require a knowledge of the complete social network. Instead, an iterative approach to building communities must be employed, beginning with one or more (seed) videos and expanding from that point. A mechanism for this iterative expansion consists in exploiting the set of related videos provided by YouTube alongside each video, and also available through the public API. While the details of the algorithm used by YouTube to produce the set of related videos are proprietary, the related videos are a valuable resource for understanding behavior in that they represent what users see and click on when navigating the site. We describe two complementary ways of building communities of videos. The first tries to capture the general behavior of viewers. The second is more directed and focuses the community on a specific topic.
3.1.1
Breadth-first Search
Perhaps the simplest way of iteratively producing a community of videos is to begin with a specific seed video and to proceed with a breadth-first search of related videos. Breadth-first search consists of going from the seed video to its related videos, followed by their related videos, and so on, until all videos have been visited or a certain number of iterations has been reached, as detailed in Algorithm 1 [19]. Algorithm 1 Breadth-first Search Require: An initial video v0 , and for each video v, a set of related videos defined by v.relatedV ideos() Ensure: The set C contains the community Initialize set C and queue Q to be empty Q.enqueue(v0 ) repeat v ← Q.dequeue() C.add(v) for all related videos r in v.relatedV ideos() do Q.enqueue(r) end for until Q is empty or terminating condition reached return C Because there are 20 related videos provided by YouTube
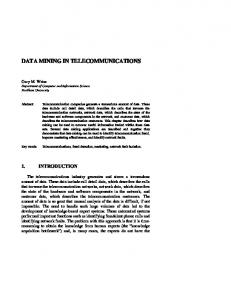
for each video, the size of communities discovered using this technique would grow very quickly, on the order of O(20d ), where d is the depth or number of iterations performed. An alternative in such contexts is to constrain the breadth-first search to a beam search [34], where, for each video considered, only the first b most related videos, as per YouTube’s rankings, are added to the queue. The size of the community now only grows on the order of O(bd ). If b = 20, the result of the beam search is identical to the result of the traditional breadth-first search. As an example, Figure 1 shows the community of videos discovered around an anti-smoking seed video using a beam search with beam size b = 5, run to a depth of d = 3 from the initial video. Table 1 shows a subset of the titles of these videos. For the sake of space, only the first four titles are included for depths 2 and 3. 82
85
92
91 83
84 22
86
93 24
80 79
95
89
6
21
41
94 77
48 69 70
66
68
67
15
4 16 17
63 64
3
57
18
60
62 61 65
7
27
19
12
42
40
26
71
49
13
20 55 54
52
51
58
50
39
74
5 14
38
10
2
1
28 31
8
11
45
32
30
46
43
23 25
29
33 9
47
90
36 34
37
44 88
87
78 81
35
Table 1: Subset of Titles of the Beam Searchgenerated Community of Anti-smoking Videos Video Depth Title 1 0 Tobacco Free Florida: Kid Tossing Ball 2 1 Tobacco Free Florida: Kid Tossing Ball (CC) 1 Tobacco Free Florida: Mirror 3 4 1 Tobacco Free Florida: 31 Flavors 1 Tobacco Free Florida: Buckle Up (en 5 Espanol) 6 1 The Sexiest Commercial Ever. 2 Tobacco Free Florida: Buckle Up 7 8 2 Grey Poupon Original Commercial 9 2 Bounty Paper Towel Ads with Captions 2 Gray Bright, Jack In The Box Taco Ad10 venture (from Sydney Australia to Los Angeles USA for Taco’s) ... ... ... 26 3 Tobacco Free Florida: Video Game (en Espanol) 3 Tobacco Free Florida: Light It Up 27 28 3 Wayne’s World - Grey Poupon (Parody) 3 Grey Poupon “Son Of Rolls” 30 Sec 29 Commercial ... ... ...
75 76 72
73
56
53
59
Figure 1: Beam Search-generated Community of Anti-smoking Videos (b = 5, d = 3) As may be expected, many of the videos in this community, even a small number of links away from the starting video, are about very different topics. Specifically, many of the videos at a distance of three and four steps from the first video are not about smoking behavior at all, but rather focus on humorous or sexual content (top left-hand side of Figure 1). A reasonable way to assess the likely subject matter of these videos is to observe keywords in the titles. After surveying the titles, we noted that a large subset of the videos could be identified as very likely to focus on smoking behavior or sexual appeal based on a few specific keywords. We recognize that there are clearly some tobacco and many sexual related videos that do not contain these specific keywords, but using them gives an objective way of summarizing the list of titles and illustrating the point. As shown in Table 2, this community of 363 unique videos has only 73 whose titles contain the smoking-related words “tobacco,” “smoke,” or “smoking,” whereas 65 contain the sex-related words “hot,”“sex,”“ass,” or “Megan Fox.” It is interesting to note that such findings would be difficult, if not impossible, to bring out without building communities. One valuable insight gained from this finding is that if a user is navigating through content using the related videos
Table 2: Statistics on the Titles of the Beam Searchgenerated Community of Anti-smoking Videos Depth Unique Videos Smoking-related Sex-related 0 1 1 0 5 4 1 1 2 19 9 5 70 18 17 3 4 268 41 42 Total 363 73 65
links, even if they start watching an anti-smoking video, it is very likely that they will end up viewing content with sexual or humorous appeal, rather than continuing to view multiple anti-smoking productions. From a public health standpoint, there are several follow-up questions one may consider: 1. Is the current observation representative of a more general human behavior? In other words, is it true that whatever the first video is (i.e., whatever the reason a user was drawn to a specific video on YouTube), users quickly (i.e., 2 or 3 hops) drift away to gravitate around videos with sexual content? 2. As far as conveying health-promoting messages is concerned, should content be packed into the first videos users are most likely to watch? 3. If viewers do indeed tend to be distracted by other content, is it possible to design health-related videos that are more likely to cause viewers to stick with the topic? How? Answers to these questions, and other related ones, would help the preventive and intervention efforts of public health practitioners within social media.
3.1.2
Multiple Sub-community Expansion
As shown, a breadth-first search or even a beam search using the related videos provided by YouTube quickly diverges to many different topics. While this discloses possibly interesting aspects of human behavior, alternative methods must be employed to discover communities of videos that are more interrelated and therefore closer to the same topic. Chen et al. recently introduced Iterative Local Expansion (ILE), a community discovery process designed for iterative expansion in large networks [4]. The first part of this process is a local community identification algorithm, which attempts to identify communities with a “sharp” boundary to the rest of the network. A community is considered in two parts: 1) nodes in the core, which only link to other nodes in the community; and 2) nodes on the boundary which link to other nodes in the community but also to those outside the community. The local modularity factor R is used to evaluate the quality of a community [8]. It is specified in terms in , where of the boundary nodes and is defined as R = BBtotal Bin represents the number of links from the boundary nodes that stay inside the community and Btotal is the total number of links from the boundary nodes. The local community identification algorithm begins with a single node and adds nodes to the community in a greedy fashion in order of most improvement to R, until R can no longer be increased. ILE can, of course, be applied to videos on YouTube by using the set of related videos to define the nodes to which a particular video links. One of the limitations of this approach however is that, while a small set of videos (typically between 10 and 30) is discovered that are related around a certain topic, the topic may not be the exact one desired. For example, beginning with an anti-smoking commercial featuring a superhero, a community may be discovered that is focused on tobacco, or alternatively a superhero related community may be brought out. As an illustration, we have run ILE starting with ten different anti-smoking videos, and observed that in many instances the communities are, in fact, closely centered on tobacco, but in many instances the communities tend to focus closely on other topics, as summarized in Table 3. As above, tobacco-related videos are designated by titles containing the keywords “tobacco,” “smoke,” or “smoking.”1
Table 3: Tobacco Relatedness of ILE-generated Communities of Videos Community Videos Smoking-related Percent 1 18 4 22.2 2 16 2 12.5 3 33 4 12.1 4 9 0 0.0 5 17 1 5.9 6 12 1 8.3 7 11 9 81.8 8 13 12 92.3 9 29 1 3.4 10 30 27 90.0 Total 188 61 32.4 1 We have found that even running ILE with the same starting anti-smoking commercial in successive weeks can result in rather different behaviors because the greedy algorithm is highly influenced by the selection of the first few nodes.
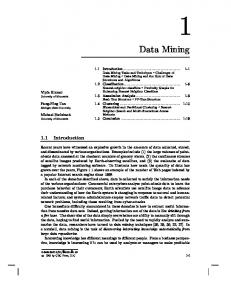
Chen et al. do suggest that their algorithm could be applied iteratively to eventually build communities covering the whole graph, by selecting random starting nodes from those not in a community [4]. These potential starting nodes consist of those linked to by a boundary node, but outside a community, and are referred to as the shell of the community. This random selection approach would result in assigning additional videos to communities, but as with a beam search, it would quickly diverge to more diverse topics. If we consider each of these communities as a sub-community of a larger set of videos related to the desired topic, this iterative process could be used to identify additional starting nodes and subsequently additional sub-communities. However, to discover additional sub-communities about the same overall topic, the selection process must be guided. We propose an extension to ILE, called Multiple Subcommunity Expansion (MSCE), that implements an alternative selection process to identify starting videos that are more closely related to the original topic, composed of two components. First, each node in the shell set S is given a community link score L of the number of unique subcommunities that link to the node. On the first iteration, this will result in a score of L = 1 for each node in S because they are each linked to by the single existing sub-community. On subsequent iterations, when more sub-communities have been identified, videos that are linked to by more than one sub-community will receive higher L scores. The second component consists of a keyword score K. These keywords are related to the overall topic and are supplied by the user at the beginning of the process. The K score of a video is determined by the number of keywords contained in that video’s title. Using these two components, an overall expansion selection score E can be determined as the weighted sum of these, i.e., E = L + αK, where α denotes a constant that can be defined to indicate the importance of keyword score. The node with the highest E score is then selected as the starting node for the next community. Details of MSCE are shown in Algorithm 2. One of the benefits of MSCE is that even when the first sub-community is not as related to the central topic, subsequent sub-communities are likely to return back to the desired topic. For example, Figure 2 shows the composite community that is the set of ten sub-communities discovered by MSCE, using the single keyword “smoking,” and beginning with the same single seed video used for our earlier beam search (“Tobacco Free Florida: Kid Tossing Ball”). In this case, the first sub-community (highlighted by the rectangular region on the top right part of the figure) contains some anti-smoking videos featuring superheroes, which results in also including several videos that are solely about superheroes. Despite the fact that this sub-community is not completely focused on smoking, subsequent sub-communities are much more focused on the topic, as shown in Table 4. Note that because sub-communities can overlap, the total values are computed with regard to the total number of unique videos, not as sums of the corresponding columns. While the first sub-community consists of only 22.2% (4/18) videos containing the words “tobacco,” “smoke,” and “smoking,” when considering all ten sub-communities, 84.4% (157/186) of unique videos contain these words. To further demonstrate the robustness of the MSCE algorithm in finding subsequent sub-communities that return to the desired topic, we have run the algorithm for ten it-
C D
Algorithm 2 Multiple Sub-community Expansion Require: An initial video v0 , a set of keywords, and a weight parameter α Ensure: The set C contains a set of sub-communities
18 17
13
14
8
15
16
11 12
10
5 7
Initialize Set C to be empty Let s = v0 repeat Run ILE starting with s to produce sub-community Ci and shell set S C.add(Ci ) for all videos v in S do Let L = 0 and K = 0 for all sub-communities c in C do if v is connected to any nodes in c then L=L+1 end if end for for all keywords key in keywords set do if v.title contains key then K =K +1 end if end for Let E = L + αK end for s = arg maxv E until S is empty or terminating conditions reached return C
4 6
3
121 119
120 129
126
2
123
130
115
62
125 74
64
128
73
75
113
144
56
59
51
52
53
54
71
139
136
132
55
66
50
58
68
141
118
61 60
117
110
76
77
124
127
72
57 112
79
138
133
137
140
111
63
135
142
70
82
78 81 83 84
114
116
86
96
134
107
65
85
94
87
95
88 93
90
92
109
97
98
108
20
99
147
152
106
100 153
181
102
101
160
104
156
158
19
145
151
150
155
131
89
91
A
143
1
67
69
80
154
103
105
162
149
146
161 166
148
163
157
44
22
159
B
40
34 48
30
25 29
35 183
178
170
182
173
171
169
167 179
165
36
24
38
26
177
33
168
172
186
41
27
32
47 45
42 180
31 46
39
23
185
176
28
21
184
164
175
174
erations (i.e., building a community composed of ten subcommunities) beginning with each of the anti-smoking commercials used above. Thus, where before we built a single whole community for each of these videos (as shown in Table 3), we now build a composite community (made up of ten sub-communities) for each of the ten anti-smoking videos. Table 5 shows statistics regarding these ten communities. Even when the first sub-community (as shown in Table 3) was not on topic, the subsequent nine sub-communities included in the final composite community bring the overall community back on topic (as shown in Table 5). The percentage of smoking-related videos in the first sub-community compared to the percentage for the entire community, for each of the ten videos, are depicted in Figure 3. These results show that on average the percentage of smoking-related videos increases significantly from 32.4% to 69.4%, when including the additional nine sub-communities. This suggests that MSCE can be successful at returning to the desired topic even when the initial community was further away. Additionally, we observe that videos that are more archetypical of the topic and focus solely on the message rather than including other themes or personalities from popular culture are more likely to remain centered on the original topic. However, even in these cases the keyword component of MSCE is able to guide some of the subsequent subcommunities back toward the topic. This is demonstrated with regard to videos 4, 5, and 6, where, as shown in Table 3, the first sub-communities for each had as little as 0%, 5.9%, and 8.3% of the videos containing the smoking-related words in the title, but after iterating to ten sub-communities, the percentage of smoking-related videos in the corresponding final communities had risen to 69.0%, 49.1%, and 58.6%, respectively. Interestingly, the communities built from videos
9
122
37 43 49
Figure 2: MSCE-generated Community of Antismoking Videos in 10 Sub-communities 8 and 10 experienced a reduction in the percentage of videos on the topic (from 92.3% to 71.2% and 90.0% to 69.8%, respectively), where in each case the expansion included subcommunities that focused more on humorous commercials rather than strictly tobacco centered ones. From the point of view of public heath practitioners, discovering a community of related videos using MSCE may prove useful in at least a couple of important ways. 1. As discussed later, obtaining a community of videos is the first step in many other types of analysis, such as considering the relatedness of the authors or commenters of videos. In addition, insight can be gained by examining the community of videos directly. For example, nodes with a very high degree are likely to be very central to the topic and could represent those with higher social capital among the set. Nodes that are bridges between different sub-communities are interesting because they represent a clickstream that a user may follow to transition between topics. For example, a video that bridges a sub-community of antismoking commercials and unrelated humorous commercials could represent the point a which a user stops consuming the health related content. in Figure 2, node A has a very high degree which is the video “Graphic Australian Anti-Smoking Ad” that has been viewed 2.5 million times and is very central to the topic
Table 5: Tobacco Relatedness of MSCE-generated Communities for Ten Different Anti-smoking Videos Community Videos Smoking-related Percent 1 186 157 84.4 2 163 144 88.3 3 165 87 52.7 4 145 100 69.0 161 79 49.1 5 145 85 58.6 6 7 111 100 90.1 8 139 99 71.2 161 104 64.6 9 10 149 104 69.8 Total 1525 1059 69.4
of anti-smoking commercials. Also, node B, entitled “How to quit smoking,” has high degree and is the bridge between three sub-communities focusing specifically on “the effects of smoking,”“do you still want to smoke,” and “how to quit smoking.” Nodes C (“Star Wars Anti Smoking Ad”) and D (“Anti-Smoking : Superman Versus Nick O’Teen (1981)”) are examples of bridge videos that are about tobacco, but could also represent a clickstream taking a user to more superhero or movie related videos than health ones. 2. MCSE could be used as an alternative sampling method for other studies. Almost all previous public health work involving YouTube has the researchers choose a set of keywords to search through YouTube’s website and using the resultant videos as the sample for their work [1, 11, 14, 16]. While this approach has a higher chance of returning videos that are well on topic, it also presents a number of drawbacks. In particular, finding adequate keywords is notoriously difficult,2 and in the case of YouTube (as many other online search systems) the number of results returned per query is limited to 1,000. Alternatively, the MSCE approach can retrieve any number of videos. Another interesting aspect of building a sample based on MSCE is that it more closely matches actual user activity. Research 2
Ambiguous words, mismatch between practitioners’ vocabulary (e.g., smoking cessation) and layman’s terms (e.g., quit smoking), etc.
First Sub-community All Sub-communities
100 Percent Smoking Related
Table 4: Tobacco Relatedness of MSCE-generated Sub-communities for a Single Anti-smoking Video Community Sub-community Videos Smoking-related Percent 1 18 4 22.2 2 31 29 93.5 15 14 93.3 3 4 33 32 97.0 24 23 95.8 5 6 35 29 83.0 7 16 15 94.8 15 12 80.0 8 9 22 21 95.5 10 15 13 86.7 Total (unique) 186 157 84.4
80
60
40
20
0 1
2
3
4
5 6 Community
7
8
9
10
Figure 3: Percentage of Smoking-related Videos in the First Sub-community vs. in the Complete Composite Community for Ten MSCE Communities has shown that users rarely look beyond the first few pages of results: 41% are reported as continuing their search by changing keywords when the desired content is not found on the first page of results and 88% as changing their keywords when they do not find it on the first three pages [15]. Thus, performing analysis on over 900 videos retrieved from a search does not match user behavior. Our own intuition and experience suggests that users often hop from one video to the next by way of the related video links.
3.2
User Communities
While YouTube is well-known for its video content, users are also at the heart of YouTube. Users are part of a larger community of friends, subscribers, subscriptions, videos, and authors. Models of these communities offer researchers ways to identify important authors and their characteristics, influential videos, and interesting users. YouTube also acts, in some fashion, as a social networking service, allowing users to identify other users as friends, subscribe to authors, personalize a page with user info and videos posted by the user, and exchange messages with other users.
3.2.1
Author-Friend Community
An author-friend community is an example of the communities that can be built based on the YouTube users. This community is built starting with a set of videos (such as those obtained using the community mining algorithm mentioned above) and identifying the author of each video in the set. Then each of the friends of these authors is identified, and a graph is built with each of these authors and their friends as nodes, and edges denoting the friendship relation between users. Anomalous users can be identified from this graph, such as those with an unusual number of friends or those who are friends with an unusual amount of other authors in the community. As an illustration, Figure 4 shows the author-friend community built from the authors of the same MSCE antismoking community discussed earlier, showing only those users who are friends of at least four authors in the set. Nodes corresponding to authors are shown in black, while nodes corresponding to friends are shown in white. The size of each node is proportional to its degree.
812 3241
6444
3534 748
11426
6312 5897
7988
768
6882
3055
7332 9149
9649
5989
4021
8967
539 13045 4579
1747
4162 879
14203
12247
8005
13187
6222
4406
3009
11582 11144
10280 3160 4157
11938
1326
8135
14027
14140 13030
14109
802
13071 10210
1470
1304
8262
9980
10754 11505
4928
13377
6789 3677
1383
1468 4380
3636 13913
5303
4237
901
12817
8638 12644
12533
2750
1295
10116 3978
3427
11773 4831
1161
3072 12903 1552 8819 2406
7570 13696
3999
940 5672
5479
13037
6667 6289
4827
11902
3315
10304
3231
9970
10716 1162 1276
6510
6971
7314
1563 12933
2606
10316 8985
4456
9760
2078
9915 11054
4569 84
5512
6786
2028 6528
10451
2944 1347 962 2532
5144 1888
1
11499 9381 1666
5774
6703
8251
4905
3551 11844
9894
11163
7646 6045 3596
6869 5063 10931
5442
7432
6074 10469
1483 11218
12912 12134 3322
10475
6567
10238
13823
10744
7450
12225
5439
4469 707 4056 10571 10601
9914
1942
941
3385
8704 6530 9311 1203 8896 7115 12143 6091 7436 8263 320 1089 8509
14210
7888 1261
3959
10797
10194
13262
5275
13056
7186 10820
3962
10848
6891
4588 3017
7292
2630
5778 11691
1981
2678
13384
8122
8318
778
11673
11547
5662
12107 2409 7261
6046
10546
11551
1672 2682
5151 3555 8778 177
13216
12748 7909
12877
11434
7042 6792 5024 10458 12172 11419 378712510 5316 7077 13091 588213878 10916
6307 1192
14048
9282
1592
10605
11635
603
13653
9164
6511
2328
8376
3031
5267 7410
2074
3781
13221
12769
3935
10767
3530 1443 282 12068
13981 7401
9206
3641
4236
7282
7123
8561 1660
3960
2720
654
11921 4535 13243
3.2.2 1678
Figure 4: Community of Authors and their Friends Figure 5 shows the distribution of number of authors per number of friends. Not surprisingly, the distribution follows a kind of power law with most authors having a small number of friends and few authors having a very large number of friends. The maximum number of friends for an author in this community is 6,249. Note that we did not distinguish between authors with 0 friends and authors who choose to keep their list of friends private, which may bias our results. 90 80 70
Authors
60 50 40 30 20 10 0 0
10
ure 4) are a health and beauty company, an online fitness company, and a documentary film maker. This may have interesting ramifications for governmental or non-profit public health producers, in that it may not be sufficient to simply produce content and upload it to YouTube. Authors likely need to become involved in the community so as to gain social capital, subsequently getting exposure to content. Such involvement can be built from the ground up, or it could take advantage of the novel understanding of the target community provided by the foregoing community mining approach. Indeed, rather than waiting to acquire the needed social capital, authors of public health videos may benefit from tying into established users with high social capital, getting them to upload and/or promote their content. Additionally, users who are friends but not authors in such communities and who have high degree, may be highlighted as the prime consumers of the community’s video content. These consumers, in turn, could be observed in terms of their susceptibility to or targeted with specific messages.
20 30 Total Friends
40
50
Figure 5: Number of Authors vs. Number of Friends The users of this author-friend community represent those who are likely to have some affinity toward the topic, because they have either authored a video on the topic themselves or are friends with at least four authors of videos on the topic. Nodes with a high degree could represent users of higher social capital who potentially have influence in this community. One of the reasons that some of the users in this graph have a high degree is that they try to become friends with many others in an attempt to increase their own exposure as advertising means. For example, the three users with the highest degree (appearing in the center of Fig-
Commenter Community
Another rich source of metadata in YouTube is found in the comments made by viewers on the videos. A commenter community can be discovered by, for example, identifying those users that leave comments on the same videos. Specifically, this commenter community is built by beginning with a set of videos and identifying all users that have made comments on each one.3 Then, a link is made between users that commented on the same videos, where the strength of the link (or the weight of the edge) between two users is the number of videos in the sample on which both users commented. Additionally, thresholds can be used to indicate a link only if the users have commented on at least some number of common videos. This graph can also be restricted by considering users whose comments occur within a certain distance of each other in the list of comments. Due to the number of comments per video, the commenter community can quickly become difficult to visualize if the set of videos is large and the threshold parameters are set low. Figure 6 shows the community of commenters for the anti-smoking videos in Figure 2, restricted to users who commented on at least four common videos. The thickness of an edge is proportional to the number of common videos on which the adjacent users commented. Figure 7 gives the distribution of the number of comments made by users in this set, as well as the number of unique videos on which these users commented. Again, unsurprisingly so, the distribution follows a power law, with most commenters leaving only very few comments behind. It should be noted that commenter communities do not imply that users feel the same way about an issue, but rather that they are both interested in the issue, and may in reality have opposite views on the topic. The two nodes from Figure 6 with the highest degree are both users promoting their own stop smoking programs, leaving almost identical comments on many videos in the set, encouraging others to follow a profile link. Because these users left comments on so many videos in the set, they have an implicit relationship with a large amount of other commenters. 3 In the current API, YouTube returns a maximum of 1,000 comments per video. Even with this limitation valuable insights can be found, but this limitation should be considered when attempting to generalize from this data.
1912
20000
Total Comments Unique Videos Commented On
757 512
18000
824 1539 371
871
290
535
16000
1623
781 1645
862
14000
975
1758 1140
2109
766 576
1154
309
259 1132
102
1595
2019
1683
772
389
1927
1978
2013
1587 506
1062 1279 422
1386
1142
1750
1902
90
1048
295
1091
8000
994
1876
6000
35
1147
1184 470
858
584
2091
31
624 30
611
1648
1277
461
431
10000
2070
360
1870
2103
12000
708
1805
175 2113
490
Users
1733
1084
353
524
1520
316
2042
648
4000
68
2065
1309
1569
1443
1900
2176
1424
0
1047
0
1175
987 1502
1864
5
10 15 20 Total Comments or Unique Videos
25
30
1890
1406
2062
1873
1238
2000
49
150
623
1821 317
928
900
621
2100
683 1466
1489
122
54 1110
1555
747
439
2074
1407
1380
1155
Figure 7: Distribution of the Number of Unique Videos Commented on by Users
1127
838
1009
1225
142 944
1397
2214
415
1860 1379
589
16
1975 1194
321
368
837
1314
1240
1695
1880
609 33
2087
763
508 18
1628
1934
860
182
1777
1106
2043
212
629
1528
1514
369
1552
1598 970
736
334
1074
Figure 6: Community of Users Who Commented on at Least Four Common Videos in the Set of Antismoking Videos Another, more explicit commenter community can also be built by considering directed edges between users that direct comments at one another using the conventional “@username” syntax. Figure 8 shows the resulting community of commenters over the same set of videos as above. Links between users appear only when at least two directed comments have been made. The thickness of the links is proportional to the number of times users referenced each other. The central node in this figure with a disproportionately high degree is a spammer similar to those found in Figure 6. However, in this case, the user left multiple directed comments to others promoting a political and ideological agenda, which in many cases elicited antagonistic responses. Alternatively, the pairs of users with disproportionately high weight on the edges between them represent users that maintained long-lasting conversations with one another. Additionally, because the explicit commenter network is directed, users can be identified that have a high in-degree, representing those at whom many others direct comments. These users may have higher social capital in that they have attracted the attention of many others. In the case of this network of anti-smoking videos, the user with the highest in-degree made a single comment asking the question: “if smoking is so bad why isn’t it illegal?” This elicited the responses of over 30 other users.
3.2.3
Comment Trails
Finally, it is also possible to utilize video comments to
track the comments of a specific user through time to observe a type of path followed by the user. Because the current version of the YouTube API does not provide all the comments of a user, this information must be acquired by first identifying a set of videos and then considering all comments left on those videos. The set of comments can then be sorted by user and comment time, to show the trail of users through the set of videos.4 This type of user trail can be valuable in two ways. First it can help to further identify characteristics of a single user of interest. Second, and perhaps more importantly, it can help to show trends of what videos users are seeing and how they move through these. An obvious limitation in identifying the trails of users is that not all users leave comments, and those that do do not leave them on each video they watch. Despite this limitation, these trails may still be valuable in discovering overall trends and relationships among videos. Also, we submit that those that do leave comments are in many cases the ones with the most extreme views on either side of an issue. Depending on the topic being studied, this may actually be more valuable as a way of identifying those that are more interested or passionate about the issue. Using the same set of comments (for the community of anti-smoking videos) discussed above, we identify users’ trails. In the sample of 186 videos, the maximum number of unique videos commented on by a single commenter is 27. Table 6 shows the trail of a prototypical commenter through our community of anti-smoking videos as defined by the date/time the comments were authored. The author engaged in a conversation with other users on videos B and D resulting in returning to leave additional comments on that video. The fact that a user returns to the same video to continue a conversation may result in additional exposure to its content. Thus, there may be a correlation between highimpact videos and increased conversation in their respective comments, either because the video itself drew increased discussion, or because the increased conversation led to more exposure of the message.
4 This analysis is also subject to the limitation of only being able to consider the first 1,000 comments on a video.
540
520
596
270
585
78
493
699
556
206
697
154
295
590
183
98
531
501 557
635
665
412
659
341 59 158
362
331
620
598
642
673
437
446
294
144
303
496
124 82
100
127
643
678
55 118
601
649
725
110
225
552
97
259
401
240
650
487
334
578
729
163
353
89
374 397
20 317
173
343
102 41
126
480
679
348
24
79 677
356
211
31 370
696
591
199
382
407
513 372 613
619
272
176 35
671 170
365
492 449
535
193
589
164
408
7
99 508
713
615
707
136
133
171 51
191
624
558 442
318 500 398
339
53
111
157 13
523 116
68 138
319
298
583
286
42
415
159
23 47
310
390
735 243
470 313 137
466
302
662
405
380
587 740
184
311 734
393
81
149 499 85
205 112 155
428
62
432
737
139
207
710
651
167
655
715
485 120
524
153
214
518
195
38
545
316 271
232 250
276 716 514
680
743
534
409
436
96
693
70
546
567
559
700
74
599
65
371
360
30
338
692 623
152
283 300
236
430
162
84
267
168
747
726 640
416
445
281
34
105
333
60 188
19
50 748
363
711
260
21
441
113
462
355
11
458
454
130
542
221
438
83
638
322
217
433 335
227
197
141
727 626
93
17
724
604
379 151
565 691
622
66
756 686
239
431 263 324
395
608
498
327
336
101
417
676
473
258 385
287 95
180
332 720
425 37
223
156
200
32
634
147
114
588
367
56
345
394
719 474 708
306 562 706
196
27
284
529 525 516
129 143
528 627
359 248 621
134
384
610
741 297 328
67
563
36
274
296 44
614
230
574 273
252
687 320 595
228
460 106
564
220
683 177
358
282
459
732
503
424
701
607 208
28
399
57
29
618
201
400
172
751 609 373 33
479
69 644
484
253
337
375
434
202
539
301
349
689
491
178 660 307
145 216
182
15
262
344
268
629
165
667
269
504 233
632
704 381
364
386
483
148
561
463
555
321
377
636 510
754
467
560
533
391
387
128
234
212 648
586
119
91
265
663
582
244
472
745 140
26
573
502
315 342
290
251
742 548
447
293
122
451 352
278 325
142
312 166
744
421
674
435
361 426
448
73
682 543
481 245 645
229
92
681
469 161
410
52
87
631
181
606
703
443
653
75
43
568 630
16
453
175
519 541
633 346 695
723
658
288
455
600 661
187
58
160
255
292
739
76
752
198
507 488 550
419 261
222
135
125
547
575
22
314
18
291 256
209
497
46
544 654
581
603 486
378
733
666 571
396
509 526
242 12
628 566
482
235
249
506
576
537
517
402
14 204
103
108
4 299
690
471
39
357
511
672
350
718
605 215
584 115
25
123
477
347
714
461
489
9
304
709
646
702 189
330 246
538
40
616 569 6
323 77
257
45
444
104
664
515
612
247
279
532
440
429
305
755
186
572
657
721
3
675 456
238
647
413
340
684
48 190
241
668
254
121
94
439
185
420
1
452 64
63
738
210
5
132 376
392
150 224
580
422
194
602
369
203
213
88
411
308
107
146
530
117 597
174
109 478
427
750
49
131
406
366
80 72
728
551
494
277 712
61 54
475
652
219 418 554
641
90 8
685 553
10
617
512 730 71
351 522
639
404
577
465
86
457 611
280 549 592
527
329
749
383
414 2
579 593 694
570
192
403
464 289
698 637
753 326
656
179
468 746
218 226
505 476
237
389
450
169
354
670 266 521
275
731
309 594
736
495
231
705
368
688
The number of topics K is set to 10 to give a high-level sense of the themes dealt with in the corpus, and to simplify analysis. The topics discovered, represented by their most prominent words, are given in Table 7.
264
722 285 388
536 717
625
423
669
490
Figure 8: Community of Users Defined by the “@username” Syntax
Table 6: A User Comment Trail Sorted by Time Date/Time Video 06/02/10 10:39 AM A B 06/19/10 06:47 AM B 06/19/10 06:54 AM 06/19/10 07:03 AM C 06/19/10 07:07 AM C C 06/19/10 07:19 AM 06/19/10 07:28 AM D 07/17/10 05:48 PM E 07/17/10 05:49 PM E 08/03/10 08:32 AM B 09/08/10 12:32 PM D
3.3
Comment Communities
In addition to considering the users that made comments on videos, the text of the comments themselves can be valuable in discovering the views of content consumers. We turn to Latent Dirichlet Allocation (LDA) to exploit this text data and gauge the feeling, perception, and reaction of the public to the messages that are presented. LDA is a probabilistic model that, when applied to documents, hypothesizes that each document in a collection has been generated as a mixture of unobserved (latent) topics, where a topic is defined as a categorical distribution over words [3]. While not strictly the case, we can usefully regard the set of topics as a community of comments over the video community. As an illustration, we consider the text from video titles, descriptions, and comments in the set of 4, 407 videos gathered by breadth-first search (d = 3), starting from the video titled “Quit Smoking.” We assemble the title, description, and comment data as a corpus of documents consisting of one document for each video containing both its title and its description (if any), plus one document for each video comment. We use the popular MALLET implementation of LDA [23] to automatically discover topics in this corpus.
Table 7: Ten Topics Inferred on the “Quit Smoking” Videos and Comments # Weight Top Words 0 0.08614 scary videos ur die life dont read fake post press video ghost lol works comment love 1 0.13785 video lol youtube watch thumbs videos amir check xd love channel remember justin 2 0.17116 don people game real time lol make good car video fake guy batman man dont thing 3 0.02474 de la el es en se si lo por una los video mi le con xd di che tu 4 0.25734 people video love baby good life don time god sad feel im man make wow girl kid dont 5 0.10693 people god don world jesus life make religion human time truth things country good 6 0.08751 smoking smoke people cancer don weed quit dont good cigarettes years stop day bad 7 0.45418 lol funny f? s? f? xd people guy a? haha stupid im dont ur man dude gay 8 0.01 allah bu ha bir ve ne fap mart de wal ya da bean ama mr bi sen ben var 9 0.10818 movie love song great good film watch movies trailer awesome amazing watched music A clear “quit smoking” topic emerges—Topic 6. However, its weight is relatively small (0.08751) indicating that the discussion has diverged substantially from the topic of the starting video. A near-universal of topic modeling on YouTube comments is the presence of an expletives topic. In this case, Topic 7 combines expletives with other colloquial forms such as “lol”, “ur”, and “wtf”.
4.
CONCLUSIONS AND FUTURE WORK
We have illustrated ways in which community mining techniques may be applied to YouTube to inform public health practice. We recognize that we have only scratched the surface and that, while tobacco usage provides an intuitive case study, we have not here produced any significantly new knowledge in this area. However, we have showed the potential and highlighted a number of relevant follow up questions that the approach presented here brings to light naturally, and can help answer in more thorough and focused analyses.
5.
REFERENCES
[1] C. L. Backinger, A. M. Pilsner, E. M. Augustson, A. Frydl, T. Phillips, and J. Rowden. YouTube as a source of quitting smoking information. Tobacco Control, 20(2):119–122, 2011. [2] F. Benevenuto, F. Duarte, T. Rodrigues, V. Almeida, J. Almeida, and K. Ross. Understanding video
[3]
[4]
[5]
[6]
[7]
[8] [9]
[10]
[11]
[12]
[13]
[14]
[15] [16]
[17]
[18]
interactions in YouTube. In Proceeding of the 16th ACM International Conference on Multimedia, pages 761–764, 2008. D. M. Blei, A. Y. Ng, and M. I. Jordan. Latent dirichlet allocation. Journal of Machine Learning Research, 3:993–1022, March 2003. J. Chen, O. Za¨ıane, and R. Goebel. Detecting communities in large networks by iterative local expansion. In Proceedings of the International Conference on Computational Aspects of Social Networks, pages 105–112, 2009. J. Chen, O. Za¨ıane, and R. Goebel. Detecting communities in social networks using max-min modularity. In Proceedings of the 9th SIAM International Conference on Data Mining, pages 978–989. SIAM, 2009. X. Cheng, C. Dale, and J. Liu. Statistics and social network of YouTube videos. In Proceedings of the 16th International Workshop on Quality of Service, pages 229–238, 2008. D. Chiu, P. Ande, R. Coward, and A. Woywodt. The times they are a changin’—the internet and how it affects daily practice in nephrology. NDT Plus, 2(4):273, 2009. A. Clauset. Finding local community structure in networks. Physical Review E, 72(2):026132, 2005. R. Crutzen and J. De Nooijer. Intervening via chat: an opportunity for adolescents’ mental health promotion? Health Promotion International, 26(2):238–243, 2011. S. Forsyth and R. Malone. “I’ll be your cigarette—light me up and get on with it”: Examining smoking imagery on youtube. Nicotine & Tobacco Research, 12(8):810–816, 2010. B. Freeman and S. Chapman. Is “YouTube” telling or selling you something? tobacco content on the YouTube video-sharing website. Tobacco Control, 16(3):207, 2007. M. Gould, J. Munfakh, K. Lubell, M. Kleinman, and S. Parker. Seeking help from the internet during adolescence. Journal of the American Academy of Child & Adolescent Psychiatry, 41(10):1182–1189, 2002. A. Hayanga and H. Kaiser. Medical information on YouTube. Journal of the American Medical Association, 299(12):1424, 2008. E. Hossler and M. Conroy. YouTube as a source of information on tanning bed use. Archives of Dermatology, 144(10):1395–1396, 2008. iProspect.com. iProspect search engine user behavior. Technical report, iProspect.com, Inc., April 2006. J. Keelan, V. Pavri-Garcia, G. Tomlinson, and K. Wilson. YouTube as a source of information on immunization: a content analysis. Journal of the American Medical Association, 298(21):2482, 2007. R. Khorasgani, J. Chen, and O. Za¨ıane. Top leaders community detection approach in information networks. In Proceedings of the 4th Workshop on Social Network Mining and Analysis, 2010. K. Kim, H.-J. Paek, and J. Lynn. A content analysis of smoking fetish videos on YouTube: Regulatory
[19]
[20]
[21]
[22]
[23] [24]
[25]
[26]
[27]
[28]
[29]
[30]
[31]
[32]
[33]
[34]
implications for tobacco control. Health Communications, 25(2):97–106, 2010. D. Knuth. The Art of Computer Programming: Fundamental Algorithms (Vol. 1). Boston: Addison-Wesley, 3rd edition, 1997. P. Lange. Commenting on comments: Investigating responses to antagonism on YouTube. In Proceedings of the 70th Annual Conference of the Society for Applied Anthropology, page 2007, 2007. M. Linkletter, K. Gordon, and J. Dooley. The choking game and YouTube: A dangerous combination. Clinical Pediatrics, 49(3):274–279, 2009. X. Ma, G. Chen, and J. Xiao. Analysis of an online health social network. In Proceedings of the 1st ACM International Health Informatics Symposium, pages 297–306. ACM, 2010. A. McCallum. MALLET: A machine learning for language toolkit. http://mallet.cs.umass.edu, 2002. M. Newman. Finding community structure in networks using the eigenvectors of matrices. Physical Review E, 74(3):036104, 2006. M. Newman and M. Girvan. Finding and evaluating community structure in networks. Physical review E, 69(2):026113, 2004. M. Newman and J. Park. Why social networks are different from other types of networks. Physical Review E, 68(3):036122, 2003. H.-J. Paek, K. Kim, and T. Hove. Content analysis of antismoking videos on youtube: Message sensation value, message appeals, and their relationships with viewer responses. Health Education Research, 25(6):1085–1099, 2010. J. Paolillo. Structure and network in the youtube core. In Proceedings of the 41st Annual Hawaii International Conference on System Sciences, pages 156–165, 2008. R. Santos, B. Rocha, C. Rezende, and A. Loureiro. Characterizing the youtube video-sharing community. Available online at http://security1.win.tue.nl/ ∼bpontes/pdf/yt.pdf, 2006. L. Suzuki and J. Calzo. The search for peer advice in cyberspace: An examination of online teen bulletin boards about health and sexuality. Journal of Applied Developmental Psychology, 25(6):685–698, 2004. K. Vance, W. Howe, and R. Dellavalle. Social internet sites as a source of public health information. Dermatologic Clinics, 27(2):133–136, 2009. S. White and P. Smyth. A spectral clustering approach to finding communities in graphs. In Proceedings of the 5th SIAM International Conference on Data Mining, pages 274–285, 2005. X. Xu, N. Yuruk, Z. Feng, and T. Schweiger. SCAN: A structural clustering algorithm for networks. In Proceedings of the 13th ACM SIGKDD International Conference on Knowledge Discovery and Data Mining, pages 824–833. ACM, 2007. W. Zhang. State-space search: Algorithms, complexity, extensions, and applications. Springer: New York, 1999.