favorable reputations encourage website commitment .... will buy, creditors and investors ' decisions about both the ... corporate reputation domain ( Churchill,.
Corporate Reputation Review
Volume 14 Number 1
RepTrak™ Pulse: Conceptualizing and Validating a Short-Form Measure of Corporate Reputation Leonard J. Ponzi Reputation Institute, New York, NY, USA Charles J. Fombrun Reputation Institute, New York, NY, USA Naomi A. Gardberg Baruch College – CUNY, New York, NY, USA
ABSTRACT
Corporate reputations are of growing interest as intangible assets that provide firms with a competitive advantage in the marketplace. This article describes the development and validation of the RepTrak™ Pulse, an emotion-based measure of the corporate reputation construct that untangles the drivers of corporate reputation from measurement of the construct itself. The authors draw on signaling theory to conceptualize corporate reputation as a set of beliefs about companies. Qualitative research conducted in the US demonstrated the content validity of this measure of reputation. Quantitative studies with multiple samples of participants validated the simplified measure in different geographical locations and confirmed the measure’s ability to assess perceptions across stakeholder groups. Specifically, the authors examined how the US general public thinks about companies, how Canadian doctors assess pharmaceutical companies, how US consumers rate energy companies, and how Danish transportation employees evaluate their own firm. To confirm its cross-cultural validity the authors collected and analyzed data from 17 countries from six continents. This article reports the results of these analyses, and
demonstrates the reliability, internal validity, nomological validity and cross-cultural validity of the RepTrak™ Pulse scale as a short-form, etic measure of corporate reputation that can be used to facilitate cross-cultural research as well as online interviewing and survey-based data collection. Corporate Reputation Review (2011) 14, 15–35. doi:10.1057/crr.2011.5 KEYWORDS: corporate
reputation; crosscultural studies; reputation measurement; scale development; stakeholder management
INTRODUCTION
Corporate reputations are intangible assets that provide firms with sustainable competitive advantage in the marketplace (Boyd et al., 2010; Roberts and Dowling, 2002; Shamsie, 2003). Research consistently finds that it is a rare, inimitable, valuable and causally ambiguous asset (Boyd et al., 2010), and one of a firm’s ‘most important strategic resources’ (Flanagan and O’Shaughnessy, 2005: 445). Recent research reveals that favorable reputations encourage website commitment (Casalo et al., 2007), facilitate brand extensions (Hem et al., 2003) and
www.palgrave-journals.com/crr/
Corporate Reputation Review, Vol. 14, No. 1, pp. 15–35 © 2011 Macmillan Publishers Ltd., 1363-3589
RepTrak™ Pulse
enable exploitation of information asymmetries (Shamsie, 2003). In sum, corporate reputations are known to signal information about firms’ past and future activity that influence how customers and other key stakeholders view and behave towards them (Fombrun, 1996). While corporate reputation’s benefits are known and lauded, its measurement remains elusive. This paper describes the development of the RepTrak™ Pulse, a simplified emotion-based measure of corporate reputation. Building on signaling theory and the resource-based view (RBV) of the firm, we conceptualize corporate reputation as beliefs about companies and disentangle the drivers of reputation from the construct itself. Our literature review and analysis of prior operationalizations of the construct ‘corporate reputation’ suggest that the definition of the construct has been obscured with measurement of its drivers, and antecedents have been regularly used to measure the construct itself. This process has confounded our understanding of how corporate reputations are formed and has made interpretation of both academic and practitioner research difficult. Doing so also presumes that driverattributes are consistently and similarly understood and evaluated by observers crossculturally. In addition, we recognize a growing need for a short-form instrument that can facilitate recurrent and cross-national measurement of corporate reputations using standard polling methods. Various scholars have identified challenges in the use of multi-item, multi-measure instruments (Richins, 2004; Stanton et al., 2002) and have encouraged development of short-form scales for key constructs. Research that incorporates measurement of corporate reputation suffers from many of the challenges these authors identified. For example, most prevailing corporate reputation measures rely on 10 to 20 + attributes to identify perceptions of corporate performance domains, such as perceived
16
Corporate Reputation Review
Vol. 14, 1, 15–35
financial, product or social performance. While these attributes capture corporate reputation domains that are of interest (Churchill, 1979; Diamantopoulos and Winklhofer, 2001), questions often appear redundant to respondents, thereby leading to observed fatigue and non-response. Multiple questions about very similar attributes also increase demand effects and can lead to secondguessing about the researchers’ underlying hypotheses. When corporate reputation is not the focal construct but rather a moderating variable examined with other primary constructs (eg Darke et al., 2008), researchers tend to sacrifice a long-form scale to save space. In numerous polls and surveys, constructs such as trust, favorability and credibility are often used interchangeably with the reputation construct. But closer examination shows inconsistent wording hinders comparisons of results. Moreover, cross-cultural scholars recently have suggested that reliance on short-form, etic (universal) scales could enhance data collection, data analysis and cross-national comparisons for academics, MNC managers and policymakers alike (Craig and Douglas, 2000; Lee et al., 2008). Finally, market research increasingly is being conducted via internet and intranet surveys. Best practice in formatting online surveys suggests that short-form scales ease instrument design, specifically length and page formatting, in ways that enhance respondent participation and instrument effectiveness (Couper et al., 2001). In summary, we propose that a validated short-form measure of ‘corporate reputation’ would help to address theoretical, methodological and practitioner concerns by reducing fatigue, demand effects, redundancy and non-responsiveness; allowing inclusion of other constructs in the same questionnaire; providing pollsters and researchers with a rigorous and analytically grounded measure of corporate reputation
© 2011 Macmillan Publishers Ltd. 1363-3589
Ponzi, Fombrun and Gardberg
on which to draw; and facilitate data collection, particularly when carried out in surveys and online. In this paper, we summarize the results of qualitative and quantitative research and analyses designed to explore and validate the short-form measure of reputation we call ‘RepTrak™ Pulse’. In the following sections, we begin by providing background on the measurement of corporate reputation. We then describe one qualitative and five quantitative studies assessing the psychometric properties as well as the nomological, discriminant and cross-cultural validity of our simplified measure of corporate reputation. We conclude with implications and suggestions for further research.
the companies for which they are prepared to work (Fombrun, 1996). Various authors have suggested that they are economic assets because they influence the profitability of companies and are unique and inimitable (Fombrun, 2001; Fombrun and van Riel, 2004; Roberts and Dowling, 2002; Shamsie, 2003). Unfortunately, because reputations are intangible they are difficult to measure. There has been extensive discussion about the importance of developing a robust measure of corporate reputation, and much has been written about it in both academic and media outlets. However, few researchers now operationalize corporate reputation in a manner consistent with their definitions.
BACKGROUND
Corporate reputation continues to gain interest among scholars and practitioners. Barnett et al. (2006) found that the average number of published scholarly articles doubled from 2000 to 2003. Further, the average number of scholarly articles published between 2001 and 2003 was five times the average between 1990 and 2000.1 Corporate reputation is an interdisciplinary construct with conventional meaning. It attracts research in fields as diverse as economics, marketing, management, psychology and sociology among others. In management alone, Bergh et al. (2010) recognize numerous theories contribute to our understanding of this construct including RBV, transaction cost economics, signaling theory and social status research. Not surprising corporate reputation definitions and operationalizations are muddled (Barnett et al., 2006; Brown et al., 2006). Yet all agree that corporate reputations are valuable, intangible assets because they influence consumers’ decisions about the companies whose products and services they will buy, creditors and investors’ decisions about both the companies to which they will lend money and the price at which they will lend, and job-seekers’ decisions about
Measuring Corporate Reputation
A variety of applied measurement tools have been created that purport to measure corporate reputations. Most have been found wanting in one way or another (Bromley, 2002; Fombrun et al., 2000). The most familiar is probably Fortune’s popular study of the ‘most admired companies’, released annually by the magazine since 1982. The measure is based on ratings of companies obtained from invited managers and analysts. It therefore reflects the opinions of industry insiders and has a strong financial halo (Brown and Perry, 1994; Fryxell and Wang, 1994). The corporate reputation measure is calculated from responses to eight questions ranging from investment value to social responsibility. Although pioneering, Fortune’s rating (conducted by Hay Associates for the past ten years) has been widely criticized for lacking in methodological rigor and for demonstrating sample bias (Brown and Perry, 1994; Fryxell and Wang, 1994). Its principal benefit has been to call attention to the hidden value embedded in perceptions of companies. Other corporate reputation scales have been published by consultants or business
© 2011 Macmillan Publishers Ltd. 1363-3589
Vol. 14, 1, 15–35
Corporate Reputation Review
17
RepTrak™ Pulse
media outlets in over 38 countries. Examples include Clarin Magazine’s ‘100 Most Admired Companies in Argentina’, Carta Capital Magazine’s (TNS InterScience) ‘Most Admired Companies’ (Brazil), Datops’ ‘Reputation des Entreprises du CAC 40’ (France), Manager Magazin’s ‘Best Companies’ (Germany) and BusinessWorld’s ‘India’s Most Respected Companies’. Since the scales vary in the number and content of items as well as sampling frames, it has been difficult to compare their results cross-nationally (Fombrun, 2007). Several academics have proposed corporate reputation measures as well (Fombrun et al., 2000; Helm, 2005; Schwaiger, 2004; Walsh and Beatty, 2007). Fombrun and the market research firm Harris Interactive (HI) have conducted studies of corporate reputation in the US and Europe since fall 1999. The studies initially relied on the Reputation Quotient (RQ), a 20-item instrument that Fombrun developed with HI (Fombrun et al., 2000). Fombrun et al. (2000: 242) conceptualized corporate reputation as ‘a collective construct that describes the aggregate perceptions of multiple stakeholders about a company’s performance’. Thus, the RQ measure includes items on emotional appeal, financial performance, products and services, social performance, vision and leadership, and workplace environment. These items captured perceptions of corporate performance that had been shown to be associated with corporate reputation in prior research (Fombrun and Shanley, 1990), elicited from various stakeholder groups during qualitative research (Fombrun et al., 2000; Gardberg, 2006) and corresponded to the corporate reputation domain (Churchill, 1979; Fombrun et al., 2000; Gardberg, 2006). As we discuss below, the items were consistently found to load on two factors –an overall measure of ‘emotional appeal’ and a factor consisting of cognitive components of performance. Schwaiger (2004) developed a six-item corporate reputation measure consisting of
18
Corporate Reputation Review
Vol. 14, 1, 15–35
affective and cognitive dimensions. He tested his scale in Germany, the US and the UK using four German multinational corporations. Helm (2005) developed a ten-item corporate reputation scale in Germany. Her sample consisted of consumers, employees and investors evaluating an international consumer goods producer. Walsh and Beatty (2007) developed a 28-item customer-based reputation (CBR) measure. They defined CBR as ‘the customer’s overall evaluation of a firm based on his or her reactions to the firm’s goods, services, communication activities, interactions with the firm and/or its representatives or constituencies (such as employees, management, or other customers) and/or known corporate activities’ (2007: 129). Walsh et al. (2009) shortened their CBR scale from 28 to 15 items and validated it in the UK and Germany. Highhouse et al. (2009: 783) defined corporate reputation as ‘a global, temporally stable, evaluative judgment about a firm that is shared by multiple constituencies’, and used generalizeability theory to examine corporate reputation judgments. They asked US experts (academics) in different fields (disciplines) to assess the reputation of nine companies previously measured by Fombrun and associates (Gardberg and Fombrun, 2002) using a three-item scale. They found little variance in the perceptions of experts over time suggesting that a small number of experts could be used to assess corporate reputations. Their goal was to enhance psychologists’ use of corporate reputation in their research rather than develop a new measure. Each scholar reports good model fit statistics. Unfortunately, it is difficult to compare the performance of these measures because the studies use different psychometric techniques for evaluation. In addition, some model corporate reputation as a reflective construct, a formative construct or a combination of the two. Schwaiger’s twostage model of corporate reputation had
© 2011 Macmillan Publishers Ltd. 1363-3589
Ponzi, Fombrun and Gardberg
similar characteristics to the RQ identified by Fombrun et al. (2000). However, it is theoretically unclear why the competence dimension is a reflective indicator rather than part of the formative cognitive indicators. Similarity of many items across scales is noticeable. Yet, items vary in their degree of specificity. Overall, corporate reputation measurement has improved since the inception of Fortune’s ratings of ‘America’s Most Admired Companies’. Yet, these scales continue to vary in their sampling frames, items and length. Few have been validated in countries other than Germany, the US and the UK. And most endeavor to identify and measure performance domains rather than overall attitudes towards companies. Below we focus on various issues related to measuring and comparing corporate reputations cross-culturally. Cross-Cultural Measurement of Reputation
Cross-cultural management science, marketing and psychology researchers have identified several sources of cross-cultural bias in constructs (eg Brislin, 1980; Craig and Douglas, 2000; Singh, 1995). Cross-cultural validation requires explicit examination of construct validity, measurement equivalence, reliability and internal consistency (Craig and Douglas, 2000). Although 12 regional corporate reputation ratings and six global corporate reputation ratings are published by various newspapers and magazines, most have not been validated cross-culturally. An exception is analysis related to the RQ scale. From 1999 to 2005, Fombrun and HI conducted an annual global project to measure the reputations of the world’s ‘most visible companies’ with the collaboration of affiliated academics in numerous countries, including Australia, Denmark, France, Germany, Italy, Japan, the Netherlands, Norway, Sweden, UK and the US.
Qualitative work by Gardberg (2006) examined corporate reputation’s crosscultural conceptual equivalence, functional equivalence and some aspects of the RQ’s instrument equivalence. She found that ‘corporate reputation’ had conceptual equivalence because it was ‘expressed in similar attitudes or behaviors across nations’ (Singh, 1995: 605). ‘Corporate reputation’ also had functional equivalence because it ‘serve[d] the same function in different nations’ (Singh, 1995: 605). However, her research revealed that the RQ instrument lacked some aspects of instrument equivalence, which refers to whether ‘the scale items, response categories and questionnaire stimuli [are] interpreted identically across nations’ (Singh, 1995: 605). Some items lacked relevance in certain contexts. For example, some financial performance items were irrelevant in countries or sectors dominated by government-owned firms. In sum, Gardberg found construct equivalence with regard to corporate reputation’s domain, availability, antecedents and consequences. She proposed revisiting the issue of emic and etic items. In related research, Roster et al. (2006) used items from three different scales including the RQ to examine response bias in corporate reputation measurement crossculturally. They tested for and found a type of non-sampling error caused by systematic differences in the way in which respondents intentionally or unintentionally answered questions. Unfortunately, their items varied cross-culturally as they adapted the scale to emic needs hindering comparison of crossnational ratings. Our review of both practitioner and academic corporate reputation measures and analyses alerted us to an additional issue that complicates interpretation of this area’s research. Whether treated as a formative or reflective construct, most corporate reputation scores were combinations of items that were subsequently used as proxies for the
© 2011 Macmillan Publishers Ltd. 1363-3589
Vol. 14, 1, 15–35
Corporate Reputation Review
19
RepTrak™ Pulse
drivers of corporate reputation. This process makes several assumptions about the reputation formation process that are inconsistent with theories of information processing and signaling theory. In the next section we introduce signaling theory to conceptualize a corporate reputation measure. CAPTURING CORPORATE REPUTATIONS
The majority of practitioner and scholarly reputation measures model corporate reputation as a formative index rather than as a reflective scale. Yet, recent strategy research has highlighted the appropriateness of modeling intangible assets as reflective indicators (Bergh et al., 2010) because strategic resources are neither directly observable nor tangible. This approach improves the match between various definitions and operationalization. Following this line of research we meld RBV and signaling theory to capture corporate reputations. Several scholars conceptualize corporate reputations as constructed from market signals (Basdeo et al., 2006; Fombrun and Shanley, 1990) or strategic communication Rindova and Fombrun, 1999). As Prabhu and Stewart (2001: 64) wrote ‘Receivers’ interpretations of signals are inferences about the sender’s intentions and abilities that lead to beliefs about the relatively enduring characteristics of the sender. These beliefs about the sender are the basis of the sender’s reputation among its competitors’. These inferences may vary based upon noise or contextual differences that disrupt the receivers encoding of sender’s signals. Thus, a mismatch may occur between firms’ intentions and abilities and stakeholders’ perceptions. Signaling theory has been used to examine perceptions of corporate philanthropy (Gardberg and Schepers, 2008), market signals and reputation (Basdeo et al., 2006), and how market contexts affect interpretation (Prabhu and Stewart, 2001).
20
Corporate Reputation Review
Vol. 14, 1, 15–35
The question remains as to how to measure interpretations and beliefs. We adopt the perspective that corporate reputation is a corporate association (Brown et al., 2006) or overall impression (Highhouse et al., 2009) rather than trying to measure all elements in the performance domain. Doing so helps us achieve a short-form measure and avoid some pitfalls of prior operationalizations. Most corporate reputation operationalizations assume that receivers use all of the scale items in their corporate reputation calculation and that the valence of items is similar across receivers and contexts. For example, philanthropy is treated as though all receivers would perceive it as a positive reputation driver even though some receivers may be more aligned with Milton Friedman’s view that the social responsibility of business is profits, and consequently perceive philanthropy as a negative indicator. Individuals’ beliefs about companies may not be equal to the mean or the sum of the drivers offered by researchers. This may be particularly problematic when corporate reputation is modeled as a formative construct rather than a reflective one. Signaling theory suggests that the belief itself should be distinguished from potential signals or drivers. It considers which signals are detected, why and how. Capturing associations (Brown et al., 2006) most directly related to corporate reputation separately from drivers would eliminate noise from lack of knowledge and valence as well as allow researchers to better understand antecedents across contexts. SCALE CONSTRUCTION
In 2006, we initiated a multi-national, multistakeholder study to understand how reputations had evolved over the preceding decade since the qualitative research performed by Fombrun and associates (Fombrun et al., 2000; Gardberg, 2006). We hoped that our new theoretical insight combined with knowledge derived from prior research
© 2011 Macmillan Publishers Ltd. 1363-3589
Ponzi, Fombrun and Gardberg
would result in corporate reputation measurement that better matched definitions and operationalizations. Our overall objective was to create a short-form, etic scale and a long-form measure that captured the broader domain (Churchill, 1979). Discussion of the comprehensive measure is beyond this paper’s scope due to space limits so we will report here the results pertaining to the development of the short-form measure. The qualitative phase examined the reputation construct through a guided discussion with participants in an online forum of consumers across five major US markets. This phase was followed by tests of the reputation measure using a variety of samples. In the following sections, we detail these studies. Study 1: Qualitative Research
In study 1 we revisited the face validity of the reputation construct and affect-based items by building on prior qualitative and quantitative work (Fombrun et al., 2000; Gardberg, 2006). Fombrun et al. (2000) reported that a prior reputation measure factored into two dimensions: emotional and non-emotional items. The emotional items were (1) I have a good feeling about this company; (2) I admire and respect this company and (3) I trust this company. These items resonated well with participants crossculturally in seven countries (Gardberg, 2006). Additional analysis had suggested that ‘corporate reputation’ was a second-order latent variable with non-emotional items shaping or driving emotional items. These findings served as a starting point for this research project. In February 2006, we created a discussion guide to qualitatively probe perceptions of companies using an online bulletin board. The online bulletin board format provides many benefits of focus groups with fewer downsides. For example, it allows for geographically dispersed participants to elaborate on thoughts and perceptions at their own pace. As with focus groups, moderators
are able to follow-up on and probe certain responses, and participants are able to react to each others’ comments. The forum also provides an anonymous and comfortable format for people of different demographic characteristics to communicate offering more openness and less demand bias than traditional focus groups. Finally, this technique’s extended time period facilitates a more thorough exploration of issues raised during the discussion. We used a market research firm to select and invite 25 participants from five major metropolitan markets (Chicago, IL; Dallas, TX; Los Angeles, CA; Miami, FL and New York, NY) across the US to join the study. Two-thirds of the participants were employed and one-third worked part-time. Our sample was 50 percent male and had a mean age of 38 years. All had at least some post-secondary education. We moderated the threaded discussion for three days. We posted questions once or twice a day to revisit previous qualitative work (Fombrun et al., 2000; Gardberg, 2006) such as the corporate reputation construct and some of the specific attributes used to build the corporate reputation scale. We initiated the discussion with a question regarding overall reputation with regard to businesses, companies and corporations in general. Then we explored the characteristics and actions of companies with good and bad reputations as well as the antecedents and consequences of both good and bad corporate reputations. We delved into the key areas that describe company actions and policies. In addition, we probed the relative importance of these areas and sought feedback on specific items for the new scale. The discussion generated more than 200 pages of text, which we analyzed using SPSS’s content analysis software. Table 1 summarizes some of the discussion content from this online panel, and shows how the three emotional attribute statements were elicited from discussions, and were then
© 2011 Macmillan Publishers Ltd. 1363-3589
Vol. 14, 1, 15–35
Corporate Reputation Review
21
RepTrak™ Pulse
Table 1: Study 1: Derivation of Reputation Statements
22
Verbatim statements by bulletin board participants
RepTrak™ Pulse statement
‘…the way the consuming public views a company, its practices, its contributions to communities, its benefits to stockholders, and its image as a business leader’. ‘A good reputation implies that over the course of time people have continued using it. It can definitely mean that people RECOMMEND using it to others. A bad reputation is quite simply people having lousy experiences with it and warning others away as a result’. ‘It means there is quality and reliability within the company and its employees’. ‘If people talk highly of the company, buy & use product/service over and over again, and also refer others, I would say the company has a good reputation’. ‘A company with a good reputation is seen as taking care of its employees, being relatively good to the environment, and generally honest and accountable’.
1. Has a good overall reputation
‘A good reputation means people think positively about you and your services’. ‘To me, the word “reputation” means distinction, notoriety, honor and ranking’. ‘Companies I have a good feeling about because they offer top quality products and services and demonstrate genuine interest in their customers and their local communities’. ‘…companies that have always given me a good feeling about utilizing their services’. ‘A good reputation means you are doing things right and people think highly of you and your services’.
2. Is a company I have a good feeling about
‘It means to that any products that you produce you will stand by it and what it does 100 percent and it’s a product that you yourself trust…’ ‘I would be more likely to buy a product from a company with a better reputation because I feel a certain trust initially…’ ‘I trust them because over the years, they⬘ve proven to be outstanding and never had any problems which led me to distrust of them’. ‘I trust them because they stand behind their products’. ‘…past history past track record, experience, trustworthy…’
3. Is a company that I trust
‘I definitely admire a company that can offer so much and still maintain quality of products and service at the same time’. ‘A company with a good reputation would be looked up to by competitors and people would want to work there. Their executives would be top notch and very involved with the community as well as their company’s direction’. ‘I admire and respect companies with good records at producing high quality products and services’. ‘I admire the owners of the companies’. ‘A company with high or outstanding moral character’. ‘I definitely admire a company that can offer so much and still maintain quality of products and service at the same time’.
4. Is a company that I admire and respect
Corporate Reputation Review
Vol. 14, 1, 15–35
© 2011 Macmillan Publishers Ltd. 1363-3589
Ponzi, Fombrun and Gardberg
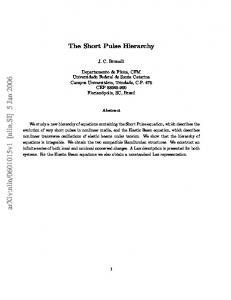
corporate reputation measure. The first relied on a nationally representative sample of the US general public. It was followed by three specialized samples of stakeholders, including a sample of Canadian doctors assessing a pharmaceutical company, a sample of US consumers assessing energy companies, and a sample of Danish employees assessing a logistics company. For each study we followed the same methods. We conducted an analysis of missing values and deleted participants who had two or more missing values on the four items. In the polling context, familiarity with a company indicates the incidence rate within the population (Asher, 2004). For modeling purposes, other missing values were replaced using standard predictive estimation methods. We used structural equations modeling (SEM) to examine the reliability and validity of the reputation measure. This approach demonstrates several advantages over more traditional techniques most notably when the model to be evaluated is not directly observable. A graphic representation of the structural model is shown in Figure 1. We assessed the suitability of the measure’s factor structure through confirmatory factor analysis (CFA) using SPSS AMOS 6.0 software. We used a maximum likelihood model because it provided the most stable results for this sample size. In addition, we modeled the RepTrak™ Pulse as a reflective measure
validated by the participants to capture their overall perceptions of companies. Our analysis suggested that a short measure of corporate reputation could consist of three overt attribute statements designed to elicit the company’s emotional appeal to participants (Fombrun et al., 2000), anchored by a fourth question that invited participants also to rate the company’s ‘Overall Reputation’ (Highhouse et al., 2009). 1. [Company] is a company I have a good feeling about 2. [Company] is a company that I trust 3. [Company] is a company that I admire and respect 4. [Company] has a good overall reputation The measure could be constructed based on responses to these items on 7-point scales, where 1 = Strongly Disagree and 7 = Strongly Agree. We named the scale the RepTrak™ Pulse because it captures corporate reputation’s emotional component (the ‘beating heart’). These items capture an association distinct from corporate reputation’s drivers or signals. The rest of this paper assesses the reliability and validity of this emotional measure of corporate reputation in different national settings and with different stakeholder groups. SCALE RELIABILITY
We used samples from four studies to test the reliability and validity of the short-form δ1
1
Company Feeling
λ1
δ2
1
Admire and Respect
λ2
δ3
1
Company Confidence
λ3
Reputation Construct ε
λ4 δ4
Figure 1:
1
Overall Reputation
The RepTrak™ Pulse Model
© 2011 Macmillan Publishers Ltd. 1363-3589
Vol. 14, 1, 15–35
Corporate Reputation Review
23
RepTrak™ Pulse
Table 2: Studies 2–5: Item and Scale Statistics
Industry
Study 2
Study 3
Study 4
Study 5
Mixed
Pharmaceutical
Energy
Transportation
Item
Mean
Std. Dev.
Mean
Std. Dev.
Mean
Std. Dev.
Mean
Std. Dev.
Overall reputation Good feeling Trust Admire and respect
4.30 4.09 4.06 3.98
1.70 1.82 1.77 1.78
6.00 5.89 5.90 5.73
0.99 1.07 1.05 1.09
5.09 4.95 4.96 4.80
1.61 1.64 1.68 1.66
2.99 3.33 3.28 2.92
1.51 1.61 1.65 1.49
n
907
600
because it is most appropriate for intangible, strategic assets (Bergh et al., 2010). Descriptive statistics for the items across the four quantitative studies are presented in Table 2. Table 3 depicts the Cronbach’s alpha coefficient for the complete scale as well as factor loadings and item-to-total correlations for the four studies. Study 2: US General Public Assessing Familiar Companies
In study 2 we assessed our instrument’s validity with the US general public. Online interviews were conducted with 907 participants, designed to be representative of the US general public, by a large market research firm during May of 2006. The sample was balanced on gender, and participants ranged from 18 to 82 years with an average age of 45 years. Approximately 50 percent of participants reported income below $50,000. Representativeness tests indicate that the sample did not differ significantly from the overall profile of the US general public. Participants were presented with a list of 40 randomly rotated company names representing a cross section of important US industries (see the Appendix). To assess the measure we chose firms previously recognized as having favorable and unfavorable reputations. To qualify for the interview, participants had to be ‘somewhat
24
Corporate Reputation Review
Vol. 14, 1, 15–35
500
2,041
familiar’ or ‘very familiar’ with at least one of the companies. Inter-item correlations are high and are positive for all items. The Cronbach’s alpha (0.96) and correlations of the items with the scale all are high and above 0.8, indicating strong scale reliability (Nunnally and Bernstein, 1994). In addition, for each item, the alpha coefficient is higher than the alpha without the item, further supporting scale reliability. The goodness of fit index (GFI = 0.91), the comparative fit index (CFI = 0.94) and the root mean square error of approximation (RMSEA = 0.096), all denote an acceptable fit. The non-significant X 2(2) = 1.98, p = 0.37 also reveals a good model fit. Owing to the X2 test’s limitations and sensitivity to sample size, we calculated an AGFI fit statistic, which is less sensitive to sample size. The model’s value of 0.995 exceeds the AGFI’s benchmark value equal to or above 0.90 and confirms the model’s goodness of fit. To assess convergent validity, we examined the ‘variance extracted’, which represents the total amount of variance in the independent variables accounted for by the latent variable. The variance extracted was 0.88, exceeding the benchmark of 0.50 or greater (Fornell and Larcker, 1981), and indicated the measure’s convergent validity.
© 2011 Macmillan Publishers Ltd. 1363-3589
© 2011 Macmillan Publishers Ltd. 1363-3589
X2 (d.f.); p GFI CFI RMSEA AGFI AVE Construct reliability Coefficient alpha
Overall reputation Good feeling Trust Admire and respect
Item
0.87 0.93 0.91 0.91
Item-to-total correlation 0.87 0.89 0.89 0.85
Item-to-total correlation
4.18 (2); 0.12 0.997 0.999 0.043 0.983 0.82 0.95 0.95
0.90 0.93 0.93 0.87
Factor loading
Pharmaceutical
Mixed
1.98 (2); 0.37 0.911 0.944 0.096 0.995 0.88 0.96 0.96
0.92 0.97 0.96 0.96
Factor loading
Study 3
Study 2
Table 3: RepTrak™ Pulse Scale Characteristics
0.92 0.95 0.94 0.93
Item-to-total correlation
3.31 (2); 0.19 0.997 1.00 0.036 0.983 0.90 0.97 0.98
0.93 0.96 0.95 0.95
Factor loading
Energy
Study 4
0.81 0.83 0.87 0.86
Item-to-total correlation
3.91 (2); 0.14 0.997 0.999 0.040 0.984 0.78 0.93 0.93
0.85 0.88 0.91 0.89
Factor loading
Transportation
Study 5
Ponzi, Fombrun and Gardberg
Vol. 14, 1, 15–35
Corporate Reputation Review
25
RepTrak™ Pulse
Although Cronbach’s alpha for internal reliability is most frequently reported, some scholars suggest that it underestimates scale reliability. We therefore used a complementary measure, the SEM construct reliability measure. The SEM construct reliability was 0.99 exceeding the benchmark 0.70 or greater suggesting a satisfactory result. In sum, the RepTrak™ Pulse measure appears to capture the corporate reputation construct well with the US public. Study 3: Doctors Assessing Pharmaceutical Firms
In study 3 we focused on an expert stakeholder group (doctors) with close ties to a supplier (pharmaceutical firms) to test the model’s robustness in another context. The pharmaceutical industry is an interesting context because firms provide both products and information to medical professionals who sort through these to prescribe the appropriate product for their patients. Hence this is a critical nexus of information that affects both quantity and quality of life. We examined the properties of the scale within an expert community rather than with the general public (Bromley, 2002). A scale suitable for both an expert community and the general public would be more useful than one appropriate for only one sample type. In fall 2006, telephone interviews were conducted with a physician sample in both Anglophone and Francophone Canada by an established market research firm. Participants were given the opportunity to select English or French language questionnaires. Questionnaires were translated into local languages by translators familiar with both languages then checked by a local contact familiar with the research topic (Craig and Douglas, 2000). Approximately 22 percent (n = 78) of the sample lived in Quebec (French Canada). The average age was 50 years and the sample was 80.6 percent male. General practitioners comprised 58.1 percent of the sample and physicians in
26
Corporate Reputation Review
Vol. 14, 1, 15–35
family practice comprised the remaining 41.9 percent. Each participant rated a European pharmaceutical company with which they were familiar resulting in 600 valid ratings. Item and scale means exceeded those in study 2. Given the sample of rated companies and participants, the pharmaceutical firms’ higher overall reputation compared to a broad sample of firms was to be expected. Participants rated corporate reputations using the scale (Cronbach’s � = 0.95). Cronbach’s alpha declined when any item was removed. In an AMOS measurement model, GFI = 0.997, CFI = 0.999, RMSEA = 0.04, AVE = 0.82, and SEM construct reliability = 0.95. The model’s X 2 (2) = 4.17, p = 0.12 and AGFI = 0.983. In summary, the CFA model produced an acceptable fit to the data. Study 4: Customers Assessing Energy Suppliers
In study 4 we surveyed US consumers about a familiar set of energy providers. Deregulation of the US energy sector is forcing suppliers to attend to reputational issues in new ways. In fall 2007, we relied on an established market research firm to conduct a set of online interviews with a sample of 2,525 US consumers (46.1 percent male). Participants had an average age of 45 years. Approximately, 40 percent of the participants reported income of less than $50,000. Tests of representativeness indicate that the sample was not significantly different from the overall profile of the US general public. Item means for this study were lower than in the previous studies. The measure’s Cronbach’s alpha was equal to 0.98 and declined when any item was removed. We used a random subsample of 500 participants to validate the reputation measure. In an AMOS measurement model, GFI = 0.997, CFI = 0.999, RMSEA = 0.04, X 2(2) = 3.30, p = 0.19, AGFI = 0.98, AVE = 0.90 and SEM construct reliability = 0.97. Thus, we accepted our measurement model as adequate.
© 2011 Macmillan Publishers Ltd. 1363-3589
Ponzi, Fombrun and Gardberg
Study 5: Danish Employees Assessing a Railroad
In study 5, we used an established market research firm to conduct a set of online interviews with a sample of 2,041 employees (42.8 percent male) of a major Danish transportation company in Denmark to explore the validity of the reputation scale in a not-for-profit context during spring 2008. Participants ranged from 18 to 60 years with an average age of about 45 years. Tests of representativeness indicated that the sample was not significantly different from the Danish company’s overall profile. Questionnaires were translated into Danish by translators familiar with both languages then checked by a local contact familiar with the research topic. Item means for this study and sample were lower than in the previous studies. The measure’s Cronbach’s alpha was equal to 0.93 and declined when any item was removed. A random subsample of 600 participants was used to validate the reputation measure. In an AMOS measurement model, GFI = 0.997, CFI = 0.999, RMSEA = 0.04, X 2(2) = 3.91, p = 0.14, AGFI = 0.98, AVE = 0.78 and SEM construct reliability = 0.93. Thus, we accepted our measurement model as having an adequate fit. In summary, we found an adequate measurement fit for samples of the US general public, Canadian doctors, US energy consumers, and Danish public sector employees assessing large US companies, European pharmaceutical firms, US energy providers and a state-owned transport company, respectively. These results provide solid support for our short-form measure. NOMOLOGICAL VALIDITY
A favorable reputation’s value rests on the future performance benefits that result from cost reduction and revenue generation. Corporate reputations have been associated with several supportive behaviors such as intention to purchase a company’s products and
services, to provide the benefit of the doubt to consumers, to invest in its shares, to form joint ventures and strategic alliances, to seek employment, and to share positive word-ofmouth. Gardberg (2006) found many of these behaviors to be consistent cross-culturally. Word-of-mouth recommendations and intentions to support firms reveal how companies’ signals are interpreted and shape receivers subsequent behavior. Word-of-mouth recommendations lower firms’ costs because they are a cheaper way to acquire customers, investors and employees than advertising is. They also generate more revenue because word-of-mouth customers add more long-term value to firms than advertising-acquired customers (Villanueva et al., 2008). Good reputations are expected to generate positive word-of-mouth recommendations (Walsh and Beatty, 2007). Corporate reputations also are a more economical means to acquire customers, investors and employees than marketing programs or investor relations activities. Positive reputations are expected to be associated with higher levels of intent. We used the same data from studies 2, 3, 4 and 5 to examine the relationship between corporate reputation and supportive behaviors at the individual level. Our analyses of nomological validity recognize that supportive behaviors may vary across stakeholder groups and industries. The supportive behaviors in each questionnaire reflected both the industry and stakeholder group sampled. For example, since the Danish company was state-owned, asking the employee sample about investment attractiveness would be inappropriate. Across the three samples we asked a general word-of-mouth item –‘I would say something positive about [company]’. We included two stakeholder specific wordof-mouth items regarding recommendation as a place to work and recommendation of the company’s products and services. We measured the items using a 7-point scale
© 2011 Macmillan Publishers Ltd. 1363-3589
Vol. 14, 1, 15–35
Corporate Reputation Review
27
RepTrak™ Pulse
anchored by ‘I strongly agree’ = 7 and ‘I strongly disagree’ = 1, and an option to respond ‘not sure’. We used AMOS to model the consequences as elements of a latent variable ‘supportive behavior’. We report factor loadings for each indicator in Table 4. First, the sample of US General Public answered four items including the word-ofmouth item and three intent items. Fit statistics were NFI = 0.993, CFI = 0.995, GFI = 0.984, SRMR = 0.05, REMSEA = 0.05 and X 2 (19) = 61.56, p = 0.00. Supportive behavior was associated with corporate reputation at 0.82. Although our X 2 was significant, all other measures of model fit were within guidelines. Thus, we accepted our measurement model as adequate. Second, the Canadian doctors evaluating pharmaceutical firms answered four items including the word-of-mouth item and two intent items. Word-of-mouth among doctors was one of the first published examples of the phenomenon (Brooks, 1957).
Fit statistics were NFI = 0.986, CFI = 0.993, GFI = 0.977, SRMR = 0.02, REMSEA = 0.06 and X 2 (19) = 25.80, p = 0.02. Supportive behavior was associated with corporate reputation at 0.88. Although our X 2 was significant, all other measures of model fit were within guidelines. Thus, we accepted our measurement model as adequate. Third, the sample of US consumers evaluating energy companies answered four items including two word-of-mouth items and two intent items. In the AMOS measurement model, fit statistics were NFI = 0.985, CFI = 0.991, GFI = 0.956, SRMR = 0.057, RMSEA = 0.076 and X 2 (19) = 49.913, p = 0.000. Supportive behavior was associated with corporate reputation at 0.73, which is lower than in our physician sample. Although X2 was significant for this model, the other measures of model fit were all within guidelines. Thus, we accepted our measurement model as having an adequate fit.
Table 4: Corporate Reputation Effects on Behavioral Intentions
Factor loadings
28
US Mixed
Canadian Pharmaceutical
US Energy
Danish Transportation
I would say something positive about If I had the opportunity, I would buy the products/services I would recommend the products/ services of I would invest I would prescribe products I would participate in continuing medical education events I would recommend as a good place to work/recommend to apply for a job I have an open mind toward company activities and initiatives I would participate in programs to improve the community
0.90 0.90
0.87
0.96
0.95 0.89
n
907
Corporate Reputation Review
Vol. 14, 1, 15–35
0.95
0.94
0.73 0.76 0.67 0.89
0.67
0.92 0.85
300
285
© 2011 Macmillan Publishers Ltd. 1363-3589
475
Ponzi, Fombrun and Gardberg
Finally, the sample of Danish employees answered five items including three word-of-mouth items and an intent item. Fit statistics were NFI = 0.975, CFI = 0.979, GFI = 0.947, SRMR = 0.073, RMSEA = 0.095 and X2 (19) = 100.900, p = 0.000. Supportive behavior was associated with corporate reputation at 0.87, similar to our physician sample. Although the X 2 was again significant, the other measures of model fit were within guidelines. Thus, we accepted our measurement model as adequate. Overall we found support for the nomological validity of the RepTrak™ Pulse measure of corporate reputation using various reputational consequences across stakeholders, industries and countries. DISCRIMINANT VALIDITY
Assessing discriminant validity is important to determine whether two constructs are statistically different measures. This is particularly important when constructs appear to be correlated or similar in nature. In other words, different latent variables that correlate too highly may indeed be measuring the same construct. To assess the discriminant validity of the RepTrak™ Pulse and supportive behaviors we followed the process outlined by Anderson and Gerbing (1988). In an AMOS model we fixed the variance of the latent variables to 1, removed the regression weight constraints of the observed variables to the latent variables and fixed the covariance between the two latent variables
to 1. We then conducted a X 2 difference test to assess discrimination. Table 5 presents the results of our analysis. For each of our models the X 2 difference was significant suggesting that the RepTrak™ Pulse and supportive behaviors are distinct constructs. CROSS-CULTURAL VALIDITY Study 6: Cross-Cultural Validity
Once we found support for our measure using four different stakeholder groups in three countries, we tested the measure in 17 countries across six continents, representing nine different cultural clusters based on Project Globe studies (Gupta et al., 2002). In 2007 we asked an established market research firm to collect data using equivalent sampling frames for firms and participants cross-culturally. We collected data on the largest 800 companies representing the 17 countries. The number of companies measured in each country was a function of the population of the country and relative size of the firms. A description of the sampling frame can be requested from the authors. In each country the respondent sample was designed to be representative of the general population. Data were collected online except in countries with low internet penetration such as Australia and South Africa. We collected 8,020 respondent ratings (Table 6). We replicated the analysis performed in study 2. Table 7 contains the results of our
Table 5: Discriminant Validity: Corporate Reputation and Behavioral Intentions
Study
Constrained
Mixed Canadian Pharmaceutical US Energy Danish Transportation
Baseline
Change
p
Chi-square
d.f.
Chi-square
d.f.
Chi-square
d.f.
1215.195 74.820 736.858 461.084
20 20 20 20
61.563 25.798 49.913 100.900
19 19 19 19
1153.632 49.022 686.945 360.184
1 1 1 1
© 2011 Macmillan Publishers Ltd. 1363-3589
Vol. 14, 1, 15–35
0.000 0.000 0.000 0.000
Corporate Reputation Review
29
RepTrak™ Pulse
Table 6: Study 6: Countries and Cultural Clusters for Cross-Cultural Validation
Geographic culture clusters
Countries sampled
Anglo Arab Confucian Asia Eastern Europe Germanic Europe
Australia, Canada, UK, US None China, Japan Russia The Netherlands, Switzerland (German speaking) France, Italy, Switzerland (French speaking) Argentina, Mexico Denmark, Sweden India South Africa
Latin America Latin Europe Nordic Europe Southern Asia Sub-Sahara Africa
Cultural clusters from Project Globe (Gupta et al., 2002)
analysis. Inter-item correlations were high and positive for all items. The Cronbach’s alpha ranged from 0.937 for India to 0.967 for the UK and the United States. GFI ranged from 0.989 for Argentina and the UK to 0.998 for Australia and Denmark. CFI ranged from 0.972 for the UK to 0.998 for Australia and Japan, and the RMSEA ranged from 0.019 for Japan to 0.081 for the UK. Owing to the X 2 test’s sensitivity to sample size, we calculated AGFI, which ranged from 0.945 in Argentina to 0.988 in Denmark. Our analysis suggests an acceptable model fit for the 17 countries. In summary, we found support for the use of the RepTrak™ Pulse cross-culturally. DISCUSSION
Corporate reputations are beliefs about companies’ past and future actions that shape how stakeholders interact with them. In this paper, we therefore conceptualized and tested a short-form measure for broad assessment of the emotional component of reputation. We triangulated by reviewing prior
30
Corporate Reputation Review
Vol. 14, 1, 15–35
operationalizations of corporate reputation measures, performing qualitative research and collecting quantitative data (Fombrun et al., 2000; Helm, 2005). We validated the scale in 17 countries, involving some 12,000 participants in six studies. We used both measures of internal consistency and external validity to demonstrate the value of this measure and to assess its performance. The resulting scale and models demonstrated excellent psychometric properties. We found that our Cronbach’s alpha and other psychometric results match or exceed all prior measures. Our analysis of the RepTrak™ Pulse’s nomological validity also found that the measure predicted a series of industryrelevant supportive behaviors. Our analysis of the RepTrak™ Pulse’s discriminant validity distinguished between it and its supportive behaviors. In sum, we suggest that the RepTrak™ Pulse is a potentially powerful short-form measurement tool that can be used to: (1) assess perceptions of corporate reputation by both the general public and by specialized stakeholders; (2) compare corporate reputations across stakeholder groups; and (3) compare corporate reputations crossculturally. We envision several opportunities for further research. Our conceptualization of corporate reputation based on signaling theory recognizes that signal interpretation varies across contexts. These elements can be explored with subsequent antecedent or driver analysis. This research project suggests that the RepTrak™ Pulse can be a useful measure of corporate reputation across samples that consist of different types of stakeholders: general public, employees, professionals and customers. Further research could verify these results with other important stakeholder groups including analysts, non-government groups, regulators and reporters. Although our studies used samples of large firms, the simplicity of the four-item measure makes it appropriate for the small firm context.
© 2011 Macmillan Publishers Ltd. 1363-3589
© 2011 Macmillan Publishers Ltd. 1363-3589
Vol. 14, 1, 15–35
a
d.f.=2 for all models.
Argentina Australia Canada China Denmark France India Italy Japan Mexico Netherlands Russia South Africa Sweden Switzerland United Kingdom United States
Country
110 880 450 950 855 370 290 420 390 130 490 460 230 660 330 235 770
Respondent n 2.393 2.949 5.537 5.828 4.167 4.196 3.239 3.575 2.281 2.646 4.536 3.874 3.362 5.256 3.07 5.051 4.498
X2a
0.302 0.229 0.063 0.054 0.124 0.123 0.198 0.167 0.320 0.266 0.104 0.144 0.186 0.072 0.215 0.080 0.105
p
0.917 0.920 0.882 0.899 0.911 0.921 0.843 0.918 0.943 0.932 0.924 0.868 0.873 0.902 0.878 0.922 0.901
Overall reputation 0.949 0.950 0.955 0.915 0.927 0.965 0.932 0.948 0.953 0.899 0.936 0.955 0.898 0.955 0.940 0.961 0.960
Good feeling
Table 7: Study 6: Cross-Cultural Validation for the RepTrak™ Pulse
0.944 0.945 0.946 0.901 0.923 0.948 0.904 0.924 0.924 0.947 0.956 0.918 0.909 0.936 0.941 0.952 0.959
Trust
0.941 0.934 0.924 0.898 0.896 0.885 0.883 0.952 0.900 0.876 0.895 0.893 0.901 0.842 0.874 0.926 0.936
Admire and respect 0.989 0.998 0.994 0.997 0.998 0.994 0.994 0.996 0.997 0.990 0.995 0.996 0.993 0.996 0.995 0.989 0.997
GFI
0.992 0.998 0.983 0.991 0.994 0.987 0.990 0.992 0.998 0.988 0.989 0.991 0.986 0.989 0.993 0.972 0.993
CFI
0.042 0.023 0.063 0.045 0.036 0.055 0.046 0.043 0.019 0.050 0.051 0.045 0.055 0.050 0.040 0.081 0.040
RMSEA
0.945 0.992 0.969 0.985 0.988 0.972 0.972 0.979 0.985 0.949 0.977 0.979 0.963 0.980 0.977 0.946 0.985
AGFI
0.966 0.966 0.960 0.946 0.953 0.961 0.937 0.965 0.962 0.951 0.960 0.949 0.940 0.949 0.949 0.967 0.967
Cronbach �
Ponzi, Fombrun and Gardberg
Corporate Reputation Review
31
RepTrak™ Pulse
Finally, although we demonstrated the RepTrak™ Pulse’s discriminant validity visà-vis supportive behaviors, we were unable to assess the scale’s discriminant validity relative to related constructs such as image and identity (Brown et al., 2006) due to a lack of validated scales. Future research should revisit these constructs. Theoretical Implications
Our analysis supported the conceptualization of corporate reputation as a secondorder latent variable determined by perceptions of corporate behavior and emotional responses to these behaviors (Fombrun et al., 2000; Helm, 2005). Although corporate reputation is a cross-culturally valid construct (Gardberg, 2006), rigorous measurement requires a separation of the drivers of reputation from the construct itself to enable valid study of the construct’s antecedents and consequences. Drivers of reputation may vary based on various factors such as ownership type (for-profit versus not-forprofit versus state-owned), expectations of corporate social responsibility, or industry because interpretation of signals are likely to vary across contexts and groups (Balmer and Greyser, 2006). In particular, when corporate reputation is operationalized as a formative measure, item valence of drivers may flip causing erroneous scores, confounding interpretation and hindering cross-context comparison. We surveyed consumers, medical professionals, employees and the public about corporate reputations. Our measure demonstrated excellent psychometric properties with both the general public and with samples of specialized stakeholders. We therefore avoid some of the problematic issues identified by Bromley (2002). When corporate reputation can be modeled as beliefs about a company (Prabhu and Stewart, 2001) its measurement is buffered from variations in participant experience, knowledge and accuracy. In addition, by situating
32
Corporate Reputation Review
Vol. 14, 1, 15–35
corporate reputation as a belief about companies this measure can facilitate interdisciplinary research on reputations (Brown et al., 2006). The corporate reputation measure that we developed is short and simple to use, consisting of four items. It can therefore powerfully serve scholars as a short-form measure of corporate reputation when it is the focal construct, a mediator or a moderator variable across contexts; and when it is being used across data collection methods. Its brevity also will facilitate its use as a manipulation check in experiments. Implications for Practice
Scholars have demonstrated that reputation is an important asset (eg Campbell, 1999; Casalo et al., 2007; Hem et al., 2003; Jensen and Roy, 2008; Roberts and Dowling, 2002; Shamsie, 2003). The RepTrak™ Pulse can enhance practitioners’ ability to implement enriched research in this area. It can be incorporated into large data collection activities conducted via both telephone and online interviewing. Practitioners can more easily assess their firm, competitors’ and/or business partners’ corporate reputations allowing them to implement market research findings or to exploit reputational advantages. They need not sacrifice academic rigor in their applied research. Ultimately, the purpose of this paper was to share the findings of qualitative and quantitative research carried out to validate the RepTrak™ Pulse measure of corporate reputation. Analysis of the data demonstrated the face validity of the four items and their ability to assess the overall reputation of a company. The RepTrak™ Pulse can (1) be incorporated with other measures of interest; (2) be standardized cross-culturally; (3) be used to cull perceptual data from large samples of diverse participants; (4) be used with both traditional and online polling techniques; and (5) used to distinguish between the corporate reputation construct and its
© 2011 Macmillan Publishers Ltd. 1363-3589
Ponzi, Fombrun and Gardberg
drivers. This operationalization of corporate reputation better matches the description of corporate reputations as having central, enduring and distinctive features. Widespread use of this validated measure by academics and practitioners can facilitate the cumulative growth of research findings in the field. Acknowledgments
The authors thank Professors Andreas Grein and Sankar Sen, Senior Analysts Daniel Stasik and Sebastian Taciak, and editor Cees van Riel and two anonymous reviewers for their helpful comments and suggestions on previous drafts of this paper. We also acknowledge the Weissman Center for International Business at Baruch College CUNY for research support. NOTE 1 Barnett et al. note the number of publications excludes CRR because it was not indexed.
REFERENCES Anderson, J.C. and Gerbing, D.W. (1988) ‘Structural equation modeling in practice: A review and recommended two-step approach’, Psychological Bulletin, 103(3), 411–423. Asher, H. (2004) Polling and the Public, 6th edn. CQ Press, Washington, DC. Balmer, J.M.T. and Greyser, S.A. (2006) ‘Integrating corporate identity, corporate branding, corporate communications, corporate image and corporate reputation’, European Journal of Marketing, 40(7/8), 730–741. Barnett, M.L., Jermier, J.M. and Lafferty, B.A. (2006) ‘Corporate reputation: The definitional landscape’, Corporate Reputation Review, 9(1), 26–38. Basdeo, D.K., Smith, K.G., Grimm, C.M., Rindova, V.P. and Derfus, P.J. (2006) ‘The impact of market actions on firm reputation’, Strategic Management Journal, 27(12), 1205–1219. Bergh, D.D., Ketchen Jr., D.J., Boyd, B.K. and Bergh, J. (2010) ‘New frontiers of the reputationperformance relationship: Insights from multiple theories’, Journal of Management, 36(3), 620–632. Boyd, B.K., Bergh, D.D. and Ketchen Jr., D.J. (2010) ‘Reconsidering the reputation-performance relationship: A resource-based view’, Journal of Management, 36(3), 588–609.
Brislin, R.W. (1980) ‘Translation and content analysis of written materials’, in H. C. Triandis and J.W. Berry (eds.), Handbook of Cross-Cultural Psychology, Allyn & Bacon, Boston. Bromley, D. (2002) ‘Comparing corporate reputations: League tables, quotients, benchmarks, or case studies?’ Corporate Reputation Review, 5(1), 35–50. Brooks Jr., R.C. (1957) ‘Word-of-mouth advertising in selling new products’, Journal of Marketing, 22(2), 154–161. Brown, B. and Perry, S. (1994) ‘Removing the financial performance halo from Fortune’s ‘most admired’ companies’, Academy of Management Journal, 37(5), 1347–1359. Brown, T.J., Dacin, P.A., Pratt, M.G. and Whetten, D.A. (2006) ‘Identity, intended image, construed image, and reputation: An interdisciplinary framework and suggested terminology’, Journal of the Academy of Marketing Science, 34(2), 99–106. Campbell, M.C. (1999) ‘Perceptions of price unfairness: Antecedents and consequences’, Journal of Marketing Research, 36(2), 187–199. Casalo, L.V., Flavian, C. and Guinaliu, M. (2007) ‘The influence of satisfaction, perceived reputation and trust on a consumer’s commitment to a website’, Journal of Marketing Communications, 13(1), 1–17. Churchill Jr., G.A. (1979) ‘A paradigm for developing better measures of marketing constructs’, Journal of Marketing Research, 16(1), 64–73. Couper, M.P., Traugott, M.W. and Lamias, M.J. (2001) ‘Web survey design and administration’, Public Opinion Quarterly, 65(2), 230–253. Craig, C.S. and Douglas, S.P. (2000) International Marketing Research, 2nd edn., John Wiley & Sons, Ltd, New York. Darke, P.R., Ashworth, L. and Ritchie, R.J.B. (2008) ‘Damage from corrective advertising: Causes and cures’, Journal of Marketing, 72(6), 81–97. Diamantopoulos, A. and Winklhofer, H.M. (2001) ‘Index construction with formative indicators: An alternative to scale development’, Journal of Marketing Research, 38(2), 269–277. Flanagan, D.J. and O’Shaughnessy, K.C. (2005) ‘The effect of layoffs on firm reputation’, Journal of Management, 31(3), 445–463. Fornell, C. and Larcker, D.F. (1981) ‘Evaluating structural equation models with unobservable variables and measurement error’, Journal of Marketing Research, 18(1), 39–50. Fombrun, C. and Shanley, M. (1990) ‘What’s in a name? Reputation building and corporate strategy’, Academy of Management Journal, 33(2), 233–258. Fombrun, C.J. (1996) Reputation: Realizing Value from the Corporate Image, Harvard Business Press, Cambridge, MA.
© 2011 Macmillan Publishers Ltd. 1363-3589
Vol. 14, 1, 15–35
Corporate Reputation Review
33
RepTrak™ Pulse
Fombrun, C.J. (2001) ‘Corporate reputations as economic assets’, in M. A. Hitt, R. E. Freeman and J.S. Harrison (eds.) The Blackwell Handbook of Strategic Management, Blackwell Publishers, Oxford, UK. Fombrun, C.J. (2007) ‘List of lists: A compilation of international corporate reputation ratings’, Corporate Reputation Review, 10(2), 144–153. Fombrun, C.J., Gardberg, N.A. and Sever, J. (2000) ‘The Reputation Quotient: A multi-stakeholder measure of corporate reputation’, Journal of Brand Management, 7(4), 241–255. Fombrun, C.J. and van Riel, C.B.M. (2004) Fame & Fortune: How Successful Companies Build Winning Reputations, Financial Times Prentice-Hall, Upper Saddle River, NJ. Fryxell, G.E. and Wang, J. (1994) ‘The Fortune corporate ‘reputation’ index: Reputation for what?’ Journal of Management, 20(1), 1–14. Gardberg, N.A. (2006) ‘Reputatie, reputation, réputation, reputazione, ruf: A cross-cultural qualitative analysis of construct and instrument equivalence’, Corporate Reputation Review, 9(1), 39–61. Gardberg, N.A. and Fombrun, C.J. (2002) ‘For better or worse: The most visible American corporate reputations’, Corporate Reputation Review, 4(4), 385–391. Gardberg, N.A. and Schepers, D.H. (2008) ‘Do stakeholders detect corporate social performance signals?’, Academy of Management Annual Meeting Proceedings, 1–6. Gupta, V., Hanges, P.J. and Dorfman, P. (2002) ‘Cultural clusters: Methodology and findings’, Journal of World Business, 37(1), 11–15. Helm, S. (2005) ‘Designing a formative measure for corporate reputation’, Corporate Reputation Review, 8(2), 95–109. Hem, L.E., de Chernatony, L. and Iversen, N.M. (2003) ‘Factors influencing successful brand extensions’, Journal of Marketing Management, 19(7/8), 781–806. Highhouse, S., Broadfoot, A., Yugo, J.E. and Devendorf, S.A. (2009) ‘Examining corporate reputation judgments with generalizability theory’, Journal of Applied Psychology, 94(3), 782–789. Jensen, M. and Roy, A. (2008) ‘Staging exchange partner choices: When do status and reputation matter?’ Academy of Management Journal, 51(3), 495–516. Lee, C., Bobko, P., Ashford, S., Xiong, C.Z. and Xiaopeng, R. (2008) ‘Cross-cultural development
34
Corporate Reputation Review
Vol. 14, 1, 15–35
of an abridged job insecurity measure’, Journal of Organizational Behavior, 29(3), 373–390. Nunnally, J.C. and Bernstein, I.H. (1994) Psychometric Theory, 3rd edn., McGraw-Hill, New York. Prabhu, J. and Stewart, D.W. (2001) ‘Signaling strategies in competitive interaction: Building reputations and hiding the truth’, Journal of Marketing Research, 38(1), 62–72. Richins, M.L. (2004) ‘The material values scale: Measurement properties and development of a short form’, Journal of Consumer Research, 31(1), 209–219. Rindova, V.P. and Fombrun, C.J. (1999) ‘Constructing competitive advantage: The role of firm-constituent interactions’, Strategic Management Journal, 20(8), 691–710. Roberts, P.W. and Dowling, G.R. (2002) ‘Corporate reputation and sustained superior financial performance’, Strategic Management Journal, 23(12), 1077–1093. Roster, C.A., Albaum, G. and Rogers, B. (2006) ‘Can cross-national/cultural studies presume etic equivalency in respondents’ use of extreme categories of Likert rating scales?’ International Journal of Market Research, 48(6), 741–759. Schwaiger, M. (2004) ‘Components and parameters of corporate reputation – An empirical study’, Schmalenbach Business Review, 56(1), 46–71. Shamsie, J. (2003) ‘The context of dominance: An industry-driven framework for exploiting reputation’, Strategic Management Journal, 24(3), 199–215. Singh, J. (1995) ‘Measurement issues in cross-national research’, Journal of International Business Studies, 26(3), 597–618. Stanton, J.M., Sinar, E.F., Balzer, W.K. and Smith, P.C. (2002) ‘Issues and strategies for reducing the length of self-report scales’, Personnel Psychology, 55(1), 167–194. Villanueva, J., Yoo, S. and Hanssens, D.M. (2008) ‘The impact of marketing-induced versus wordof-mouth customer acquisition on customer equity growth’, Journal of Marketing Research, 45(1), 48–59. Walsh, G. and Beatty, S.E. (2007) ‘Customer-based corporate reputation of a service firm: Scale development and validation’, Journal of the Academy of Marketing Science, 35(1), 127–143. Walsh, G., Beatty, S.E. and Shiu, E.M.K. (2009) ‘The customer-based corporate reputation scale: Replication and short form’, Journal of Business Research, 62(10), 924–930.
© 2011 Macmillan Publishers Ltd. 1363-3589
© 2011 Macmillan Publishers Ltd. 1363-3589
Vol. 14, 1, 15–35
Ford
Delta Airlines
Google
Harley Davidson
3M
Walt Disney
UPS
General Electric Honeywell
Hilton Hotels
Companies
Mfg.
Services
Sector
Bank of America Allstate
American Express Merrill Lynch MetLife
Financial
Anheuser Busch Coca-Cola Company Philip Morris
Nike
Kraft Foods
Consumer
Table A1: Study 2: Companies Assessed By US General Public
APPENDIX
Merck
Chevron
Johnson & Johnson DuPont
ExxonMobil
Pharma/ Chemical/ Energy
Texas Instruments Intel
Motorola
Microsoft
Dell
Tech
Whirlpool
Deere
Caterpillar
Alcoa
Boeing
Industrial
Starbucks
JC Penney
Safeway
Home Depot
Wal-Mart
Retail
Ponzi, Fombrun and Gardberg
Corporate Reputation Review
35