importance of accurate sales forecasts to efficient inventory management has ... univariate forecasting method, such as exponential smoothing, to produce an initial ..... and reduction in sale failure shows increase in service level. The article [8] ...
International Journal of Computer Applications (0975 – 8887) Volume 10– No.9, November 2010
Purchase-driven Classification for Improved Forecasting in Spare Parts Inventory Replenishment Pradip Kumar Bala Xavier Institute of Management, Bhubaneswar, Xavier Square, Bhubaneswar, INDIA
ABSTRACT Performance of inventory management depends on the accuracy of demand forecasting. There are many techniques used for forecasting demand in retail sale. Advances in data mining application systems have given rise to the use of business intelligence in various domains of retailing. The current research captures the knowledge of classification of the customers using the purchase-based data of customers for improved forecasting. The model developed in this work suggests a technique for forecasting of demands which results in improved performance of inventory. The suggested forecasting model with the inventory replenishment system results in the reduction of inventory level and increase in customer service level. Moreover, the model makes use of purchase driven information instead of customers‟ demographic profile or other personal data for developing the decision tree for forecasting.
General Terms Business Intelligence, DSS
Keywords Forecasting, Inventory, data mining, classification.
1. INTRODUCTION Retail inventory management systems have grown significantly during the last two decades with the advent in intelligent systems for forecasting. However, the growth of two has mostly taken place independently. On one hand, we have very sophisticated inventory management systems and on the other, we have very sophisticated forecasting systems. However, we rarely come across the combination of two sophisticated systems. At the same time, retailing has gone through a period of unprecedented change as customers‟ demands and competition amongst the retailers have intensified in last twenty five years in most of the countries. Over the period, the retail industry has seen a transition from manual merchandise control systems to the first computerized systems. Retailers with the sophisticated computerized systems for better forecasting and improved inventory management have an edge over the others in terms of profitability. Initially, these sophisticated systems were being used only by the supermarkets. Gradually, other retailers found it inevitable to remain competitive in their businesses. India is also not an exception to this movement and it has witnessed a sea change in retail business in last ten years. Data mining has been used for forecasting in retail business using classification and clustering. Classification of the customers is done through induction of decision tree or neural network system. The input variables used in such systems comprise of the demographic profiles of the customers along with other details. It
is felt that collection of such data is extremely difficult in retail business as most people feel reluctant to share data with the merchant. This leads to missing data and noisy data and it leads to poor quality of data. This calls for alternative approaches to look into the problem for the input data needed for classification. The present research work suggests different features which are automatically generated in certain businesses and they can be used for data mining based forecasting of demand. The proposed methodology has been implemented in spare parts inventory management of automotive sector.
2. EXISTING WORKS Greater accuracy in demand forecasting can result in higher profitability, greater competitiveness, enhanced channel relationships, and improved customer satisfaction [1]. The importance of accurate sales forecasts to efficient inventory management has long been recognized. Barksdale and Hilliard found that successful inventory management depends to a large extent on the accurate forecasting of retail sales [2]. Works in [3] and [4] also pointed out that accurate demand forecasting plays a critical role in profitable retail operations and poor forecasting results in under-stock or over-stock that directly affect profitability and competitive position of the retailer. The widely used practice of forecasting demand involves the use of a statistical software system which incorporates a simple univariate forecasting method, such as exponential smoothing, to produce an initial forecast [5]. The common practices and existing literatures include time series decomposition, exponential smoothing, time series regression and autoregressive and integrated moving average (ARIMA) models. Out of these models, seasonal ARIMA model has been the most acceptable forecasting model that results in minimum accuracy and it has been successfully tested in many practical applications. Equivalent ARIMA models can be implemented for the popular Winter‟s additive and multiplicative exponential smoothing models ([6], [7]). Motivated by the advantages of both ARIMA and Artificial neural network (ANN), Luis and Weber developed an additive hybrid forecasting model [8]. The paper models the original time series by ARIMA and error associated with this model forms another time series which was modeled by using ANN. The final hybrid forecast is made by adding ARIMA-based forecast and ANN-based forecast. This outperforms pure ARIMA and pure ANN models. Various data mining applications for inventory management have been suggested in various works. In [9], a method to select inventory items from the association rules has been proposed for cross-selling consideration. Relevance of association rule mining
40
International Journal of Computer Applications (0975 – 8887) Volume 10– No.9, November 2010 in the context of multi-item inventory replenishment has been discussed in ([10], [11], [12]). A decision tree based application in retail sale for investigating the impact of promotion has been used in retail sale ([12], [13]) suggest decision tree based classification to analyze the customers‟ behavior.
3. PROPOSED FORECASTING MODEL The methodology involved in the proposed forecasting model can be described in the following steps. Step-1: Exhaustive list of the “purchase-based parameters” depicting purchase behavior is prepared. These details are used as attributes to describe customers‟ behavior. It is to be noted that all these attributes are not equally important in describing an intended behavior of customers. Step-2: Construction of classes of customers is done for the item/SKU considered for demand forecasting. For the purpose of demand forecasting, classes are to be performed based on the units of purchase for the SKU. For example, two classes of customers may be - those who purchase one unit and those who purchase two units or, more. Step-3: Based on the target classes, feature selection is performed on the database to select top few dominant attributes for the purpose of classification. Step-4: Based on the dominant attributes, decision tree is inducted for classification. Step-5: The original database is segregated based on the classification described by the decision tree developed. It is important to note that description of a customer may fall in the class of purchasing two or more units, while he/she may purchase one unit in some of the transactions. Similarly, description of another customer may fall in the class of purchasing one unit, while he/she may purchase two or more units in some of the transactions. Step-6: For each segregated class, ARIMA (with predictors) is used for forecasting. Step-7: To forecast the overall demand of the item/SKU, forecasts for various classed are summed up. Application of the forecasting model based on decision tree The proposed model has been applied for forecasting demand of one item in an automobile servicing station in the eastern part of India. The automobile servicing station is an authorized servicing station of a reputed automobile company in Asia. The servicing station is of medium size with computerized inventory tracking system and caters mostly to the owners of travel agencies having light passenger vehicles in the locality. The item chosen is „ignition coil‟ which is also called a spark coil. It is an induction coil in an automobile's ignition system which transforms the battery's 12 volts (6 volts in some older vehicles) to a very high voltage needed to spark the spark plugs. Some coils have an internal resistor to reduce the voltage and some rely on a resistor wire or an external resistor to reduce the voltage from the car‟s 12 volt wiring flowing into the coil. The wire which goes from the ignition coil to the distributor and the wires which go from the distributor to each of the spark plugs are called spark plug wires or high tension leads. Ignition coils are generally purchased in bulk by the travel agencies due to bulk discount in purchase and frequent requirement of the item as they own hundreds of
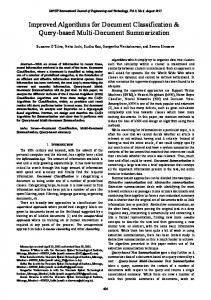
vehicles. The proposed model based on decision tree and ARIMA has been first applied without considering the seasonality and then with the consideration of seasonality. Various other forecasting models based on „ARIMA‟ and „ARIMA with neural network‟ have also been applied. Analysis of demand forecasts for the selected item has been given below. Existing practice of forecasting follows fourteen-day moving average technique for predicting daily demand of the SKU. The retail store was facing frequent cases of sale failures as well as high average of daily stock. To examine the efficacy of daily forecasting, weekly forecasting has been examined for the SKU. For both daily and weekly forecasting, proposed model and other models have been used for forecasting. For daily demand forecasting, the models used are - Five-day moving average (DM-0), Best ARIMA (DM-1), Best seasonal ARIMA (DM-2), Best ARIMA with predictors/regressors (DM3), Best seasonal ARIMA with predictors/regressors (DM-4), Neural network on the errors of the best ARIMA with predictors/regressors (DM-5), Neural network on the errors of the best seasonal ARIMA with predictors/regressors (DM-6), Decision tree based best ARIMA with predictors/regressors (DM7) and Decision tree based best seasonal ARIMA with predictors/regressors (DM-8). Similarly, for weekly demand forecasting, the models used are - Best ARIMA (WM-1), Best seasonal ARIMA (WM-2), Best ARIMA with predictors/regressors (WM-3), Best seasonal ARIMA with predictors/regressors (WM-4), Neural network on the errors of the best ARIMA with predictors/regressors (WM-5), Neural network on the errors of the best seasonal ARIMA with predictors/regressors (WM-6), Decision tree based best ARIMA with predictors/regressors (WM-7) and Decision tree based best seasonal ARIMA with predictors/regressors (WM-8). Decision tree based models (DM-7, DM-8, WM-7 and WM-8) are based on the proposed forecasting model. Other models are based on the existing practices and available literature. Models in DM-5, DM-6, WM-5 and WM-6 are based on the work of [8] which has also been discussed in section 2 of this paper. Eighteen attributes for classification were included in the data. Classes were predefined as – (i) class 1: purchasing one unit, (ii) class 2: purchasing two units, and (iii) class 3: purchasing three or more units. With respect to these classes, the model of feature selection in the data mining software, SPSS Clementine 12.1, was performed on the transaction data. With the feature selection model using Pearson ratio with p-value of 0.05 for finding important factors, the five profile descriptions of the customers are – (i) annual bill of a customer/travel agency in the servicing station, (ii) annual frequency of servicing in the station, (iii) number of cars owned by a customer/travel agency (which is recorded in the database of servicing station as the number of cars visiting the servicing station for maintenance or repair, it may not be the actual number of cars owning), (iv) annual distance travelled by all the cars of a customer/travel agency, (v) number of cars of a customer/travel agency in the warranty period. Based on these five attributes, decision tree as shown in Fig. 1 was developed using the data mining software. In each node, percentage of various classes has been shown within the total transactions represented by the node. However, overall percentage
41
International Journal of Computer Applications (0975 – 8887) Volume 10– No.9, November 2010 in a node shows the percentage of transactions represented by the node out of all the transactions covered. As a result, the overall percentage is not the sum of percentages of three classes in a node. For threshold confidence of 80%, as used in business intelligence practices in the automobile company, three following rules qualify as per the three respective nodes in the decision tree. (a) Node 2: Customers with number of cars to be 112 and number of cars in the warranty period to be 24 or less belong to class 2 (i.e., customers purchasing two units).
%
1
32.25
2
10.46
3 Overall
57.29 100.00
Number of cars 112 or less
more than 112
Node 1
Class
Node 5
%
1
Class
18.84
2
63.05
3
18.11
Overall
58.92
%
1
16.61
2
10.87
3
72.52
Overall
41.08
Number of cars in warranty period 24 or less
more than 24 less than 35
35 or more
Node 3
Node 4
Class
%
yes 1
Class
24.54 56.73 18.73
2 3 Overall
1
14.83
(b) Node 6: Customers with number of cars to be more than 112 and annual frequency to be 355 or less belong to class 2 (i.e., customers purchasing two units). (c) Node 7: Customers with number of cars to be more than 112 and annual frequency to be more than 355belong to class 3 (i.e., customers purchasing three units). Based on the inducted decision tree, only three profiles as given above suggest for belongingness to a class. It is found that node 2 and node 6 suggest for class 2 whereas node 7 suggests for class 3. As per step-5 of the proposed forecasting model, database is to be segregated based on this classification in three parts – First part is given by the profile of node 7, second part is given by node 2 and node 6 (combined), third part is comprised of the rest part of the database.
Node 0 Class
Fig. 1. Classification of customers using decision tree
%
22.39
2
39.80
3
37.81
________________ Overall
14.70
On each segregated part, ARIMA is to be used for forecasting using the models suggested in the proposed schemes of DM-7, DM-8, WM-7 and WM-8. Predictors/regressors, as used in ARIMA, for daily and weekly forecasting have been identified as given below. For daily forecasting, the predictors/regressors used are – Numerical value of date, Number of cars attended, Holiday day Indicator, Pre-holiday Indicator. For weekly forecasting, the predictors/regressors Number of payment days, Number of holidays weekend), Number of the week in the financial year, holidays or pre-holidays in the week, Number of cars the week.
used are(including Number of attended in
The performance of each model has been computed using mean absolute percentage error (MAPE) and normalized mean square error (NMSE). The proposed models along with the existing model in practice and other models available in literature have been compared. Performance has been compared on training dataset of thirty six months and test data set of twelve months. Comparison of daily forecasting and weekly forecasting has been shown in Table I and II respectively. It is found that in both daily and weekly forecasting, the proposed models perform better than other models. Overall, weekly forecasting proves better than the daily forecasting.
4. INVENTORY CONTROL VARIOUS FORECAST MODELS
WITH
Node 2 Class 1
%
Annual frequency
10.69
2
80.25
3
9.06
Overall
29.39
355 or less
more than 355
Node 6 Class 1 2 3 Overall
For a periodic review policy of inventory replenishment, four proposed forecasting models outperforming other models and the existing forecasting model have been compared with respect to two performance indicators – (i) inventory level given by reaching days of inventory (measured as inventory/daily sales average) and (ii) customer service (indicated by percentage of days with sales failure). In fact, customer service level is inversely proportional to „percentage of days with sales failure‟.
Node 7 %
Class
2.45
1
84.33
2
13.22 12.33
%
5.07 9.25 3
Overall
85.68 28.75
42
International Journal of Computer Applications (0975 – 8887) Volume 10– No.9, November 2010 TABLE I: COMPARISON OF DAILY FORECASTING MODELS
Model
Description of the Model for Daily Forecasting
Training Set
Test Set
time‟) before the delivery date. The desired inventory level (T) has to be determined every period by the equation, T = m0 + Zs, where, m0 is the average demand
DM0
5-Day Average Practice)
DM1
ARIMA
40.6
0.54
47.3
0.62
DM2
Seasonal ARIMA
40.1
0.54
46.2
0.59
DM3
ARIMA Predictors
37.5
0.52
46.1
0.59
during (P + L) days, Z is obtained from standard normal distribution table which depends on desired service level and s is standard deviation of the demand during (P + L) days. (P+L) is known as protection period and Zs is the safety stock. Both, the average demand (m0) and the standard deviation (s) are estimated based on the used forecasting model for demand forecast. Using one year‟s sales data, simulation has been done for the inventory level of the product applying the replenishment model as discussed using the proposed models.
DM4
Seasonal ARIMA with Predictors
37.1
0.50
44.4
0.56
For both daily and weekly forecasting, following data has been used.
DM5
Neural Network on ARIMA with Predictors
32.6
0.48
37.7
0.58
DM6
Neural Network on Seasonal ARIMA with Predictors
DM7
Decision Tree based ARIMA with Predictors
25.5
Decision Tree based Seasonal ARIMA with Predictors
24.7
DM8
Moving (Existing
with
MAPE
NMSE
MAPE
NMSE
44.8
0.56
47.5
0.68
P = 10 Days L = 5 Days Service Level = 90% 32.5
0.45
0.34
36.8
28.2
0.52
0.46
The computation for daily forecasting has been shown below. Standard deviation of demand during (P+L) days = Standard deviation of daily forecast demand x √ (P+L) Safety Stock = z x [standard deviation of demand during (P+L) Days]
0.32
28.1
0.43
Target or Desired Inventory Level = T = (Average daily forecast demand) x (P+L) + Safety stock = m0 x (P+L) + Safety stock Order Quantity, Q = T - Inventory Level
TABLE II: COMPARISON OF WEEKLY FORECASTING MODELS Model
Description of the Model for Weekly Forecasting
Training Set
Test Set
MAPE
NMSE
MAPE
NMSE
For using weekly forecasting, as the values of P and L remain same given in days, it is required to convert the weekly figures into daily figures. The computation for weekly forecasting has been shown below. Average daily demand = Average weekly forecast demand/7
WM1
ARIMA
35.9
0.42
38.3
0.48
WM2
Seasonal ARIMA
31.5
0.41
35.6
0.47
Standard deviation of daily demand = Standard deviation of weekly forecast demand/(√7)
WM3
ARIMA Predictors
30.4
0.44
32.0
0.46
Standard deviation of demand during (P+L) days
WM4
Seasonal ARIMA with Predictors
29.4
0.42
33.8
0.46
WM5
Neural Network on ARIMA with Predictors
25.7
WM6
Neural Network on Seasonal ARIMA with Predictors
26.8
0.38
27.5
0.46
WM7
Decision Tree based ARIMA with Predictors
18.5
0.29
22.4
0.36
WM8
Decision Tree based Seasonal ARIMA with Predictors
19.5
0.30
22.1
0.35
with
= Standard deviation of daily demand x √(P+L) Safety Stock = z x [standard deviation of demand during (P+L) Days]
0.44
27.9
0.47
Target or Desired Inventory Level = T = Average daily demand x (P+L) + Safety stock Order Quantity, Q = T - Inventory Level
Comparison of inventory performance based on the four proposed forecasting models (DM7, DM8, WM7, WM8) outperforming other models and the existing forecasting model (DM0) has been shown in Table III. It is found that weekly forecasting models, WM7 and WM8, outperform their counterparts in daily forecasting, DM7 and DM8. However, all four outperform the existing practice. With respect to inventory level given by reaching days, WM7 is found to be slightly better than WM8.
In periodic review policy using the daily forecasting, review of the inventory levels is done for the products every P days and the purchase order has to be sent at least L days (known as „lead
43
International Journal of Computer Applications (0975 – 8887) Volume 10– No.9, November 2010 TABLE III: PERFORMANCE OF INVENTORY REPLENISHMENT SYSTEMS BASED ON VARIOUS FORECASTING MODELS Inventory Performance Indicator
Actual Findings
Model/ Existing Practice
DM0
Simulation Results
DM7
DM8
WM7
WM8
Description of the forecasting Model
5-Day Moving Average (Existing Practice) Decision Tree based ARIMA with Predictors Decision Tree based Seasonal ARIMA with Predictors Decision Tree based ARIMA with Predictors Decision Tree based Seasonal ARIMA with Predictors
Reaching Days (average of Daily inventory/ daily sale)
Number of Sales Failure Days i.e., without products)
Sales Failure (% of Days without products)
48.89
104
28.49
37.21
45
12.33
32.56
36
9.86
27.43
22
6.03
purchase driven information instead of customers‟ demographic profile or other personal data for developing the decision tree for forecasting. It is extremely difficult to collect the information related to customers‟ demographic profile, particularly the confidential ones. Induction of the decision tree is most important feature in the model suggested. Strong rules may not always come for a particular product in the decision tree induced. Features or attributes selected for classification plays a big role in shaping the decision tree. Some of the important features may be overlooked and this may result in an appropriate decision tree. Care should be taken while identifying the attributes for classification prior to feature selection. In this context, the proposed model is appropriate for items for which a substantial proportion of sale is attributed strongly to a particular profile or profiles. For such cases, the suggested model can be extended further to understand the dynamics of migration and immigration of people with specific profiles of interest in a locality. Using the weak rules from the induced decision tree for demand forecasting provides scope for further work.
6. REFERENCES [1] Moon, M. A., Mentzer, J. T., and Smith, C. D. 2003. Conducting a sales forecasting audit. International Journal of Forecasting, Vol. 19, Issue 1, pp. 5–25. [2] Barksdale, H.C., Hilliard, J.E., 1975. A cross-spectral analysis ofretail inventories and sales. Journal ofBusiness 48 (3), 365–382. [3] Thall, N., 1992. Neural forecasts: A retail sales booster. Discount Merchandiser 23 (10), 41–42. 29.92
25
6.85
5. CONCLUSIONS The proposed business intelligent system for demand forecasting proves to give more accurate prediction for future demands compared to the existing models and practices in spare parts inventory management. This helps inventory managers to better manage their supply chain performance by reducing reaching days and service level simultaneously. Reaching day as a measure of inventory level is generally reduced successfully by the retailers at the cost of service level in most of the places. However, the model in this paper improves both the performance indicators simultaneously. Reduction of reaching days implies reduction in inventory level and reduction in sale failure shows increase in service level. The article [8] had shown that ARIMA with neural network for errors outperforms the models based on pure ARIMA or pure neural network. The model proposed in this work outperforms all these models. Information on the customers‟ purchase pattern has been taken into account by the model while forecasting demand. In the present day order, where, most of the inventory management practices are taking resort to decision tree for various uses in CRM (Bala, 2009b, Chang et al., 2009), enhancing inventory management with the use of decision tree rules will be an additional application for increasing profitability of operations. Another important feature of the model is that it makes use of
[4] Agrawal, D., Schorling, C., 1996. Market share forecasting: An empirical comparison ofartificial neural networks and multinomial logit model. Journal ofRetailing 72 (4), 383– 407. [5] Robert Fildes, Paul Goodwin, Michael Lawrence and Konstantinos Nikolopoulos 2009. Effective forecasting and judgmental adjustments: an empirical evaluation and strategies for improvement in supply-chain planning. International Journal of Forecasting, Volume 25, Issue 1, pp. 3-23. [6] McKenzie, E., 1984. General exponential smoothing and the equivalent ARIMA process. Journal of Forecasting 3, 333– 444. [7] Bowerman, B.L., O‟Connell, R.T., 1993. Forecasting and Time Series: An Applied Approach, 3rd Edition. Duxbury Press, Belmont, CA. [8] Luis Aburto, Richard Weber, 2007. Improved supply chain management based on hybrid demand forecasts. Applied Soft Computing 7 (2007) 136–144. [9] Wong, W., Fu, A.W., and Wang, K., 2005, Data Mining for Inventory Item Selection with Cross-Selling Considerations. Data Mining and Knowledge Discovery, 11, (1), 81-112. [10] Bala, P. K., Sural, S., and Banerjee, R. N., 2010, Association rule for purchase dependence in multi-item inventory. Production Planning & Control, 21 (3), 2010, pp. 274-285
44
International Journal of Computer Applications (0975 – 8887) Volume 10– No.9, November 2010 [11] Bala, P. K., 2009a, Data Mining for Retail Inventory Management. In S. I. Ao, and L. Gelman (ed.) Advances in Electrical Engineering and Computational Science, LNEE Series, Vol. 39, Springer, Netherlands, pp. 587-598. [12] Bala, P.K. , 2009b, A Data Mining Model for investigating the Impact of Promotion in Retailing, Proceedings of IEEE International Advance Computing Conference, 2009, Patiala, India, March 6-7, 2009, pp. 670-674, ISBN: 978-1-42442927-1. [13] Chang, C. W., Chin-Tsai Lin and Lian-Qing Wang, 2009. Mining the text information to optimizing the customer relationship management. Expert Systems with applications, 36 (2), part-1, pp. 1433-1443.
Pradip Kumar Bala is an Associate Professor in Xavier Institute of Management, Bhubaneswar (XIMB), India. He received his Ph.D., M.Tech. and B.Tech (Hons.) from IIT, Kharagpur, India. His primary research interest is on the algorithms of data mining and its business applications in various domains like inventory management, designing promotional offers in retail sale etc. His several papers on purchase dependency in retail inventory management and retail promotion have been published in reputed international journals and conferences. One of his papers has been awarded with „certificate of merit‟ in World Congress on Engineering -2008, organized by IAENG in London.
45