Jun 6, 2001 - QCD Results from the DELPHI Measurements of. Event Shape and Inclusive Particle Distributions at the highest LEP energies. O. Passon1 ...
DELPHI Collaboration
DELPHI 2001- 065 CONF 493 6 June 2001
QCD Results from the DELPHI Measurements of Event Shape and Inclusive Particle Distributions at the highest LEP energies O. Passon1 , J.Drees1, U.Flagmeyer1, K.Hamacher1 , R.Reinhardt1 and D.Wicke2 1 Fachbereich Physik, Bergische Universitat-GH Wuppertal Gau�stra�e 20, 42097 Wuppertal, Germany 2 CERN, CH{1211 Geneva 23, Switzerland
Abstract
Inclusive spectra and infrared and collinear safe event shape distributions are determined from the data taken in 2000 at centre of mass energies between 200 GeV and 208 GeV . From the event shapes, the strong coupling �s is extracted in O(�2s ) and in NLLA. Comparing these measurements to those obtained at and around MZ and other LEP2 data, the energy dependency (running) of �s is accessible.
Conference contribution for EPS HEP, 12{18 July 2001, Budapest, Hungary and Lepton Photon 01 23{28 July, Rome, Italy
1 Introduction In 2000 LEP operated at centre of mass energies between 200 and 209 GeV. This note presents preliminary results on the measurements of event shape distributions and inclusive particle spectra at these energies. From the hadronic event shapes �s is extracted. Together with the results from previous measurements[1, 2] at other LEP2 energies and LEP1 data a test of energy dependencies as predicted by QCD, namely the running of �s and the energy evolution of � �, the maximum of the �p = log x1p distribution , is performed. In section 2 the selection of hadronic events, the determination of the centre of mass energy, the correction procedures applied to the data, and for energies above the WW threshold the suppression of W+ W? events are brie y discussed. Section 3 contains the measurement of the inclusive hadronic spectra. The energy dependence of � � is discussed. Section 4 presents event shapes and the comparison of the data with predictions from qq�based hadronic generators. Measurements of �s using various techniques and the running of �s, as determined using di�erent methods, are presented in section 4.
2 Selection and correction of hadronic data The analysis is based on data taken with the DELPHI detector in the year 2000 at centre of mass energies between 200 GeV and 209 GeV. The data can be reasonably split into two di�erent energy regimes, corresponding to a mean energy of 204.9 and 206.8 GeV respectively. In the following these data sets are denoted as 205 and 207 GeV. The integrated luminosities and cross sections are given in table Table 1. DELPHI is a hermetic detector with a solenoidal magnetic eld of 1.2 T. The tracking detectors, situated in front of the electro-magnetic calorimeters are a silicon micro-vertex detector VD, a combined jet/proportional chamber inner detector ID, a time projection chamber TPC as the major tracking device, and the streamer tube detector OD in the barrel region. The forward region is covered by silicon mini-strip and pixel detectors (VFT) and by the drift chamber detectors FCA and FCB. The electromagnetic calorimeters are the high density projection chamber HPC in the barrel, and the lead-glass calorimeter FEMC in the forward region. Detailed information about the design and performance of DELPHI can be found in [3, 4]. In order to select well measured charged particle tracks, the cuts given in the upper 205 GeV 207 GeV ? 1 L 75:24 pb 131:50 pb?1 �qq� 81:04 pb 79:49 pb p �qq� ( s >0:9ps) 17:40 pb 17:07 pb �WW 18:89 pb 18:93 pb Number of events 1003 1699 Ecm
0
Table 1: Total cross sections �qq� and �WW as used in the simulation, high energy cross sections �qq� (ps >0:9ps) as derived from the MC, integrated luminosities L, and nally selected (non-radiative) hadronic QCD events for the two energies. 0
1
0:2 GeV � p � 100 GeV �p=p � 1:0 measured track length � 30 cm distance to I.P in r� plane � 4 cm distance to I.P. in z � 10 cm Event Ncharged � 7 selection 25� � �Thrust � 155� Etot � 0:50Ecm ps0 � 90%E ISR rejection cm rec WW rejection Ncharged > 500Bmin + 1:5 Ncharged � 42 Track selection
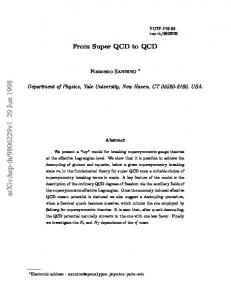
Table 2: Selection of tracks and events. p is the momentum, �p its error, r the radial distance to the beam-axis, z the distance to the beam interaction point (I.P.) along the beam-axis, � the azimuthal angle, Ncharged the number of charged particles, �Thrust the polar angle of the thrust axis with p respect to the beam, Etot the total energy carried pby charged and neutral particles, s0rec the reconstructed centre of mass energy, Ecm = s the nominal centre of mass energy, and Bmin is the minimal jet broadening. The rst two cuts apply to charged and neutral particles, while the other track selection cuts apply only to charged particles. part of Table 2 have been applied. The cuts in the lower part of the table are used to select e+e? ! Z= ! qq� events and to suppress background processes such as two-photon interactions, beam-gas and beam-wall interactions, leptonic nal states and initial state radiation (ISR) and WW pair production. At energies above 91.2 GeV, the high cross section of the Z resonance peak raises the possibility of hard ISR allowing the creation of a nearly on-shell Z boson. These \radiative return events" constitute a large fraction of all hadronic events. The initial state photons are typically aligned along the beam direction and are rarely identi ed inside the detector. In order to evaluate the e�ective hadronic centre of mass energy of an event, considering ISR, an algorithm called Sprime+ is used [5]. Sprime+ is based on a t imposing four-momentum conservation to measured jet four-momenta (including estimates of their errors). Several assumptions about the event topology are tested. The decision is taken according to the �2 obtained from the constrained ts with di�erent topologies. Figure 1(left) shows the spectra of the calculated energies for simulated and measured events at 205 GeV. The agreement between data and simulation is very good for the high energies relevant to this analysis, while the peak around MZ appears to be slightly shifted p in the simulation. A cut on the reconstructed centre of mass energy s0rec � 90%Ecm is applied to discard radiative return events (see Table p2). Simulation shows that this p0 cut keeps more than 96% of the events p pwithout ISR ( s ? s < 0:1 GeV), giving a contamination with events having s ? s0 > 10 GeV of less than 15%. Two photon events are strongly suppressed by the cuts. Leptonic background was found to be negligible in this analysis. 2
1/N dN/d(ECM)
205 GeV
60
0.06
Nch=500Bmin+1.5 Nch=7 Nch=42
40
four fermion MC (semileptonic decays)
20
0.05
Ncharged
DELPHI 205 GeV (preliminary) data
0.04
QCD+4F MC four fermion MC
0 70
four fermion MC (hadronic decays)
60 50 40 30
0.03
20 10 0
0.02
60
QCD MC
40 0.01
20
0 0
60
80
100
120
140
160
180
200
0
0.025
0.05
0.075
0.1
0.125
0.15
0.175
0.2
220
ECM [GeV]
Bmin
p
Figure 1: Left: Reconstructed centre of mass energy ECM = s0. Right: Simulation of four fermion background and QCD events in the Ncharged {Bmin plane. The lines indicate the cut values chosen. Since the topological signatures of QCD four jet events and hadronic WW events (and other four fermion (4F) backgrounds) are similar, no highly e�cient separation of the two classes of events is possible. Furthermore any WW rejection implies a severe bias to the shape distributions of QCD events, which needs to be corrected by MC simulation. By applying a cut on an observable calculated from the narrow event hemisphere only, the bias to event shape observables mainly sensitive to the wide event hemisphere is reduced. Having used this kinematic information there is essentially only one observable left, which can help to reduce the 4F background further. This is the charged multiplcity. The two dimensional cut in the Ncharged {Bmin plane exploits the di�erent correlation between this observable in QCD and four fermion events, as shown in Figure 1 (right). Especially some further discriminative power against semileptonic decaying 4F events is gained. The lines indicate the cut values chosen. By this cut almost 90% of the four fermion background can be suppressed. The remaining WW contribution is estimated by Monte Carlo generators and subtracted from the measurement. The simulations are normalised using the cross sections given in Table 1. The remaining detector and cut e�ects are unfolded using simulations. The in uence of detector e�ects was studied by passing generated events (Jetset/Pythia [6] using the DELPHI tuning described in [7]) through a full detector simulation (Delsim [3]). These Monte Carlo events are processed with the reconstruction program and selection cuts as are the real data. In order to correct for cuts, detector, and ISR e�ects a bin by bin acceptance correction C , obtained from e+e? ! Z= ! qq� simulation, is applied to the data: h(f ) Ci = i gen;noISR (1) h(fi )acc 3
where h(fi)gen;noISR represents bin i of the shape distribution f generated with the tuned p generator. The subscript noISR indicates that only events without relevant ISR ( s ? p0 s < 0:1 GeV) enter the distribution. h(fi )acc represents the accepted distribution f as obtained with the full detector simulation.
3 Inclusive Spectra Inclusive stable hadron spectra are highly sensitive to properties of the hadronization process and to resonance decays as well as to details of the parton shower. Here they depend on the amount of large angle and collinear gluon radiation as well as on the coherence of gluon radiation. These measurements therefore provide rigid constraints to the models of the hadronization process. Direct comparisons of QCD calculations su�er from the dependence of inclusive distributions to infrared and collinear divergencies. Studies of the energy evolution of inclusive spectra here provide a new quality because the divergent terms may be factorized out and the energy dependence then can be more directly compared to perturbative QCD predictions. A comprehensive comparision of inclusive distributions with model expectations is presented as a function of the particle momentum p, the logarithm of the scaled hadron momentum �p = ln(1=xp) (with xp = p=pbeam), the rapidity with respect to the Thrust axis yt = 21 ln EE?+pp as well as the transverse momenta (pint , pout t ) with respect to the thrust-axes. p and E are the particle momenta and energies respectively. The energies have been computed assuming the charged particles to be pions. Systematic errors have been estimated similar as in [2]. Figure 2 shows the �p, yt, pint and pout t spectra as determined from the 205 GeV data . The data are compared to the JETSET, HERWIG and ARIADNE fragmentation models as tuned by DELPHI at Z energy. The shaded areas display the size of the WW and ZZ background which was subtracted from the data. The upper inset in these plots indicates the size of the correction factor applied to the data. The lower inset presents the ratio of the high energy data to the corresponding results at the Z. This ratio is again compared to the model predictions. The models describe all inclusive spectra measured at the highest energies very good, as well as the energy evolution from the Z-peak (see lower inset of Fig. 2). The most prominent change in the �p distribution (Fig. 2a) is an increase at large �p (i.e. low xp). In the rapidity distribution (Fig. 2b) the expected shift of the edge of the distribution to higher values can clearly be observed, as well as a slight increase in the plateau. This change likewise the strong increase in the transverse momentum distributions at large p? (Fig. 2c and d) is due to stronger gluon radiation in the high energy events. MLLA provides a de nite prediction for the evolution of the maximum, � �, of the �p distribution with energy. As hadronization and resonance decays are expected to act similarly at di�erent centre of mass energies, the energy evolution of � � is expected to be insensitive to non-perturbative e�ects. A small correction is to be expected, however, due to varying contribution of heavy quark events. These chain decays are known to shift � � di�erent from ordinary resonance decays. This shift also di�ers for the individual stable particle species due to the di�erent masses. So far in this note the in uence of heavy decays is neglected. k
k
4
yt corr.fac.
corr.fac.
ξp=log(1/xp) 1.5 1.25 1
1.5
1
0.5 9 8 7 6
a) DELPHI (preliminary) 205 GeV
5 4
1/N dn/dy
1/N dn/dξp
0.75
charged particles
0.5
b)
DELPHI 205 GeV
9
charged particles
8
Jetset 7.4 PS
Jetset 7.4 PS
Herwig 5.8
3
7
Herwig 5.8
Ariadne 4.08 2
Ariadne 4.08
6
4F background
4F background 5
1 0.9 0.8 0.7 0.6
4
3
0.5 0.4
2 0.3 1
205GeV/ 91GeV
205GeV/ 91GeV
0.2
3 2 1 1
2
3
4
5
6
ξp
0 4
2
0.5
1
1.5
2.5
3
3.5
4
4.5
5
yt ptout (Thrust)
corr.fac.
ptin (Thrust) corr.fac.
2
1.4 1.2 1
1.5
1/N dn/dptout
1/N dn/dptin
1 0.8
c) DELPHI 205 GeV 10
charged particles
10 2
d)
DELPHI 205 GeV charged particles Jetset 7.4 PS
Jetset 7.4 PS
10
Herwig 5.8
Herwig 5.8
Ariadne 4.08
Ariadne 4.08
4F background
4F background 1 1
10
-1
205GeV/ 91GeV
205GeV/ 91GeV
10 7.5 5 2.5
1
2
3
4
5
6
7
ptin [GeV]
-1
6 4 2 0.25
0.5
0.75
1
1.25
1.5
1.75
2
2.25
2.5
ptout [GeV]
Figure 2: Inclusive spectra at 205 GeV, the shaded area displays the acceptance corrected WW and ZZ background which is subtracted from the data. 5
ξ*
4.5
4.25
DELPHI
4
3.75
3.5
MLLA (Λeff = 200 MeV) phase space
3.25
DELPHI 3
ALEPH L3
2.75
TASSO 2.5
2.25
25
50
75
100
125
150
175
200
√s (GeV)
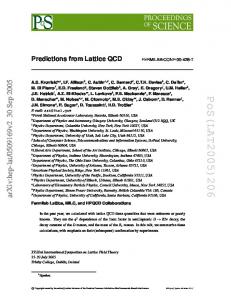
Figure 3: Energy evolution of the �p peak position. The �e� value has been obtained from a t of the MLLA/LPHD prediction (2). The phase space prediction is described in the text. The � � values who enter this analysis were determined by tting the Fong{Webber parametrisation [8]. The �p range tted was restricted to the part of the distribution close to the maximum where the distribution value was bigger than 60% of the maximum. To avoid systematic di�erences due to di�erent strategies to determine � � the same prodedure has also been performed for the low energy data [9, 10]. One obtains � �(205 GeV) = 4.273 � 0.050 and � �(207 GeV) = 4.277 � 0.040, where the statistical and systematic errors are added in quadrature. The full line in Fig. 3 is a t of the MLLA expectation
p p
� � = 0:5 � Y + C � Y
? C + O(Y ? ) 3 2
(2)
to the data. Here Y = ln(Ebeam=�e� ) and �e� is an e�ective scale parameter. From this t �e� = 200 � 3 MeV. The quantity C depends weakly on the number of active avours ( C (Nf = 3) = 0:2915, C (Nf = 5) = 0:3513). The results are presented for Nf = 3 since the light quarks dominate quark-pair production in the cascade. The dashed line in Fig. 3 represents the slope of the phase space expectation � � = a + Y . Due to angular ordering of gluon bremsstrahlung the rise in � � is slower in the MLLA prediction than in this scenario. The data clearly prefer the MLLA prediction, although the � � values above 200 GeV overshoot the full line. The �2=ndf of 1:3 is still reasonable.
6
4 Event shape distributions Selected event shape distributions at 205 and 207 GeV are shown in Figure 4. The exact de nitions of the observables used are comprehensively collected in Appendix A of [7]. The data in Figures 4 are corrected to be comparable with pure e+e? ! Z= ! qq� simulation of charged and neutral hadron production. The amount of WW-background that was subtracted to obtain the nal data points is given as a histogram line. The acceptance corrections are plotted in the upper inset. The plots show a fair agreement between the data and Monte Carlo models.
5 Determination of �sfrom event shapes From event shape distributions, �s is determined by tting an �s dependent QCD prediction folded with a hadronisation correction to the data. As QCD predictions O(�s2), pure NLLA, and the combined O(�s2)+NLLA in ln R-scheme are employed [11, 12, 13]. The hadronisation correction is calculated using the Jetset PS model (Version 7.4 as tuned by DELPHI [7]). The QCD prediction is multiplied in each bin by the hadronisation correction f Sim:(Ecm) Chad (Ecm ) = had , (3) f Sim:(E ) part
cm
Sim:(E ) (f Sim:(E )) is the model prediction on hadron (parton) level at the where fhad cm part cm centre of mass energy Ecm. The parton level is de ned as the nal state of the parton shower created by the simulation. The t ranges used for the di�erent QCD predictions are shown in Figure 5. The upper limit of the range used for O(�s2)+NLLA is reduced with respect to previous publications [14, 15] in order to reduce the systematic uncertainties due to WW background. The lower limit is chosen such that the �2 =ndf for the QCD t was reasonable at LEP2 energies, while maintaining the results at the Z-peak stable. The ranges for pure NLLA and O(�s2) ts are chosen to be distinct, so that the results are statistically uncorrelated. Their limit is taken from [16], where the size of hadronisation correction, the size of the B -coe�cient, and the stability under t range changes is considered. 2 results In [16] it has been shown that xing the renormalisation scale to �2 = Ecm in a marginal description of the data. Therefore, the experimentally optimised scales 2 are determined from the LEP1 data and are used for the O(�2 ) ts to the x� = �2 =Ecm s high energy data for both observables individually. In contrast to the NLLA and the combined NLLA+O(�s2 ) ts, � is set equal to Ecm, so that these results can be compared to other experiments more directly. The scale errors are calculated by varying x� from 0.25 to 4. An error from the in uence of the used hadronisation model is estimated by calculating Chad with Jetset and Ariadne. The resulting two values of �s are averaged to get the central value, half of their di�erence is added in quadrature to the systematic error. The �s values evaluated from the distributions are given in Table 4 and plotted in Figure 6. The QCD expectation is in fair agreement with the data
7
Mhigh2/Evis2 corr.fac.
corr.fac.
1-Thrust 1.5 1
1 0.5
a)
1/N dN/d(Mhigh2/Evis2)
1/N dN/d(1-T)
0.5
1.5
DELPHI 205 GeV
10
data Jetset 7.4 PS Herwig 5.8
b)
DELPHI 205 GeV
10
data Jetset 7.4 PS Herwig 5.8
Ariadne 4.08
Ariadne 4.08 1
1
10
-1
10
-2
(MC-Data)/Data
(MC-Data)/Data
10
1 0
0
0.05
0.1
0.15
0.2
0.25
0.3
0.35
-1 0
0.05
0.1
0.15
0.2
0.25
0.3
10
-1
-2
1 0
0
0.05
0.1
0.15
0.2
0.25
0
0.05
0.1
0.15
0.2
0.25
0.35
1-T
corr.fac.
corr.fac.
1
0.35
1.5 1 0.5
c)
1/N dN/d(Bsum)
1/N dN/d(Bmax)
0.5
DELPHI 207 GeV data
10
Jetset 7.4 PS
d)
DELPHI 207 GeV data
10
Jetset 7.4 PS
Herwig 5.8
Herwig 5.8
Ariadne 4.08
Ariadne 4.08
1
1
-1
10
(MC-Data)/Data
(MC-Data)/Data
0.3
Bsum
1.5
1 0
0.35
Mhigh2/Evis2
Bmax
10
0.3
-1
0
0.05
0.1
0.15
0.2
0.25
0.3
-1 0
0.05
0.1
0.15
0.2
0.25
0.3
Bmax
-1
1 0
0
0.05
0.1
0.15
0.2
0.25
0
0.05
0.1
0.15
0.2
0.25
0.3
-1 0.3
Bsum
2 ) Figure 4: Event shape distributions of 1-Thrust (1 ? T ), Heavy Jetmass (Mh2 =Evis at 205 GeV and of the Wide Jetbroadening (Bmax) and Total Jetbroadening (Bsum) at 207 GeV. The upper inset shows the acceptance corrections. The middle part shows data, simulation and four fermion background. The lower part shows the relative error together with the deviation between the data and the di�erent MC models.
8
d�s?1 =d log(Ecm ) 1:07 � 0:16 � 0:19 1:55 � 0:17 � 0:27 1:35 � 0:12 � 0:18 1:27 0:90
Theory used for measurement O(�s2) NLLA O(�s2 )+NLLA (ln R-scheme) QCD expectation QCD+Gluinos expectation
p
Table 3: Results for the slope a when tting the function 1=(a ln s + b) to �s values obtained for the di�erent energies. The theoretical expectation is calculated in 2nd order. 5.1
The running of
�s
The determination of �s at di�erent energies allows to test the predicted scale dependence of the coupling due to higher order e�ects. The logarithmic energy slope is given by: d�s?p1 = 2b (1 + b � + � � �) 0 1 s d ln s
(4)
p
Thus in leading order this quantity is independent of �s and s, and twice the coe�cient b0 of the QCD function (2b0 = 1:22). Evaluating this equation in second order gives p a slight dependence on �QCD pand the energy scale. With s = 145 GeV and �QCD = 0:24 GeV one yields d�s?1/dln s=1.27. Table 3 gives the slopes when tting the function p 1=(a ln s + b) to the �s values. The results are in good agreement with the QCD expectation.
6 Summary A measurement of inclusive spectra and event shape distributions is presented as obtained from data taken in 2000 at centre of mass energies of 205 and 207 GeV. The results are compared to previous measurements at centre of mass energies between 91 and 200 GeV . Fragmentation models describe the energy evolution of the inclusive spectra well. The energy evolution of the maximum of the �p distribution, � �, is in fair agreement with the MLLA prediction. This provides evidence, that e�ects of coherent gluon radiation in the parton shower process manifest themself on hadron level. The strong coupling constant �s has been determined from the event shape distribu2 using O(�2 ), NLLA, and combined QCD predictions (see Table 4). tions of 1 ? T , Mh2 =Evis s z
NLLA+O(�2s ) (ln R}| -Scheme)
0 .03 .09 | {z } | NLLA
{z
O( s ) �2
z
{
0.24 }
0.5
NLLA+O(�2s ) (ln R-Scheme) }|
{
0 .02 .04 0.20 {z } |{z}| 2 NLLA O(�s )
1?T
0.5
2 Mh2 =Evis
Figure 5: Fit ranges chosen for tting �s from di�erent QCD predictions of 1 ? T and 2 distribution. Mh2 =Evis 9
The comparison of �s as measured at the Z and at higher energies con rms that the energy dependence (running) of the strong coupling is consistent with the QCD expectation.
10
Ecm
205 GeV
Theory O(�s2 ) NLLA
O(�s2 )+NLLA
(ln R-scheme) 207 GeV O(�s2 ) NLLA
O(�s2 )+NLLA (ln R-scheme)
QCD-parameter �s (205 GeV) �s (MZ ) �s (205 GeV) �s (MZ ) �s (205 GeV) �s (MZ ) �s (207 GeV) �s (MZ ) �s (207 GeV) �s (MZ ) �s (207 GeV) �s (MZ )
Result 0.1067 0.1199 0.1093 0.1232 0.1083 0.1219 0.1073 0.1209 0.1079 0.1216 0.1096 0.1238
� � � � � � � � � � � � �
stat 0.0046 0.0058 0.0055 0.0062 0.0033 0.0042 0.0035 0.0044 0.0046 0.0059 0.0026 0.0033
� � � � � � � � � � � � �
sys 0.0031 0.0033 0.0036 0.0038 0.0021 0.0026 0.0032 0.0034 0.0036 0.0038 0.0036 0.0038
� � � � � � � � � � � � �
scale 0.0023 0.0027 0.0047 0.0059 0.0034 0.0043 0.0023 0.0027 0.0049 0.0062 0.0037 0.0048
Table 4: �s as obtained from distributions by averaging the results from the 1 ? T and 2 . Mh2 =Evis
11
0.13
αs
αs
0.13 DELPHI (preliminary)
DELPHI (preliminary)
0.125
0.125
0.12
0.12
0.115
0.115
0.11
0.11
0.105
0.105
0.1
0.1
0.095
0.095
0.09
NLLA+O(αs2) (logR)
O(αs2)
0.09
world average
0.085
0.085
1/logE fit
100
150
αs
0.08
world average
0.08
200
√s (GeV)
1/logE fit
100
150
200
√s (GeV)
0.13 DELPHI (preliminary)
0.125 0.12 0.115 0.11 0.105 0.1 0.095 pure NLLA
0.09 world average
0.085 0.08
1/logE fit
100
150
200
√s (GeV)
Figure 6: Energy dependence of �s as obtained from event shape distributions using di�erent theoretical calculations. The errors shown are statistical only. The band shows the QCD expectation when extrapolating the world average to other energies. The t is explained in the text. 12
References
[1] DELPHI Coll., P. Abreu et al. Phys.Lett. B456(1999) 397. [2] DELPHI Coll., P. Abreu et al. Phys.Lett. B459(1999) 397. [3] DELPHI Coll., P. Abreu et al. The DELPHI detector at LEP. Nucl. Instr. Meth. A303(1991) 233. [4] DELPHI Coll., P. Abreu et al. Performance of the DELPHI detector. Nucl. Instr. Meth. A378(1996) 57. [5] DELPHI Coll., P. Abreu et al. Nucl. Instrum. Methods Phys. Res. A 427(1999) . [6] T. Sjostrand. Comp. Phys. Comm. 39(1986) 347. [7] DELPHI Coll., P. Abreu et al. Tuning and test of fragmentation models based on identi ed particles and precision event shape data. Z. Phys. C73(1996) 11. [8] C. P. Fong and B. R. Webber. Higher order corrections to hadron energy distributions in jets. Phys. Lett. B229(1989) 289. [9] ALEPH Coll. QCD studies with e+e? annihilatin data from 130 to 172 GeV. Ref. #629 contributed to the EPS HEP conference in Jerusalem, 1997. [10] ALEPH Coll. Phys.Rep. 294(1998) 1. [11] R. K. Ellis, D. A. Ross, and A. E. Terrano. Nucl. Phys B178(1981) 412. [12] S. Catani, G. Turnock, B. R. Webber, and L. Trentadue. Thrust distribution in e+e? annihilation. Phys. Lett. B263(1991) 491. [13] S. Catani, G. Turnock, and B. R. Webber. Heavy jet mass distribution in e+e? annihilation. Phys. Lett. B272(1991) 368. [14] DELPHI Coll., P. Abreu et al. Determination of �s in second order QCD from hadronic z decays. Z. Phys. C54(1992) 21. [15] DELPHI Coll., P. Abreu et al. Z. Phys. C59(1993) 21. [16] DELPHI Coll., P. Abreu et al. E.Phys.J. C14(2000) 557.
13