QFD: an interactive algorithm for the prioritization of product's technical design characteristics. Fiorenzo Franceschini. Poliytecnico di Torino, Dipartimento di ...
QFD: an interactive algorithm for the prioritization of product's technical design characteristics
Fiorenzo Franceschini Poliytecnico di Torino, Dipartimento di Sistemi di Produzione ed Economia dell'Azienda, Turin, Italy Sergio Rossetto Poliytecnico di Torino, Dipartimento di Sistemi di Produzione ed Economia dell'Azienda, Turin, Italy
Keywords
Quality function deployment, Algorithms, Design
Abstract
The paper is concerned with the problem of the ``prioritization'' of technical design characteristics of a product. An interactive algorithm has been developed with the aim to better support the engineering design process by means of quality function deployment (QFD). The algorithm tries to soften customer approach to QFD in those situations in which customers are not able to give a ``significant'' evaluation of the relative importance of their requirements. The method allows determining a ranking order of design characteristics without the artificial conversion of symbols contained in the relationship matrix, and without the use of explicit information concerning the relative degree of importance of customer requirements. A simple numerical application is also provided.
Received October 1999 Revised June 2000 Accepted February 2001
Integrated Manufacturing Systems 13/1 [2002] 69±75 # MCB UP Limited [ISSN 0957-6061] [DOI 10.1108/09576060210411521]
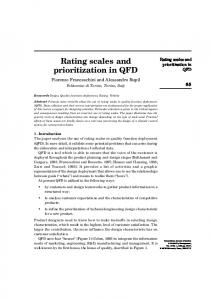
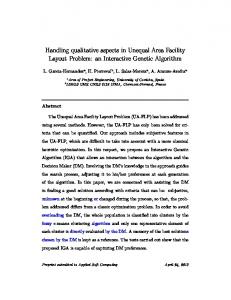
Introduction Many firms realize that getting high quality products to customers in a timely manner is crucial for their survival in the competitive marketplace. Product development process is a complex managerial process that involves multifunctional groups with different points of view. It is accomplished through a series of charts to integrate the information needs of marketing, engineering, R&D, manufacturing and management. Quality function deployment (QFD) is an innovative tool which stresses crossfunctional integration and provides a means of translating product requirements into design specifications (Sullivan, 1986; Akao, 1990; Pahl and Beitz, 1996; Ertas and Jones, 1993; Franceschini and Rossetto, 1998). It is well known by its first chart, the so called House of Quality (HoQ), which is illustrated in Figure 1 (Hauser and Clausing, 1988; Cohen, 1995; Franceschini, 1998). Customer requirements and their degree of importance are represented on the left side of HoQ. The technical design characteristics are reported on the top of HoQ. The matrix in the main body of the HoQ identifies the relationship matrix which highlights the mutual influence between customer requirements and product engineering/ design characteristics. The ``roof'' part of HoQ shows the correlation among technical characteristics. The right side of HoQ reports a competitive benchmarking on each customer attribute for competitor's product (competitive benchmarking assessment). Target levels of engineering characteristics are determined by all the information contained in the HoQ. Despite its apparent easiness, if information contained in the HoQ is not sufficiently ``accurate'', QFD can become a The current issue and full text archive of this journal is available at http://www.emeraldinsight.com/0957-6061.htm
``misleading'' tool. Its correct and effective use needs a careful design analysis and an accurate data collection. After customer identification, the first step of the QFD process is the setting up of procedures for gathering information by customers (Griffin and Hauser, 1992). The second step concerns data management and elaboration. Typical examples of these activities are the definition of customer requirements and the evaluation of their relative degree of importance. Methods for determining the importance ratings of technical characteristics are dependent on the representation of the symbols contained in the relationship matrix. If symbols are converted in a 1-3-9 numerical scale, we may use the simple weighted sum method (Akao, 1990; Wasserman, 1993). Such procedures can become arbitrary in those situations in which the customer is not able to give a significant evaluation of his requirements and his preference system is not explicitly known. The results of this forcing can lead to a distortion of the design process (Franceschini and Rossetto, 1995; Franceschini and Rupil, 1999). In fact, the customer is forced to give an unnatural evaluation on a conventional scale unnatural to him (Larichev et al., 1993, 1995). At the same time, it is dangerous to carry out an ex-post conversion of customer ordinal judgements into numerical scores, because of the introduction of an exogenous and extraneous metric to the judgements formulated (Fraser, 1994; Franceschini and Rossetto, 1995). The extreme consequences of the use of inadequate conversions can lead to a setting up of a design of a product for an ``ideal'' customer which is different from the real one. The soft issue is that we do not know the ``distance'' between the two designs. With specific reference to QFD, the introduction of weights (Vansnick, 1986) to assign a relative degree of importance to customer requirements can lead to a
[ 69 ]
Fiorenzo Franceschini and Sergio Rossetto QFD: an interactive algorithm for the prioritization of product's technical design characteristics Integrated Manufacturing Systems 13/1 [2002] 69±75
prioritization order of technical characteristics, which does not reflect his own real intentions (see methods based on the analytic hierarchy process (Akao, 1990; Dyer, 1990; Saaty, 1990)). With the aim to better support and facilitate the engineering design process, the paper presents an interactive algorithm, which tries to soften customers' approach to QFD. More in detail, it allows determining a ranking order of design characteristics without the artificial conversion of symbols contained in the relationship matrix, and without explicitly knowing the relative degree of importance of customer requirements.
The first one concerns the artificial conversion of the relationships between customer requirements and design characteristics into numerical equivalent values (Franceschini and Rossetto, 1995). A special score is obtained substituting nine points for a strong relationship (symbol � , three points for a moderate relationship (symbol ❍), and one point for a weak relationship (symbol �) (Akao, 1990; Wasserman, 1993). Numerical values so obtained represent the new coefficients of the relationship matrix R. The second step provides the determination of relative weights w0j of technical design characteristics: w0j
The ranking of technical design requirements The QFD approach provides two steps for the ranking of technical design characteristics.
Figure 1 The house of quality for the pencil example
k X
di � ri;j ;
j 1; 2 . . . ; n:
1
i1
where:
di = degree of importance of the customer requirement i-th, i = 1, 2, . . . , m. ri,j = numerical relationship between customer requirement i-th and technical design characteristic j-th; i = 1, 2, . . . , m; j = 1, 2, . . . , n. w0j = importance rating for technical design characteristic j-th; j = 1, 2, . . . , n; m = number of customer requirements; n = number of technical design characteristics.
Relative normalized weights are obtained as follows: wj
w0j ; n P w0j
j 1; 2; . . . ; n:
2
j1
Weights so determined represent the importance that the customer indirectly ascribes to each design characteristic. They can be interpreted as the degree of ``attention'' that a designer must reserve to each single technical characteristic during the product development process (Franceschini and Rossetto, 1997; Pahl and Beitz, 1996). The determination of weights by means of equation (1) needs the knowledge of the degree of importance of each customer requirements (di), and the conversion of symbols contained in the relationship matrix into ``equivalent'' numerical scores (ri,j). These are two delicate issues as it will be explained. In this section we are going to present an alternative approach, able to manage those situations in which customers are not able to give a cardinal score to the importance of their requirements. The method asks for an additional interaction with the customer to ``dissolve'' some possible doubtful situations,
[ 70 ]
Fiorenzo Franceschini and Sergio Rossetto QFD: an interactive algorithm for the prioritization of product's technical design characteristics Integrated Manufacturing Systems 13/1 [2002] 69±75
which can arise during the prioritization activity. The procedure is based on Multi Criteria Decision Aiding (MCDA) concepts. A detailed review of MCDA methodologies can be found in Roy (1996) and Vincke (1982). � Let us define A aj =j 1; . . . ; n as a finite set of potential alternatives, evaluated using a consistent set of criteria G fgi =i 1; . . . ; mg (Roy, 1991). Each criterion gi is considered as a single point application from the set A to the criterion scale Ei, i.e. a completely ordered set (of quantitative or qualitative values) taken as the formal representation of the set of states associated with the jth criterion: gi : a 2 A ) gi
a 2 Ei : Thus the multiple criteria evaluation of an alternative a 2 A can be summarized by the vector g
a g1
a; g2
a; . . . ; gm
a; 2 = E1 � E2 . . . Em ; and the comparison of the alternatives a0 a can be done on the basis of the vector of performances g
a g1
a; g2
a; . . . ; gm
a and g
a0 g1
a0 ; g2
a0 ; . . . ; gm
a0 . The method proposed is based on a binary relation on A called outranking relation SA. Given two potential alternatives, a and a0 belonging to A we say that (Sullivan, 1986): . a outranks a0 (aSAa0 ) if, taking into account the decision maker's (DM) known preferences, the quality of the evaluations of the criteria, the set A and the nature of the decision problem, we have enough reason to admit that «a is at least as good as a0 » and no good reason to refuse it; . a does not outrank a0
a6 SA a0 if the arguments in favor of the proposition «a is at least as good as a0 » are considered insufficient. A detailed description of the method is given in the next section.
The algorithm IDCR (interactive design characteristics ranking) General assumptions
Let us interpret customer requirements as evaluation criteria G = {gi/i = 1, . . ., m}, and product's technical design characteristics as alternatives A = {ai/j = 1, . . ., m} (Franceschini and Rossetto, 1995). Symbols in R are not converted in numerical scores. Each coefficient ri,j 2 R is considered as the ordinal evaluation of j-th alternative by the i-th criterion. Let us additionally admit that 8a0 ; a 2 A; aSA a0 if and only if concordance and non-discordance tests are satisfied. On the contrary a6 SA a0 .
Concordance test
The concordance test is a measurement of the degree of concordance of the different criteria with the assertion aSA a0 . The i-th criterion is in concordance with the assertion aSA a0 iff aSAi a0 . The subset of criteria, which are in concordance with the assertion aSA a0 is called the concordant coalition. For any pair of alternatives a and a0 , indicating as I f1; . . . ; mg the set of criteria index, let us consider the set of criteria for which a is strictly preferred to a0 , denoted as I
a; a0 � I, with I
a; a0 fi 2 I : gi
a > gi
a0 g: I
a; a0 is a kind of macrocriterion composed by all criteria for which a is strictly preferred to a0 . The set of criteria for which a and 0 a get equal evaluations is indicated as I
a; a0 � I, with I
a; a0 fi 2 I : gi
a gi
a0 g. The set of criteria for which a0 is strictly preferred to a, is denoted as I
a; a0 � I, with I
a; a0 fi 2 I : gi
a < gi
a0 g. The concordance test allows verifying that the relative importance of the three macrosets is compatible with the hypothesis aSA a0 .
Non-discordance test
The non-discordance test is introduced to take into account eventual veto situations. It is a measurement of the degree of non-discordance of the different criteria with the assertion aSA a0 . The i-th criterion is in non-discordance with the assertion aSA a0 iff aSAi a0 . The subset of criteria that are in discordance with the assertion aSA a0 is called the non-concordant coalition. The non-discordance test allows managing all situations in which the strength of the opposition of certain criteria can be more or less compatible with the acceptance of the assertion aSA a0 . In order to reflect the capacity of a single criterion to reject the assertion DSA a0 without any ``help'' of other criteria, a veto condition is also introduced for those criteria which are ``in discordance'' with the hypothesis aSA a0 , i.e. the criteria of I
a; a0 . For any criterion gi, a non-discordance set Di � Ei � Ei is defined as follows (Di can also be an empty set): a pair (e, e0 2 Ei2 with e � e0 , is an element of Di if the hypothesis aSA a0 is not admissible for a pair of alternatives where: � gi
a � e gi
a0 � e0 Such a non-discordance pair corresponds to the case in which, regardless of the presence of criteria which push for the assertion aSA a0 , there exist at least one criterion whose value for a is lower than the value assumed by a0 , so as to put a veto to the validity of the assertion aSA a0 .
[ 71 ]
Fiorenzo Franceschini and Sergio Rossetto QFD: an interactive algorithm for the prioritization of product's technical design characteristics Integrated Manufacturing Systems 13/1 [2002] 69±75
Interactive procedure
For each pair of alternatives (a; a0 ), the DM (customer) can express a judgement about the condition I
a; a0 � I
a; a0 , which produces the relation a6 SA a0 , or aSA a0 . DM's answers allow building the outranking graph Gr
A; SA . Graph nodes represent alternatives and oriented arcs identify outranking relations.
Ranking procedure
To generate a ranking of alternatives in the outranking graph a selection procedure is defined. For each iteration k � 1 a subclass Ck of the final preorder is selected. Ak is the set of alternatives at the k-th iteration.
Initialization
If k = 1 then Ak = A (a) Generation of the equivalence class at step k�1 If jAk j 1 then Ak Ck (last class from the top); STOP If jAk j > 1 then go to step (b) (b) Selection of the subset Ck from Ak Starting up of the subprocedure to verify the presence of circuits in the outranking graph and subsequent graph contraction (Ostanello, 1985; Roy, 1996) Ck fa 2 Ak :6 9a0 2 Ak : a0 SAk ag Ak1 Ak Ck ; 6 then STOP If Ak1 else go to step (a); The equivalence class Ck contains the set of elements that outrank the class Ck 1 and are outranked by the class Ck1 . 6 ; SA must not In order to have Ck 6 produce circuits. If some circuits are present, we proceed to a graph Gr
A; SA contraction. We substitute the circuits with an equivalence class in the graph. Circuits on Gr
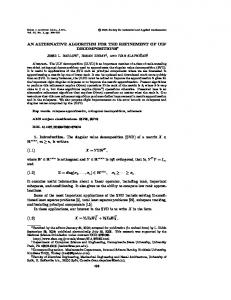
A; SA are identified by means of suitable algorithms from graph theory (Ostanello, 1985; Vincke, 1982). Figure 2 shows a scheme of IDCR algorithm. A comparison with the traditional method and a numerical example is provided in the next section.
An example Let us consider the simple case of a design of a pencil (Wasserman, 1993; Urban and Hauser, 1993; Franceschini and Rossetto, 1995). We desire to determine the technical design characteristics prioritization from the customer point of view. Figure 1 illustrates the HoQ for this product. It reports customer requirements
[ 72 ]
(ri) and technical design characteristics (aj): . r1 (easy to hold), r2 (does not smear), r3 (point lasts), r4 (does not roll); . a1 (length of pencil), a2 (time between sharpening), a3 (lead dust generated), a4 (hexagonality). Pencil hexagonality is measured by means of an indicator able to quantify pencil's geometrical characteristics with reference to an ideal one (variable in the range 0-1). Applying ``traditional'' QFD approach, the following ranking for the pencil's technical design characteristics is obtained (see Figure 1) (Wasserman, 1993): a2 ; a3 ; a4 ; a1 : Now, we consider the IDCR algorithm. Interpreting customer requirements as evaluation criteria and product's technical design characteristics as alternatives, information contained in the HoQ can be rewritten as (see Figure 1): r1
easy to hold :
a1 � a4 > a2 � a3
r2
does not smear : a3 > a2 > a1 � a4 r3
point lasts : r4
does not roll :
a2 > a3 > a1 > a4 a4 > a1 > a2 � a3
3
Symbols in the matrix R are ordered as follows: � > ❍ > �. Symbols `` > '' and `` � '' must be interpreted respectively as the ``more important than'' and ``as important as'' operators. For the ri,j = 0 coefficients contained in the relationship matrix R a dummy relationship ``^'' has been considered with the condition � > ^. With this new formulation, the original problem is transformed in the determination of the best alternatives ranking, subject to conditions expressed by equation (3). Table I contains some intermediate results of the application of the IDCR algorithm. For each pair of alternative, the second and third columns report respectively, the set of concordant I
a; a0 , and non-concordant I
a; a0 macrocriteria with the assertion aSA a0 . At this point the design team activates the interactive procedure with the DM (customer). On the basis of his preference system and the comparison of the two macrocriteria I
a; a0 and I
a; a0 , the DM establishes outranking relations. The obtained results are reported in the last column of Table I. The example does not consider veto situations. Judgments reflect the implicit degree of importance of customer requirements. The last column of Table I allows building the
Fiorenzo Franceschini and Sergio Rossetto QFD: an interactive algorithm for the prioritization of product's technical design characteristics Integrated Manufacturing Systems 13/1 [2002] 69±75
outranking graph Gr
A; SA as illustrated in Figure 3a. The graph connects alternatives which satisfy the relation aSA a0 . If aSA a0 then Gr
A; SA contains an arc which links a and a0 with the arrow directed to a0 . So, for example, for the pair
a1 ; a4 there is an arc which links the node a1 with the node a4 . Analyzing Gr
A; SA we can detect the presence of a circuit between a2 and a3 . This
Figure 3
Figure 2 Conceptual scheme of IDCR algorithm
circuit is due to the mutual outranks of the two alternatives. It becomes a necessary graph contraction (see Figure 3b). Applying IDCR procedure the following ranking is obtained: fa2 ; a3 g; a1 ; a4 : Alternatives {a2 ; a3 } belong to the same equivalence class. In this specific case, comparing the results with those by the traditional procedure, we observe a good agreement. The only difference is the inversion of the relative order of the two less important characteristics a4 ; a1 . We underline that a ranking order of design characteristics has been obtained without the artificial conversion of symbols contained in the relationship matrix, and without the use of explicit information concerning the relative degree of importance of customer requirements.
Table I IDCR results obtained for each pair of alternatives
(a; a 0 )
I
a; a 0
I
a; a 0
DM's judgement
a1 ; a2
a1 ; a3
a1 ; a4
a2 ; a1
a2 ; a3
a2 ; a4
a3 ; a1
a3 ; a2
a3 ; a4
a4 ; a1
a4 ; a2
a4 ; a3
{1, 4} {1, 4} {1, 2, 3} {2, 3} {1, 3, 4} {2, 3} {2, 3} {1, 2, 4} {2, 3} {1, 2, 4} {1, 4} {1, 4}
{2, 3} {2, 3} {4} {1, 4} {2} {1, 4} {1, 4} {3} {1, 4} {3} {2, 3} {2, 3}
No No Yes Yes Yes Yes Yes Yes Yes No No No
Notes: The second and third columns illustrate the set of concordant I
a; a0 and non concordant I
a; a0 criteria with the assertion aSA a0 . The last column reports the DM's judgement expressed by means of the comparison of the two macrocriteria I
a; a0 and I
a; a0 [ 73 ]
Fiorenzo Franceschini and Sergio Rossetto QFD: an interactive algorithm for the prioritization of product's technical design characteristics Integrated Manufacturing Systems 13/1 [2002] 69±75
Discussion and observations It must be underlined that the IDCR algorithm gives a ranking order of design characteristics using only its ability to manage ordinal information. It allows avoiding the risk of ``steering'' the design in an arbitrary way, depending on the conversion scale used to transform R matrix symbols. IDCR data are determined by asking the customer to express his judgements without forcing him to reason with conventional unfamiliar scales. A second issue that must be highlighted is that IDCR algorithm can be easily automated. It is insertable in generic commercial SW packages (Buede, 1992), or integrable with others QFD packages (Akao, 1990). As regards the traditional approach, IDCR bases its operation on a procedure, which is not too stiff and restrictive. For example, it allows managing veto situations. Its apparent heaviness, due to the comparison of all pairs of alternatives, finds its justification in the ``non-symmetric'' influence, which can exercise the indifference relation on DM's final decision. Finally, with reference to the computational aspects we can observe that: . the IDCR algorithm stops, in any case, after m iterations; . the IDCR computational complexity, in the worst case, is o
n5 n2 m with m e n respectively the number of criteria and the number of alternatives.
Conclusions The paper presents a method for facilitating the prioritization of technical design characteristics of a product/service during the QFD planning process. It is applicable in those contexts where it is not easy to get information or knowledge by the customer. The algorithm, based on the interaction with the customer (DM), allows facing all situations in which he is not able to give a ``score'' to his requirements on conventional scales. Besides, it avoids an inappropriate conversion of qualitative information contained into the relationship matrix. Although the method determines a spontaneous relation with the customer, it can present some applicability limits when he is not easily achievable (e.g. customers of wide consumption goods). Development of a QFD support system, including the IDCR method, is currently in progress.
[ 74 ]
References
Akao, Y. (1990), QFD: Integrating Customer Requirements into Product Design, Productivity Press, Cambridge. Buede, D.M. (1992), ``Software review: overview of the MCDA software market'', Journal of Multi-Criteria Decision Analysis, Vol. 1 No. 1, pp. 59-61. Cohen, L. (1995), Quality Function Deployment: How to Make QFD Work for You, AddisonWesley, Reading MA. Dyer, J.S. (1990), ``Remarks on the analytic hierarchy process'', Management Science, Vol. 36 No. 3, pp. 249-58. Ertas, A. and Jones, J.C. (1993), The Engineering Design Process, John Wiley, New York, NY. Franceschini, F. (1998), Quality Function Deployment: uno strumento concettuale per coniugare qualitaÁ e innovazione, Ed. Il Sole 24 ORE Libri, Milano. Franceschini, F. and Rossetto, S. (1995), ``QFD: the problem of comparing technical/ engineering design requirements'', Research in Engineering Design, Vol. 7, pp. 270-8. Franceschini, F. and Rossetto, S. (1997), ``Design for quality: selecting product's technical features'', Quality Engineering, Vol. 9 No. 4, pp. 681-8. Franceschini, F. and Rossetto, S. (1998), ``QFD: how to improve its use'', Total Quality Management, Vol. 9 No. 6, pp. 491-500. Franceschini, F. and Rupil, A. (1999), ``Rating scales and prioritization in QFD'', International Journal of Quality & Reliability Management, Vol. 16 No. 1, pp. 85-97. Fraser, N.M. (1994), ``Ordinal preference representations'', Theory and Decision, Vol. 36 No. 1, pp. 45-67. Griffin, A. and Hauser, J. (1992), ``Patterns of communication among marketing, engineering and manufacturing ± a comparison between two new product teams'', Management Science, Vol. 38 No. 3, pp. 360-73. Hauser, J. and Clausing, D. (1988), ``The house of quality'', Harvard Business Review, Vol. 66 No. 3, pp. 63-73. Larichev, O.I., Moshkovich, H.M., Mechitov, A.J. and Olson, D.L. (1993), ``Experiments comparing qualitative approaches to rank ordering of multiattribute alternatives'', Journal of Multi-Criteria Decision Analysis, Vol. 2 No. 1, pp. 5-26. Larichev, O.I., Olson, D.L., Moshkovich, H.M. and Mechitov, A.J. (1995), ``Numerical vs cardinal measurements in multiattribute decision making: how exact is enough'', Organizational Behaviour and Human Decision Processes, Vol. 64 No. 1, pp. 9-21. Ostanello, A. (1985), ``Outranking methods'', in Fandel, G. and Spronk, J. (Eds), Multiple Criteria Decision Methods and Application, Springer-Verlag, Berlin, pp. 41-60.
Fiorenzo Franceschini and Sergio Rossetto QFD: an interactive algorithm for the prioritization of product's technical design characteristics Integrated Manufacturing Systems 13/1 [2002] 69±75
Pahl, G. and Beitz, W. (1996), Engineering Design, Springer-Verlag, Berlin. Roy, B. (1991), ``The outranking approach and the foundations of ELECTRE methods'', Theory and Decision, Vol. 31 No. 1, pp. 49-73. Roy, B. (1996), Multicriteria Methodology for Decision Aiding, Kluwer Academic Publishers, Dordrecht. Saaty, T.L. (1990), MultiCriteria Decision Making: The Analytic Hierarchy Process, 2nd ed., RWS Publications, Pittsburgh, PA. Sullivan, L. (1986), ``Quality function deployment'', Quality Progress, American Society of Quality Control, pp. 39-50.
Urban, G.L. and Hauser, J.R. (1993), Design and Marketing of New Products, Prentice-Hall, Englewood Cliffs, NJ. Vansnick, J.C. (1986), ``On the problem of weights in multiple criteria decision making (the noncompensatory approach)'', European Journal of Operational Research, Vol. 24, pp. 288-94. Vincke, P. (1982), MultiCriteria Decision Aid, John Wiley, Chichester. Wasserman, G.S. (1993), ``On how to prioritize design requirements during the QFD planning process'', IIE Transaction, Vol. 25 No. 3, pp. 59-65.
[ 75 ]