PNT â Persistent and Non-Transactional. ⢠PT â Persistent and Transactional. 3.2.2. Messaging Latency. In a messaging system, latency is defined as the time.
Proceedings of the 37th Hawaii International Conference on System Sciences - 2004
QoS Evaluation of JMS: An Empirical Approach Shiping Chen and Paul Greenfield CSIRO Information and Communication Technologies Centre, Australia {Shiping.Chen, Paul.Greenfield}@csiro.au
Abstract JMS is an API specification that defines a standard way for Java applications to access messaging services. All JMS products promise good performance and to properly support the QoS attributes specified in the standard, making it hard to choose between them. Customers who want to determine which JMS product best meets their requirements need a simple, effective and fair methodology for evaluating and comparing competing implementations. This paper presents an empirical methodology for evaluating the QoS implementation of a JMS product. We present a number of test scenarios and define metrics for measuring performance and message persistence. We then illustrate this methodology by using it to evaluate two leading JMS products. Our evaluation results show differences between these products in terms of their overall performance and the impact of various QoS attributes. The case study demonstrates that our empirical methodology is an effective and practical way to test the performance of JMS and other messaging systems.
Keywords: JMS, QoS, throughput, Latency, Persistent 1 Introduction JMS (Java Message Service) [1] is a specification from Sun Microsystems that defines a standard way for Java applications to access enterprise messaging infrastructure. The JMS API is based on the capabilities found in traditional asynchronous Message-Oriented Middleware (MOM) technologies, such as IBM’s MQ Series and TIBCO’s Rendezvous, and can be used to compose large-scale enterprise systems from looselycoupled component applications. The standard nature of the JMS API has led to its wide acceptance as a common messaging mechanism in the J2EE user community and it
has become an important part of the J2EE framework. Several software vendors have released JMS-only products, while most vendors of well-established MOM products have implemented JMS interfaces and adapters. These JMS implementations all support the messaging functions and options as defined in the JMS specification but differ in their performance and the quality of their implementation. This paper presents an empirical methodology for evaluating JMS implementations. This methodology is based on a number of test scenarios and a set of metrics used for measuring performance and the quality of the persistent messaging implementation. We illustrate the methodology by using it to evaluate two leading JMS products. The results of our evaluation show differences between these products in terms of their support for QoS attributes, and we discuss the implications of these findings. The case study demonstrates that our empirical methodology is an effective and practical way to evaluate both the performance and the efficacy of the QoS implementation in messaging-oriented middleware products. The rest of this paper is organised as follows. Section 2 gives an overview of MOM and JMS technologies. Section 3 presents an empirical approach to JMS evaluation. Section 4 demonstrates the use of this methodology by evaluating two JMS technologies and we conclude in Section 5.
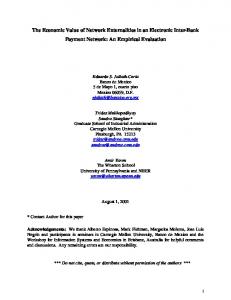
2 MOM vs. JMS MOM (Message-Oriented Middleware) is a key technology that is widely used for building enterprise applications and event-based systems. MOM technologies are typically used to bind together independent systems and components by exchanging asynchronous messages across connecting queues. Figure 1 shows how MOM can be used within an organisation, integrating modern component-based applications with legacy applications and connecting local
0-7695-2056-1/04 $17.00 (C) 2004 IEEE
1
Proceedings of the 37th Hawaii International Conference on System Sciences - 2004
applications with the business systems provided by business partners.
DB
Legacy Apps Mainframe
App Server
3-Tier Application
Figure 1 - Integration through messaging The asynchronous nature of messaging technology provides the following advantages in system design, implementation and maintenance: • Flexibility: Messaging infrastructure decouples applications and lets them stay independent and autonomous. This provides the ability to flexibly update and/or integrate individual applications with little effects on the whole system or on other components. • Efficiency: Since the sender does not have to wait for a reply to a message, the sender can continue on with its work immediately after sending the message. This is especially important for operations that can take a long time to complete. • Robustness: The sender can send a message even if the network is down or the receiver is not available at the time. MOM can also provide a level of faulttolerance using persistent queues that allow unsent or unread messages to be recovered after system failures. • Tight Integration of Object Models: Each message can represent a complete object, including any composite elements that make up the object. Since the entire object is available locally, complex collaborations involving many method invocations can be implemented with little overhead. Although primarily an asynchronous technology, MOM can also be used to support synchronous communication models. In this case, the sender simply uses the MOM layer to send a request message to a receiver, and then waits for the receiver to send back a reply message. This feature provides some of the capabilities of conventional synchronous technologies, such as CORBA, COM+ or EJB, but only at some cost in transparency and functionality. It is worth noting that MOM-based synchronous messaging does not support
traditional end-to-end transactions and considerable programming effort may be needed to ensure data consistency after failure. JMS (Java Message Service) is a Java interface specification from Sun Microsystems which provides a standard way for Java applications to access enterprise messaging infrastructure. A compliant JMS product is expected to support two forms of messaging: point-to-point (PTP) and publish/subscribe (Pub/Sub). PTP messaging is built around the concept of a queue – sending applications post messages to a queue and receiving applications retrieve these messages from this queue, or from another queue linked to this queue. Multiple receiving servers can be clustered in PTP applications to increase the processing capacity of the service. Pub/Sub messaging is built around the concept of a topic - message producers send messages to a specific topic and all message consumers who have registered their interest in this topic will receive a copy of relevant published messages. Both queue and topic are called destinations for messaging applications. illustrates these two messaging mechanisms. It should be noted that in PTP any single message will be received by only one receiver, while in Pub/Sub all registered subscribers receive copies of all relevant published messages. Sender
Receiver Queue
(a) PTP Sub
Pub
Sub To p ic Sub
(b) Pub/Sub Figure 2 - PTP and Pub/Sub messaging JMS also defines a set of reliability attributes for messaging as a way of allowing developers to specify the QoS (Quality of Service) requirements of their applications. These attributes are: • Non-Persistent/Persistent: In non-persistent messaging, the MOM layer keeps pending messages only in memory buffers while they are waiting to be delivered. Non-persistent messaging gives the best performance due to its low overheads, but undelivered messages will be lost if the messaging system fails. In
0-7695-2056-1/04 $17.00 (C) 2004 IEEE
2
Proceedings of the 37th Hawaii International Conference on System Sciences - 2004
persistent messaging, the MOM layer guarantees to deliver messages despite system/network failures. This is achieved by logging messages to persistent storage, such as a database or file, and recovering undelivered messages on system restart. • Nondurable/Durable: JMS defines two types of subscribers, nondurable and durable. A nondurable subscriber application will receive messages only when it is active. Durable subscriber applications receive all messages published on their registered topics or queues, including any messages that were published while the subscriber was inactive. Pub/Sub messaging is traditionally non-durable, while PTP messaging is inherently durable. • Non-transactional/Transactional: A messaging session can be specified as transactional or nontransactional. A transaction is a set of message sending or receiving operations that are regarded as a single atomic unit of work. Note that messaging ‘transactions’ only apply to the action of either sending or receiving a group of messages on a single system, not to the combined operations of sending and receiving across multiple parties in a distributed application. JMS can support two kinds of transactions: local and distributed. Local transactions only provide atomic message grouping and do not include updates to other resources within the transactional boundaries. Distributed transactions include both messaging and other transactional operations, such as database updates, within the scope of a single atomic transaction.
3 Evaluation Methodology 3.1
Test Scenarios
As discussed in Section 1, queued messaging is typically used to loosely connect relatively independent applications. The most general form of this scenario is usually implemented using PTP messaging and coresident servers as shown in Figure 3 (a). Each participating system runs both its local applications and a messaging server that talks to other messaging servers that are running on other systems located elsewhere on the network. All applications send and receive messages using only their local (co-resident) message server. In some cases, such as internal EAI applications, we can also use single message server acting as a broker/intermediary between local but independent applications. This second scenario is shown in Figure 3 (b). These applications can be co-resident with the messaging server or can run on separate systems. Since
our evaluation just focuses on the basic performance of JMS messaging products, the second, simpler, scenario is used for conducting our PTP benchmarks. Performance testing using the first scenario has been discussed previously in [4]. We are planning to cover the performance of JMS messaging with multiple co-resident servers, along with the performance of JMS pub/sub implementations in future work. JMS Server Queue
Senders
Queue
Receivers
JMS Server
(a) PTP co-resident messaging Senders Queue JMS Server Receivers
(b) Internal EAI messaging Figure 3 - Two common scenarios using queues While [9] attempted to develop a general-purpose benchmark for messaging systems, in this paper we propose a simple test scenario to test the basic messaging capacity of the underlay messaging engine. The test consists of three logical components: senders, receivers and the JMS server. Each sender sends messages to a receiver via the JMS server. The sender application is a multi-threaded Java program used to generate a range of message injection rates (like the road speed of a manual car) by varying the number of sending threads (gear) and the sending rate of each thread (engine rpm). The variable sender-side message injection rate is achieved by having each sender thread wait for a specified period after sending a message. The receiver is also a multi-threaded Java application with a variable number of receiving threads. The receiving threads do not pause between messages and take messages from the JMS server as fast as they can, without any ‘thinking-time’ between receive calls.
0-7695-2056-1/04 $17.00 (C) 2004 IEEE
3
Proceedings of the 37th Hawaii International Conference on System Sciences - 2004
3.2
Evaluation Metrics
We propose that the following four metrics should be used to evaluate a JMS product in order to cover different aspects of its overall performance: • • • •
Maximum sustainable throughput Latency Elapsed time taken to send batches of messages Persistent message loss after recovery
3.2.1
Maximum Sustainable Throughput
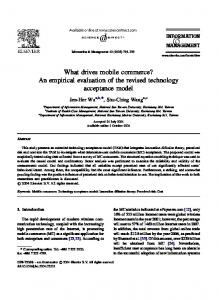
The commonest performance metric used to evaluate the capacity of a messaging system is throughput, i.e. the average number of messages that can be delivered in some time period. Measuring throughput for messaging systems is not simple because of the effects of queuing and the feedback mechanisms used to implement flow control. Some previously published tests [5] have measured throughput by measuring how quickly messages can be sent, without ensuring that messages are received at the same rate. A side effect of this technique is that messages may be produced far faster than they can be consumed, causing a non-sustainable build-up of messages in the messaging server. Non-persistent messages will eventually fill up the memory made available for queues, and persistent messages will run out of allocated storage space – and both situations pose risks to the stability of the message server and the entire distributed system. In order to ensure stability, many JMS vendors implement ‘flow control’ mechanisms that limit resource usage under heavy load. The policies and mechanisms used for flow control differ between various JMS products, making it difficult to sensibly compare performance under stressful conditions [10, 11, 12]. Figure 4 shows the dynamic behaviours for a test run under normal messaging conditions and Figure 5 shows the effect of flow control.
To avoid the problems of excessive resource usage and flow control, the Maximum Sustainable Throughput (MST) metric from [4] is used to quantify the maximum throughput of a messaging server. MST is an equilibrium throughput level, the point where we can send and receive messages with no queues building up and without invoking flow control mechanisms. At or below this rate, the tests can run forever. Above it, messages are being queued somewhere, resulting in steadily increasing resource usage, and (hopefully) the eventual imposition of flow control.
Figure 5 - Messaging under flow control
Figure 6 shows the typical behaviour observed in our test system as the requested sending rate increases. Initially the JMS server is operating below its maximum capacity, the sending and receiving rates are equal, and the receiver is able to keep up with the requested sending rate. In this case however, when the requested sending rate approaches 300 messages/second, the JMS server reaches maximum capacity and the receiving rate stops increasing. The sending rate still keeps going up for a while longer but soon both sending and receiving rates level off (and may even decrease). The ‘turning point’ highlighted with the circle is the Maximum Sustainable Throughput that we define and present in this paper. Actual JMS products display varying performance characteristics for different configurations, but we believe that MST can be used to measure the basic throughput of all JMS messaging implementations.
Figure 4 - Normal messaging
0-7695-2056-1/04 $17.00 (C) 2004 IEEE
4
Proceedings of the 37th Hawaii International Conference on System Sciences - 2004
a timestamp (T1) and attaches it to the outgoing message as a JMS message property. When the receiver fetches the message from the queue, it gets another timestamp (T2). The messaging latency can then be calculated as Latency = T2 –T1. The following latency metrics are collected:
Throughput
Actual rate
400 300 200
Sending Rate
100
Receiving Rate
90 0 10 00
Injection rate
80 0
70 0
60 0
50 0
40 0
30 0
20 0
10 0
0
Minimum Latency Maximum Latency Average Latency Latency Distribution
3.2.3
Figure 6 - Requested actual sending/receiving rates We determine a value for MST by gradually increasing requested sending rate and the number of receiving threads, and measuring the resulting sending and receiving rates and latency for each test run. We also monitor both the queue sizes and the stability of the observed sending and receiving rates during the tests. We used the following observations to find approximate values for the MST point for each product under test: • Has the queue size begun to increase monotonically or vary periodically • Have the sending and receiving rates stopped being equal. • Are the sending and receiving rates equal but unstable. We repeated these MST tests for different message sizes and QoS settings. The QoS settings for JMS messaging considered in our evaluation framework were: • NPNT – Non-Persistent and Non-Transactional • PNT – Persistent and Non-Transactional • PT – Persistent and Transactional 3.2.2
• • • •
Messaging Latency
In a messaging system, latency is defined as the time taken to deliver messages from the sender (publisher) to the receiver (subscriber). It is used to evaluate how efficiently a message server delivers messages from the viewpoint of its clients. Although messaging latency is easy to understand, it is difficult to measure precisely in a distributed environment without synchronised highprecision clocks. Some time was spent investigating published solutions to this problem [6], [7] [8] but the local EAI scenario under test allowed for a simpler solution. In our test scenario, we run both the senders and receivers on the same machine so that the latency can be precisely measured using the same clock. The messaging latency is measured as follows. The sending process gets
Elapsed Time for Batch Messaging
The batch messaging test is used to evaluate how well the JMS server can handle sending or receiving a batch (or burst) of messages. The metric for used this evaluation is elapsed time, i.e. the total time taken to sending and receive a specific number of messages under different QoS settings. 3.2.4
Persistent Message Recovery Test
Messages are normally configured as persistent because they are critical for the effective or correct operation of an enterprise. These messages, such as customer orders and invoices, cannot be lost once they have been put into a queue, and must survive server failures. To determine how well the products under test actually meet the recovery requirements imposed by persistent messaging, we designed the following three test cases. In all of these tests we started sending and receiving messages, forced the JMS server to fail in some way and then checked to make sure no messages were lost after recovery had completed. The tests conducted were: • Killing the JMS server process • Rebooting the JMS server machine • Turning off the power to the JMS server machine and then powering it back on again. Each sent message was assigned a unique serial number (stored in the message body) and the receiving application checked these on message receipt to make sure that none were lost on recovery. The following metrics were obtained: • The number of messages sent (S) • The number of messages received (R) • The number of messages recovered after recovery (RFF)
0-7695-2056-1/04 $17.00 (C) 2004 IEEE
5
Proceedings of the 37th Hawaii International Conference on System Sciences - 2004
The following measures can be used to determine if the JMS product can properly recover persistent messages: • S-R+RFF = 0 means that all messages were logged and recovered successfully and no messages were lost. • S-R+RFF > 0 means that (S-R-RFF) messages were lost during the failure and recovery process.
4 Case Study In this section, we apply the test scenarios and evaluation metrics described in Section 3 to evaluate two commercial JMS products.
Table 1 - Configurations for test platforms JMS Server
Sender/Receiver
Model
Dell Precision 610MT
Dell PowerEdge 6450/700
CPU
2x450MHz Pentium II
4x700Mhz Intel PIII Xeon
Memory
0.5GB
4GB
Disk
1x18GB Seagate SCSI
1x18GB Seagate SCSI
OS
MS W2K Server SP2
MS W2K Server SP2
4.2 Test Results - Throughput
4.1 Test Description All tests are conducted under the following rules: • The JMS server and the client applications are run on different machines to remove the effects of the client CPU demands on the server performance. • Both sending and receiving client applications run on the same machine so that latency can be precisely measured using the same clock. • The queues are emptied before each test run. • Receivers are always started first and are waiting for incoming messages before the sending applications are started. • The MST and Latency tests are run using a 1 minute warm-up period, followed by 5 minutes of measurement and a 1-minute cool-down period. Throughput is observed during the measurement period to ensure that the JMS performance remains stable. • No other applications are running or using the resources on any of the systems under test. The CPU load on the client machine should be under 30% to ensure that it is not limiting factor in the tests. • The same hardware platform, operating system and network configuration are used for all tests. • Each test is run multiple times to assure the repeatability of the results The configuration of the computers used in the tests is shown in Table 1. The computers used for the tests were connected over a 100MB/s switched LAN. Write caching for disk I/Os was not enabled for either of the computers used in the tests.
In this section, we present the throughput results based on our evaluation metrics. Due to license restrictions, we cannot name the actual commercial products under test and will use JMS A and JMS B to represent the two products instead. Table 2 lists the maximum sustainable throughputs in Messages Per Second (MPS) for the two JMS products tested, using different message sizes and QoS settings. Note that since one of the two products tested does not support distributed transactions, we had to perform a local transaction test (PLT) rather than more general transactional tests. As shown in Table 2, JMS A outperforms JMS B for NPNT tests across all message sizes. The server CPU utilisation reached 100% for both products, indicating that CPU capacity was the limiting factor in these NPNT tests and that JMS A was slightly more efficient. JMS A continues performs better than JMS B for PNT tests. However, significant performance drops for JMS A are observed in the PLT tests across all message sizes, making JMS B superior to JMS A in this case. This indicates that the cost for transaction support in JMS A is much higher than for JMS B. During the tests for both PNT and PLT, high disk I/O utilisation was observed and the CPU usage was between 30~50%. We infer that in these cases the disk I/O requirements for logging persistent messages becomes the performance bottleneck. Figure 7 shows the MST values obtained for different QoS messaging attributes using 1KB messages.
0-7695-2056-1/04 $17.00 (C) 2004 IEEE
6
Proceedings of the 37th Hawaii International Conference on System Sciences - 2004
The JMS specification defines the set of required QoS attributes, not how they should be implemented, and so vendors implement this functionality in different ways, resulting in different levels of performance. Whatever technologies are used, persistent messaging has to not lose messages and these performance results should be seen in the light of the persistent test results presented in Section 4.5.
Table 2 – Maximum sustainable throughput QoS
MsgSize
JMS A
JMS B
64B
1200
1000
1KB
1100
900
4KB
800
700
NPNT
PNT
Throughput in MPS
PLT
64B
500
400
1KB
460
380
4KB
430
350
64B
190
350
1KB
180
300
4KB
160
250
4.3 Test Results - Latency Messaging latencies were also measured when the above throughput tests were being conducted. The latencies reported here can be regarded as possibly a worst case, as they were obtained at maximum sustainable throughput. A system running at lower message injection rates may well have lower latencies or a tighter spread of latencies. The latency results at the MST point are shown in Table 3.
1200 JMS A
900
JMS B
600 300 0 NPNT
PNT
PLT
QoS
Figure 7 - MST for different QoS (msg size=1KB)
Table 3 – Messaging latencies (in milliseconds) Message
Messaging
Size
Latency
JMS A
JMS B
JMS A
JMS B
JMS A
JMS B
Min
0
0
0
0
15
0
Average
7
9
40
13
133
23
Max
63
187
210
187
469
203
Min
0
0
0
0
15
0
Average
10
13
55
19
139
29
Max
109
125
328
172
438
219
64B
1KB
4KB
NPNT
PNT
PLT
Min
0
0
0
0
31
0
Average
18
55
65
26
164
30
Max
294
266
328
203
484
219
0-7695-2056-1/04 $17.00 (C) 2004 IEEE
7
100%
Distributions in %
Distributions in %
Proceedings of the 37th Hawaii International Conference on System Sciences - 2004
80% 60% 40% 20% 0% 0
80
160 240 320 Latency in m sec
100% 80% 60% 40% 20% 0% 0
400
100% 80% 60% 40% 20% 0% 0
80
160 240 320 Latency in m sec
80% 60% 40% 20% 0%
400
0
Distributions in %
Distributions in %
80% 60% 40% 20% 0% 160 240 320 Latency in m sec
80
160 240 320 Latency in m sec
400
(d) JMS B: PNT
100%
80
400
100%
(c) JMS A: PNT
0
160 240 320 Latency in m sec
(b) JMS B: NPNT Distributions in %
Distributions in %
(a) JMS A: NPNT
80
400
(e) JMS A: PLT
100% 80% 60% 40% 20% 0% 0
80
160 240 320 Latency in m sec
400
(f) JMS B: PLT
Figure 8 - Latency distributions (message size 1KB)
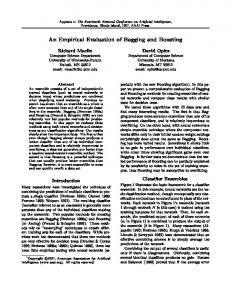
Latencies increase as message sizes go up, and with more demanding QoS requirements. This is understandable and consistent with the throughput test results. While the latencies for JMS-A increase greatly (about 400% from NPNT to PNT and 200% from PNT to PLT), we did not see the same significant latency increase for JMS B (less than 100% for both cases). The small increases in latency displayed by JMS B may be related to the message recovery problems seen in the persistence tests (see Section 4.5). In addition to the statistical results shown in Table 3, we also collected information on the latency distributions observed in each test run by using a distribution index operation, distribution_data[latency/Bucket]++, to
minimise both computation and memory costs. Some of latency distribution test results (for a 1KB message size) are provided in Figure 8. As shown in Figure 8 (a) and (b), for NPNT messages about 80% of latencies for both JMS-A and B are tightly distributed in a range between 0 and 50 milliseconds. This confirms the higher throughputs and shorter latencies in NPNT tests for the two products. However, the latency distributions begin to spread for both PNT and PLT tests for both products as shown in Figure 8 (c) (d) (e) and (f). In particular, the latency distribution for JMS-A is much broader than for JMS B. These results are consistent with the simple statistical latency results shown in Table 3.
0-7695-2056-1/04 $17.00 (C) 2004 IEEE
8
Proceedings of the 37th Hawaii International Conference on System Sciences - 2004
4.4 Test Results - Batch Messaging
Elapsed time (ms)
Batch tests were carried out by sending a specified number of messages from a single client thread. The elapsed time to send and receive all of these messages was measured. As shown in Figure 9, while the elapsed time increased with the number of sent messages, JMS-A looks more efficient than JMS B for NPNT batch messaging. This agrees with our throughput testing results presented in Section 4.2.
Elapsed time (ms)
1000 JMS A
750
JMS B
500
performance as the overhead of transaction management is distributed across more messages. More discussions on the influence of transactional grouping on messaging performance can be found in [9, 10]. The PLT tests show great differences between the performance of JMS A and JMS B, with JMS B being about 5 times faster for group sizes of 10 and 50 messages. These differences have to been seen in the light of the persistence test results reported in Section 4.5.
250
40000 30000
Gsize = 1 Gsize = 10 Gsize = 50
20000 10000 0 100 500 1000 Num. of messages to send
0 100 500 1000 Num. of messages to send
Figure 11 - JMS A - PLT batch testing results
However, for persistent messaging, we got complete different results. Figure 10 shows the PNT batch messaging results for the two JMS products. These results show that the JMS A client takes much longer than JMS B’s to send the specified number of messages, reflecting its significantly higher persistent messaging overheads. 16000 12000
Elapsed time (ms)
Figure 9 - NPNT batch sending (msg size=64B)
Walltime in msec
50000
5000 4000 3000
Gsize = 1 Gsize = 10 Gsize = 50
2000 1000 0 100 500 1000 Num. of messages to send
Figure 12 - JMS B - PLT batch testing results
JMS A JMS B
4.5 Test Results - Persistent Message Recovery
8000 4000 0 100 500 1000 Num . of m essages to send
Figure 10 - PNT batch sending (msg size=64B)
We obtained similar results for the PLT tests. We ran the same batch messaging tests for PLT with different number of messages sent within each transaction. These tests were run with transaction group sizes of 1, 10 and 50 messages. Figure 11 and Figure 12 illustrate the test results for JMS A and B respectively. The test results for both JMS A and B show, as expected, that bigger group sizes for each transaction improve overall transaction
Finally, we report on the results of the persistence tests for the two JMS products using the test scenario and evaluation criteria described in Section 3.2. To build up the queue, we used two senders to continuously put persistent messages the queue and one receiver taking messages out of the queue. The results of these persistence tests are shown in Table 4. Table 4 - Persistent test results Test Cases
JMS A
JMS B
I. Kill Server
Pass
Pass
II. Reboot
Pass
Fail
III. Power Off
Pass
Fail
0-7695-2056-1/04 $17.00 (C) 2004 IEEE
9
Proceedings of the 37th Hawaii International Conference on System Sciences - 2004
While JMS A passed all the persistence tests with no messages lost, JMS B passed only Test Case I and failed to pass Test Case II and III. It seems that JMS B does not log persistent messages properly, which results in the loss of some messages on recovery in two of the failure cases. These persistence test results probably explain why JMS B performs significant better than JMS A for PNT and PLT tests in latency and batch messaging tests. It should be noted that the server machine was not using write caching so the missing messages were not simply lost when the disk controller was reset.
5 Conclusion Completely and fairly evaluating JMS technologies/products is a useful, yet challenging, task. In this paper, we presented an empirical approach to evaluating the performance of JMS, looking particularly at the impact of QoS attributes. The MST metric was used to evaluate the throughput of two commercial JMS products. Both senders and receivers were deployed on the same powerful machine so that messaging latency could be precisely measured. In addition to the common statistical data (max, min and average), latency distribution was also measured. The capacity of JMS server handling a stream of messages was also evaluated by measuring the elapsed time taken to send and receive a batch of messages. Three failover test cases were used to evaluate how well the JMS servers were able to handle the recovery of persistent messages after failure. This case study shows that our evaluation approach is able to quantify the QoS performance of JMS products through testing and to give insights into the reasons for the observed performance. Future work is to apply the evaluation approach proposed in this paper to test other JMS scenarios, such as co-located PTP servers and pub/sub messaging.
[4] M. Aspnas and T. Langbacka. A monitoring system for a transputer-based multiprocessor. Proc. of Transputer’91, p78-93, IOS Press, 1991 [5] M. Raynal and M. Singhal. Logic Time: Capturing causality in distributed systems. IEEE J. of COMPUTER, p49-56, Feb. 1996 [6] L. Yen and T. Huang. Resetting vector clocks in distributed systems. IEEE J. of Parallel and Distributed Computing (JPDC) v43, p15-20, 1997 [7] S. Chen and I. Gorton. A predictive performance model to estimate the contention cost in application servers. Proc. of the 9th Asia Pacific Software Engineering Conference (ASPEC2002), p435-440, Gold Cost Australia [8] S. Chen and J. Xue, Partition and schedule loops on NOWs, Elsevier Journal of Computer Communication, 22(11), p1017-1033. 1999, Elsevier, Netherlands [9] A. Carzaniga and A.L. Wolf. A Benchmark suit for distributed publish/subscribe systems. Technical Report CUCS-927-02, Dept of Compuer Science, Uni. Of Colaorado, Jan. 2003. [10] A. Bhandari. Flow Control in JMS Messaging. White paper, Mpulse Technologies Inc. 2003 http://www.mpulsetech.com/prod/FlowControl.pdf [11] B.A. Sanders. An asynchronous, distributed flow control algorithm for rate allocation in computer networks. IEEE/ACM Transaction on Computers, 7(37), p779-787, July 1988. [12] S. H. Low and D. E. Lapley. Optimization flow control: basic algorithm and convergence. IEEE/ACM Transaction on Networking 7(6), p. 861-874, Dec. 1999
6 References [1] M. Hapner, et al. Java Message Service (JMS) Specification v1.1, http://java.sun.com/products/jms/docs.html Sun Microsystems Inc. April 2002 [2] P. Tran, P. Greenfield, I. Gorton. Behaviour and performance of message-oriented middleware systems, Proc. Of the 22nd Conference on Distributed Computing Workshop, p645-650, Vienna Austria, July 2002. [3] D. Kou and D. Palmer. Automated Analysis of Java Message Service Providers. Middleware2001 IFIP/ACM Int. Conference on Distributed Systems Platforms
0-7695-2056-1/04 $17.00 (C) 2004 IEEE
10