This article has been accepted for publication in a future issue of this journal, but has not been fully edited. Content may change prior to final publication. Citation information: DOI 10.1109/JTEHM.2018.2844195, IEEE Journal of Translational Engineering in Health and Medicine
JTEHM-00024-2018.R1
1
QRS Complex Detection and Measurement Algorithms for Multichannel ECGs in Cardiac Resynchronization Therapy Patients Antonia E. Curtin, Kevin V. Burns, Alan J. Bank, and Theoden I. Netoff
Abstract We developed an automated approach for QRS complex detection and QRS duration (QRSd) measurement that can effectively analyze multichannel electrocardiograms (MECGs) acquired during abnormal conduction and pacing in heart failure (HF) and cardiac resynchronization therapy (CRT) patients to enable the use of MECGs to characterize cardiac activation in such patients. The algorithms use MECGs acquired with a custom 53-electrode investigational body surface mapping system and were validated using previously collected data from 58 CRT patients. An expert cohort analyzed the same data to determine algorithm accuracy and error. The algorithms (1) detect QRS complexes, (2) identify complexes of the most prevalent morphology and morphologic outliers, and (3) determine the array-specific (i.e., anterior and posterior) and global QRS complex onsets, offsets, and durations for the detected complexes. The QRS complex detection algorithm had a positive predictivity and sensitivity of ³96% for complex detection and classification. The absolute QRSd error was 17 ± 14 ms, or 12%, for array-specific QRSd and 12 ± 10 ms, or 8%, for global QRSd. The absolute global QRSd error (12 ms) was less than the interobserver variation in that measurement (15 ± 10 ms). The sensitivity, positive predictivity, and error of the algorithms were similar to the values reported for current state-of-the-art algorithms designed for and limited to simpler data sets and conduction patterns and within the variation found in clinical 12-lead ECG QRSd measurement techniques. These new algorithms permit accurate, real-time analysis of QRS complex features in MECGs in patients with conduction disorders and/or pacing. Index Terms—biomedical signal processing, classification algorithms, detection algorithms, electrocardiology
T
I. INTRODUCTION1
QRS complex measured by 12-lead HE electrocardiogram (ECG) is the main feature in the diagnosis of a number of cardiac pathologies. In the heart failure (HF) population, QRS complex duration (QRSd) and morphology are key criteria for assessing electrical activation in candidates for and patients with cardiac resynchronization therapy (CRT) [1, 2]. However, in spite of the clinical ubiquity of the 12-lead ECG in CRT patient care, its sensitivity to relevant electrophysiologic substrate behavior in that population is limited [3, 4]. Recently, QRS complex features measured in multichannel electrocardiograms (i.e., ECGs from arrays with 50 to 250 electrodes [MECGs]) have been investigated to describe cardiac activation in CRT patients while addressing the spatial limitations of the 12-lead ECG and with the goal of Revisions submitted on May 10, 2018. This work was supported by funding provided by the Medtronic External Research Program, Medtronic plc. Ms. Curtin, Dr. Burns, Dr. Bank, and Dr. Netoff have received funding and consulting payments from Medtronic. Ms. Curtin, Dr. Burns, and Dr. Bank are authors on a patent filing describing this work. A. E. Curtin is a PhD candidate with the Biomedical Engineering Department, University of Minnesota, Minneapolis MN, 55455 (
[email protected]).
concomitantly reducing patient non-response, which affects 30% of CRT recipients [5-8]. However, manual evaluation of the requisite QRS complex features would be prohibitively labor-intensive in MECGs and is not even routinely performed using 12-lead ECGs [9-11]. An automated analysis approach is therefore needed if CRT patients are to benefit from the increased information content of QRS complex features measured in MECGs. Automated QRS complex detection and measurement algorithms for MECGs are lacking. In body surface mapping studies using MECGs for myocardial infarction detection and for activation mapping, “semi-automated” (i.e., template matching) or completely manual QRS complex detection methods are used in combination with manual QRSd measurement [12-14]. Semi-automated detection strategies require the a priori identification of the QRS complex morphology of interest and have difficulty discriminating QRS complexes from T-waves [15]. In the single identified K. V. Burns and A. J. Bank are at United Heart and Vascular Clinic Research Department, St. Paul, MN 55102 (
[email protected];
[email protected]). T. I. Netoff is an associated professor with the Biomedical Engineering Department, University of Minnesota, Minneapolis MN, 55455 (
[email protected]).
2168-2372 (c) 2018 IEEE. Translations and content mining are permitted for academic research only. Personal use is also permitted, but republication/redistribution requires IEEE permission. See http://www.ieee.org/publications_standards/publications/rights/index.html for more information.
This article has been accepted for publication in a future issue of this journal, but has not been fully edited. Content may change prior to final publication. Citation information: DOI 10.1109/JTEHM.2018.2844195, IEEE Journal of Translational Engineering in Health and Medicine
system for automated QRS complex detection in MECGs, the algorithm used was designed to detect QRS complexes during episodes of ventricular tachycardia and relied on specific features associated with that condition [16, 17]. In addition, current 12-lead ECG QRS complex detection and QRSd measurement algorithms are ill suited for translation to MECGs. Although generally characterized by high sensitivity and positive predictivity, these methods are typically validated using single-channel 12-lead ECG data from the MIT-BIH database and struggle with negativepolarity complexes, very wide complexes, and lowamplitude complexes [18, 19]. ECGs of any type acquired from HF and CRT patients exhibit all of the characteristics that conventional 12-lead ECG algorithms struggle with. The HF and CRT patient populations represent a variety of conduction delay pathologies, each of which is associated with a different QRS complex morphology and polarity. Patients with left bundle branch block (LBBB), who make up the majority of CRT recipients, are characterized by large negative peaks on ECGs because of the anterior-to-posterior direction of cardiac activation [20]. Signal amplitudes in the HF and CRT populations may also vary widely due to the large range of BMIs present in this group [21, 22]. In addition, these patients require the analysis of not only native conduction (i.e. un-paced) ECGs but also paced data. In paced patients, device settings may not uniformly affect the cardiac cycle, and associated QRS complex changes cannot be predicted or described programmatically because of the individual nature of the electrophysiologic substrate response [23]. Furthermore, CRT patients may experience any combination of native conduction breakthrough, premature ventricular contractions, premature atrial contractions, fusion beats, and paced beats during CRT. A successful QRS complex detection algorithm for use with MECGs from CRT patients must correctly identify the electrical substrate behavior (i.e., QRS complex morphology) that the patient experiences most frequently, in spite of these confounding factors. This study describes the paired development and validation of an automated MECG QRS complex detection algorithm and an MECG QRSd measurement algorithm to address the dual challenges of automated feature detection in MECGs and the idiosyncrasies of electrical substrate behavior in the CRT population. When the algorithms are used in tandem, the QRS complex detection algorithm identifies and classifies all of the QRS complexes associated with the most prevalent conduction pattern (i.e., most prevalent complex morphology) in a given MECG recording and the QRSd measurement algorithm delineates the arrayspecific (i.e., anterior and posterior) and global start and end points and measures the corresponding QRSd in each complex. Algorithm performance was determined by comparing the QRS classification and QRSd measurement results with those independently acquired from an expert cohort. The algorithm described herein has been submitted for a patent [24].
II. METHODS AND PROCEDURES A. MECGs Algorithm development and validation were performed using data collected for a previous study of advanced systolic HF patients who had received new CRT implants between 2014 and 2017 at United Heart and Vascular Clinic in St. Paul, MN. For that study, written informed consent was obtained from all patients, and the study protocol was approved by an institutional review board (IRB). Both 12lead ECGs and MECGs were used, the latter of which were acquired with a custom ECG Belt investigational body surface mapping system (see below). Data was available from 149 patients during native conduction (CRT off) and with CRT on at a range of device settings. Algorithm development was performed using training data from 5 patients, and data from an additional 10 patients was used for the validation step while optimizing algorithm parameters. These 15 patients included right bundle branch block (RBBB), LBBB, nonspecific intraventricular conduction delay, and complete heart block patients. Data from a separate group of 58 patients was used for the final phase of algorithm validation, as described in later sections. The ECG Belt system has been described elsewhere [11, 12]. The investigational system consists of a multichannel amplifier, a monitor, and electrode array (Heartscape, Verathon, Seattle, WA) and customized data acquisition software (Medtronic, PLC, Minneapolis, MN).The ECG Belt electrode array consists of 53 (17 anterior and 36 posterior) unipolar ECG electrodes arranged on the torso as shown in Fig. 2. MECGs for a given condition were collected in 15- to 20-s recording at a sampling rate of 1 kHz and bit resolution of 24 bits and saved offline for subsequent analyses. B. QRS Detection and QRSd Measurement Algorithms Implementation of Algorithms The following preprocessing method, QRS detection algorithm, and QRSd measurement algorithm have been implemented in comprehensive stand-alone software written in MATLAB (using MATLAB Release 2017b, The MathWorks, Inc., Natick, MA) that supports the loading and serial analysis of MECGs collected during multiple conditions from one or more patients. The data preprocessing method and both algorithms make use of built-in MATLAB functions, including those provided with the digital signal processing (DSP) system toolbox, the signal processing toolbox, and the statistics and machine learning toolbox. A complete analysis identifies all of the QRS complexes in a given recording, classifies each complex as predominant or outlier morphology (PM or OM, respectively), delineates the array-specific (i.e., anterior and posterior) and global start and end points of each of the PM complexes, and measures the array-specific and global QRS durations. The software also automatically generates figures for ready visualization of the results of the QRS detection and QRSd measurement algorithms for each recording. In addition, we have created a
2168-2372 (c) 2018 IEEE. Translations and content mining are permitted for academic research only. Personal use is also permitted, but republication/redistribution requires IEEE permission. See http://www.ieee.org/publications_standards/publications/rights/index.html for more information.
This article has been accepted for publication in a future issue of this journal, but has not been fully edited. Content may change prior to final publication. Citation information: DOI 10.1109/JTEHM.2018.2844195, IEEE Journal of Translational Engineering in Health and Medicine
JTEHM-00024-2018.R1
3
second version of the software with a graphical user interface (GUI) front end for use by an operator unfamiliar with the MATLAB scripting language. TABLE 1 CRITERIA FOR QRS COMPLEX DETECTION ALGORITHM STEPS Step Action Parameter Value/Criteria 1a. Relevant time Initial length 70 bpm cycle length A segment Length options Cycle length for ± 10 selection bpm A 1b. Channel Grouping criteria Linear model fit grouping Peak polarities, magnitudes, and temporal position
2a.
Peak detection threshold
2b.
Peak downselection
Grouping overfits Segment insufficient Successful grouping Threshold calculation for a given average signal Peak amplitude
Too many small groups
Peak width
Group of peaks within ± 20 ms B 81 ms C
2c.
Comparison of peaks across average signals
Maximum intracomplex peak-topeak distance
3.
Definition of QRS complex windows
R-R interval ranges
Too few groups ≥3 groups of ≥3 channels Maximum minimum peak height identified over 1,000-ms increments Group of peaks within ± 0.1 mV B
Cycle lengths corresponding to heart rates of 40 to 120 bpm A Heart rate The heart rate associated calculation with the most-common R-R interval range 4. Identification of Section(s) of the Any interval between PM additional recording in complexes that is larger complexes which to detect than the calculated R-R additional peaks interval 5a. Comparison of Morphological Cross-correlation complex features Complex maximum peak morphologies amplitude and sign A I.e., a segment length equal to the length of one cardiac cycle at a heart rate of 70 bpm (860 ms). The additional segment length options range from 1500 ms to 500 ms and correspond to heart rates from 40 to 120 bpm. B Based on precision of 12-lead ECG grid paper C Based on difference (𝜇 + 2𝛿) between paired global and widest singlelead 12-lead ECG QRSd measurements (n = 150) Criteria without sources were determined during the development process.
Data Preprocessing Prior to analysis with the QRS complex detection algorithm, each recording underwent filtering, channel redaction, splicing, and baseline correction. Zero-phase filtering was performed with a 10th order, 0.5- to 25-Hz passband filter designed using the Matlab “window” design method [25-28]. An acceptable absolute (i.e., positive or negative) peak amplitude range of 0.10 to 4.0 mV, derived from 12-lead ECG data, was then applied to identify and remove channels of data from non-contacting or poorly contacting electrodes. A power spectrum analysis using the short-time Fourier transform was used to identify, remove, and splice around segments of the recording containing relatively large amounts of high-frequency noise.
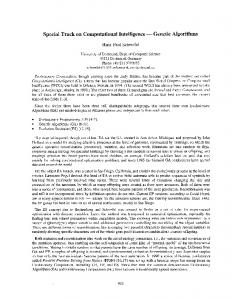
Automated QRS Complex Detection Algorithm The QRS complex detection algorithm consists of five main stages designed to identify all of the QRS complexes in a recording and subsequently classify them as PM or OM complexes without the use of template matching or any a priori assumptions regarding QRS complex morphology. These stages are (1) channel grouping and averaging, (2) peak detection, (3) definition of QRS complex windows, (4) identification of additional complexes, and (5) classification of QRS complex morphologies. Each main substep of the detection algorithm is shown in the flowchart in Fig. 1. The criteria used to execute each substep are presented, as applicable, in Table 1. Figs. 2 and 3 illustrate the main results of each stage using data collected in an LBBB patient at AdaptivCRT (aCRT) settings during a point in time when LV-only pacing with an atrioventricular delay of 90 ms was being delivered by the CRT device. This patient had approximately two premature ventricular contractions (PVCs) per minute and frequent premature atrial contractions, which caused uneven beat-to-beat (i.e., RR) intervals. For easier visualization of signal features, only the first 7.5 s of the 15-s recording are used in Figs. 2 and 3.
Fig. 1. QRS detection flowchart. The QRS detection method consists of five main stages. The alpha symbol (α) is used to indicate steps applied to each average signal separately. In stage 2, the steps indicated with the ± symbol are applied to the group of positive peaks (PP) and the group of negative peaks (NP) separately. In addition, the steps inside the rounded rectangle are performed for each average signal separately. In stage 3, the steps indicated with the © symbol are applied to each QRS complex separately. Also in step 3, the PR and QT intervals are approximated based on previously published equations [29, 30]. In stage 4, the previous steps indicated with the Q are repeated in numerical order. Parallelograms are used to indicate algorithm inputs and outputs.
The purpose of stage 1, channel grouping and averaging, is to create an average signal that is representative of each distinct ECG morphology present in the recording. Channel grouping and subsequent averaging leverage the redundancy of the MECGs to enhance large-amplitude, low-frequency features, which can then be used for peak detection. In order to efficiently and effectively group the channels, a time segment of data with sufficient non-isoelectric content to allow morphologic comparisons between channels must be extracted from the complete recording (see steps 1a and 1b in Fig. 1). Grouping of channels is independent of source electrode location. Fig. 2 shows the channel grouping and
2168-2372 (c) 2018 IEEE. Translations and content mining are permitted for academic research only. Personal use is also permitted, but republication/redistribution requires IEEE permission. See http://www.ieee.org/publications_standards/publications/rights/index.html for more information.
This article has been accepted for publication in a future issue of this journal, but has not been fully edited. Content may change prior to final publication. Citation information: DOI 10.1109/JTEHM.2018.2844195, IEEE Journal of Translational Engineering in Health and Medicine
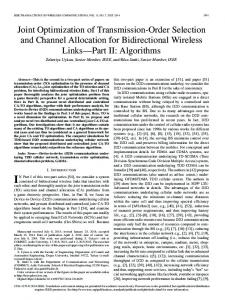
averaging results for the sample recording. Forty-five of the fifty-three electrodes were placed into five groups, as shown in the torso diagrams in Fig. 2. The average signal for each group is shown next to its respective torso diagram. The purpose of stage 2 is to identify the peaks in each average signal that have features characteristic of QRS complexes and that belong to the PM complexes. QRS complex peaks are assumed to be larger in amplitude and narrower than T-wave peaks. The number of same-polarity peaks with QRS-complex-like features is used to avoid morphologic outliers (i.e., peaks from OM complexes). Peak detection is performed in each average signal separately and based on a threshold specific to that average signal. The QRS complex peaks in each average signal are indicated with blue Xs in Fig. 2. After the QRS complex peaks are identified in each average signal, peaks belonging to the same QRS complex are identified across the average signals. Fig. 3 shows the peaks in three consecutive QRS complexes in the same sample recording.
Fig. 2. Example average signal groups and QRS peaks. Five groups of channels with distinct morphologies were identified in the sample recording (see text). The electrodes belonging to each group are shown in black (left). The associated average signals are shown to the right of the respective torso diagram, and the identified QRS complex peaks in each average signal are indicated with blue Xs.
In stage 3, each QRS complex is defined by a window (i.e. broad limits) around it. QRS complex windowing is necessary for subsequent morphological comparisons between complexes. Each QRS complex window is broadly defined to ensure that the leading and trailing edges the complex are accounted for: the limits of each window are wider than the complex itself and include an interval approximately equal to the PR interval preceding the first peak in the QRS complex, the interval over which the complex peaks occur, and an interval approximately equal to
the QT interval following the last peak in the complex. The complexes thus defined at the end of stage 3 are preliminarily classified as PM complexes. Fig. 3 also shows the window around each of the three QRS complexes. The purpose of stage 4 is to identify any QRS complexes present in the recording but not identified in stage 2 and to subsequently define the windows around them. This stage is necessary to ensure that as many PM complexes are identified as possible, and it utilizes the more-informed description of PM complex features available after stage 3 to identify any complexes erroneously excluded on the basis of the information available during stage 2. Any complexes resulting from this stage are preliminarily classified as OM complexes. In stage 5, the morphologies of identified complexes are compared to finalize their classification as either PM or OM. This final comparison uses the complete QRS complex (i.e., not only the peaks) to confirm classifications. Complexes with morphologies that do not match the other complexes in their class are then reassigned as needed.
Fig. 3. Example PM complexes. Three consecutive PM complexes identified in the sample recording (see text). The average signal for each of the five groups is shown in a different color. QRS complex peaks are indicated with black Xs. Vertical dotted lines mark the first and last peak in each complex. The RR interval is the distance (time) between the first peak in each complex and that of the following complex. The shaded area defines the broad window around each QRS complex, which is designed to encompass the leading and trailing edges of the complex.
At the completion of all of the identification and classification steps, all of the QRS complexes associated with the most prevalent electrical substrate behavior have been identified, as have those associated with anomalous or ectopic behavior. This information can subsequently be used to measure the PM-to-OM complex ratio (i.e., OM complex burden), perform other analyses of the electrical substrate behavior, and/or measure the QRSd in each PM complex, as described below. Automated QRS Complex Measurement Algorithm The QRSd measurement algorithm is designed to delineate and measure the array-specific (i.e., anterior and posterior) and global QRS complex durations in each PM
2168-2372 (c) 2018 IEEE. Translations and content mining are permitted for academic research only. Personal use is also permitted, but republication/redistribution requires IEEE permission. See http://www.ieee.org/publications_standards/publications/rights/index.html for more information.
This article has been accepted for publication in a future issue of this journal, but has not been fully edited. Content may change prior to final publication. Citation information: DOI 10.1109/JTEHM.2018.2844195, IEEE Journal of Translational Engineering in Health and Medicine
JTEHM-00024-2018.R1
5
complex identified with the QRS detection algorithm. TABLE 2 CRITERIA FOR QRSD MEASUREMENT ALGORITHM STEPS Step Action Parameter Value/Criteria Cross-correlation Morphological Peak polarities, features magnitudes, and Prior to Removal of temporal position QRSd array-specific Channel is morphologic algorithm outliers Exclusion outlier in the first, middle, and last PM criteria complex Identification of peak bounds
Leading or trailing peak boundary
Significance assessment
Order of candidate peak evaluation Peak position Peak amplitude
6. Peak significance criteria
7.
Removal of array-specific peak outliers
8.
Delineation of channel specific borders
9.
10.
Delineation of arrayspecific borders
Delineation of global borders
Criteria scaling factor Leading and falling phase slope Leading and falling phase curvature
Earlier of zero-crossing and concavity change In order of ascending proximity to the reference peak Occurs after preceding significant peak bounds Opposite polarity of preceding significant peak Ratio of candidate peak height to reference peak height Reference peak slope × scaling factor Reference peak curvature × scaling factor
Maximum peak-to-peak spacing
52 ms A
Amplitude