Ocean Sci., 10, 771–797, 2014 www.ocean-sci.net/10/771/2014/ doi:10.5194/os-10-771-2014 © Author(s) 2014. CC Attribution 3.0 License.
Qualified temperature, salinity and dissolved oxygen climatologies in a changing Adriatic Sea M. Lipizer1 , E. Partescano1 , A. Rabitti1,* , A. Giorgetti1 , and A. Crise1 1 OGS * now
– Istituto Nazionale di Oceanografia e di Geofisica Sperimentale, Trieste, Italy at: NIOZ Royal Netherlands Institute for Sea Research, Texel, the Netherlands
Correspondence to: M. Lipizer (
[email protected]) Received: 16 December 2013 – Published in Ocean Sci. Discuss.: 3 February 2014 Revised: 26 August 2014 – Accepted: 2 September 2014 – Published: 10 October 2014
Abstract. An updated climatology, based on a comprehensive data set (1911–2009) of temperature, salinity and dissolved oxygen, has been produced for the whole Adriatic Sea with the variational inverse method using the DIVA (Data-Interpolating Variational Analysis) software. Climatological maps were produced at 26 levels and validated with ordinary cross-validation and with a real vs. synthetic temperature–salinity diagram intercomparison. The concept of climatology–observation misfit (COM) has been introduced as an estimate of the physical variability associated with the climatological structures. In order to verify the temporal stability of the climatology, long-term variability has been investigated in the Middle Adriatic and the South Adriatic pits, regarded as the most suitable records of possible long-term changes. Compared with previous climatologies, this study allows a clear identification of the seasonal dynamic of the southern Adriatic, where a clear oxygen minimum is typically observed in the centre of the South Adriatic Gyre. New and better resolved features emerged from this analysis: (1) below 100 m all properties profoundly differ between the central and the southern Adriatic and seem characterized by different biogeochemical dynamics; (2) the South Adriatic Pit clearly shows the remote effects of the Eastern Mediterranean Transient, while no effect is observed in the Middle Adriatic Pit; (3) the deepest part of the southern Adriatic seems now to be significantly saltier (+0.18 psu since the period 1910–1914, with an increase of +0.018 decade−1 since the late 1940s) and warmer (+0.54 ◦ C since 1910– 1914) even though a long-term temperature trend could not be statistically demonstrated; (4) the Middle Adriatic Pit
shows a long-term increase in apparent oxygen utilization (+0.77 mL L−1 since 1910–1914, with a constant increase of +0.2 mL L−1 decade−1 after the 1970s).
1
Introduction
Nowadays many applications in the marine research field, as well as in the maritime management sector, take advantage of climatologies, i.e. estimates of the long-term averages of oceanographic variables. Reliable estimates of the environmental baselines, climatic trend estimates, improved initial conditions for numerical models and requirements for environmental status assessment according to European Environmental Policies (e.g. Water Framework Directive, WFD2000/60/EC; Marine Strategy Framework Directive, MSFD2008/56/EC) are just a few relevant examples of such applications. However, the climatology per se provides only an estimate of “average” fields, without explicitly showing the intrinsic dynamics connected with the short-term and long-term variability that measurements naturally incorporate. Several recent papers have pointed out that the Adriatic is undergoing long-term changes in its physical and biogeochemical properties; however, strong interannual variability, especially in the surface layers, has, up to now, prevented a consensus on the trend (Malaˇciˇc et al., 2006; Mauri et al., 2008; Solidoro et al., 2009; Vilibi´c et al., 2013). Some influence of climatic scales is unavoidable in the ocean climatology building process. An attempt to assess the importance of climatic variability has been, therefore, carried out
Published by Copernicus Publications on behalf of the European Geosciences Union.
772 by analysing the long-term variability of the deepest parts of the basin, which act as an integrator of signals coming from different processes acting in the basin (i.e. continental shelf pump, deep convection and lateral exchanges) that are supposed to respond to climate variability, as recently detected for the last 13 000 years in the sedimentary records collected in the South Adriatic Pit (Siani et al., 2013). The Adriatic Sea seems to be, at first glance, an ideal candidate for such climatological studies because it has been intensively investigated for more than a century, the first historical oceanographic expeditions date back to the end of the 19th century (Wolf and Luksch, 1881). During the 20th century, a large number of research and monitoring projects have provided a huge amount of data on physical, chemical and biological oceanography. Most papers have, however, addressed a specific area, such as the northern Adriatic (e.g. Supi´c et al., 2004; Jeffries and Lee, 2007; Tedesco et al., 2007; Giani et al., 2012), the central Adriatic (e.g. Marini et al., 2006; Russo et al., 2012; Vilibi´c et al., 2012) and the connection between the southern Adriatic and the Ionian seas (e.g. Klein et al., 2000; Manca et al., 2003; Manca et al., 2006; Civitarese et al., 2010). The most recent climatological description of the Adriatic Sea as a whole dates back to the seminal papers of Artegiani et al. (1997a, b), Gaˇci´c et al. (1997) and Zavatarelli et al. (1998), all based on data sets now more than 15 years old and based on objective analysis. Therefore, a climatological study of the whole basin based on recent data sets (up to 2009) is timely and in some sense required. The overall aim of this study, to provide information on the state of the whole Adriatic Sea and on its variability, is outlined in the following objectives: – to provide an updated climatology for some relevant properties of seawater (temperature, salinity and dissolved oxygen) for the whole Adriatic Sea, starting with a comprehensive data set spanning a whole century (1910–2009); – to derive, for each climatological field approximation, an uncertainty map that includes the approximation error, the representativeness error and the experimental error; – to assess long-term variability in temperature, salinity and dissolved oxygen of the deep waters of the central and southern Adriatic Sea. The paper is organized as follows: Sect. 2 presents the physiography of the Adriatic Sea, the description of the data sets used and the methodology adopted for oceanographic field reconstruction, for method calibration and validation and for long-term variability assessment; Sect. 3 presents the results and the discussion of the climatological maps produced, together with their associated uncertainty and the long-term variability of oceanographic properties of the deep waters; conclusions are Ocean Sci., 10, 771–797, 2014
M. Lipizer et al.: Qualified Adriatic climatology
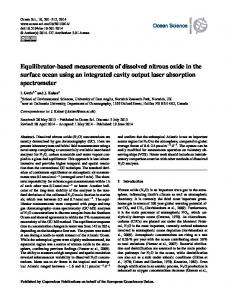
Figure 1. Adriatic Sea: bathymetry, morphology and main surface circulation (redrawn with modifications from Poulain and Cushman-Roisin, 2001). EAC: Eastern Adriatic Current; WAC: Western Adriatic Current; NAdG: North Adriatic Gyre; MAdG: Middle Adriatic Gyre; SAdG: South Adriatic Gyre.
then summarized in Sect. 4; additional plots are available at http://nodc.ogs.trieste.it/nodc/metadata/doi (doi:10.6092/ 2b8c0c65-3334-42e9-8551-4495fdfd7fd4).
2 2.1
Study area, material and methods Physiography and climatological circulation features
The Adriatic Sea lies in the northernmost part of the Mediterranean Sea and it is generally approximated as a rectangular basin 800 km long and 200 km wide, where the only connection with the Mediterranean Sea is through the Otranto Strait (72 km wide) (Fig. 1). The basin is characterized by a strong asymmetry along both axes due to increasing depth from the shallow northern basin (average depth 35 m) to the much deeper southern basins (average depth 800 m and deepest pit slightly over 1200 m), and due to the different morphology and bathymetry of the eastern and western coastal areas. In terms of its bathymetry, the Adriatic is generally divided in three sub-basins: (i) the northern Adriatic, defined as the area limited by the 100 m isobaths, represents the largest shelf area of the entire Mediterranean and is influenced by the largest river contribution in the whole basin (CushmanRoisin et al., 2001); (ii) the central Adriatic, with a mean depth of about 140 m, extends to the Palagruža Sill (170 m) and includes three adjacent depressions, the Jabuka (or Middle Adriatic Pit) (MAdP; 255, 270 and 240 m); and (iii) the southern Adriatic connects with the Ionian Sea through the www.ocean-sci.net/10/771/2014/
M. Lipizer et al.: Qualified Adriatic climatology Otranto Sill (780 m) and includes the deepest part of the basin, the South Adriatic Pit (SAdP; 1200 m) (Artegiani et al., 1997a). The general circulation pattern is cyclonic, consisting of the Eastern Adriatic Current (EAC), flowing northwards along the eastern coast with several re-circulation cells steered by bottom topography, and the Western Adriatic Current (WAC), flowing southwards along the Italian shelf. The WAC originates south of the Po River, the main continental input of the Adriatic Sea, and delivers freshwater southwards, as well as suspended and dissolved substances discharged by rivers along the Italian coast; it is delimited eastwards by a strong haline front. The EAC enters the Adriatic through the Otranto Sill on its eastern side and is composed, in the surface layer, of Ionian Surface Water (ISW) and Modified Atlantic Water (MAW) and, in the intermediate layer, of Modified Levantine Intermediate Water (MLIW). Part of the EAC recirculates along its northward flow, forming several permanent structures (South Adriatic, Middle Adriatic and North Adriatic gyres), and part of the EAC occasionally reaches the northernmost part of the basin (Poulain, 2001). Because of the significant freshwater river discharge, the Adriatic Sea is considered a dilution basin for the whole Mediterranean Sea (Raicich, 1996). The atmospheric forcing, particularly the wind regime, causes an annual mean heat loss of about 20 W m−2 which is, however, subject to significant interannual variability (12 W m−2 ) due mostly to winter climatic conditions (Cushman-Roisin et al., 2001; Cardin and Gaˇci´c, 2003). In the northern and southern Adriatic, the winter heat loss is rather energetic and it can lead to dense water formation (albeit through different physical processes, continental shelf mixing and open-ocean convection, respectively) which eventually influences the biogeochemical dynamics (Gaˇci´c et al., 1997). Over the large shallow continental shelf areas of the northern Adriatic, air–sea heat and evaporative fluxes are strong enough to provoke the formation of the densest water of the whole Mediterranean (Robinson et al., 1992) (North Adriatic Dense Water, NAdDW), which is characterized by relatively low salinity (38.5), low temperatures (occasionally < 10 ◦ C) and high density (29.8). NAdDW sinks to the bottom, flows southwards as a bottom density-driven current and eventually spills over the Otranto Strait, contributing to the formation of the deep waters in the eastern Mediterranean (Theocharis et al., 1998; Vilibi´c and Supi´c, 2005). In the southern Adriatic, dense water formation (Adriatic Dense Water – AdDW) is mostly related to open-ocean vertical convection processes favoured by the quasi-permanent cyclonic gyre, which enhances the doming structure bringing intermediate layer saline waters close to the surface (Manca et al., 2002). Several studies focusing mainly on the northern and central basins have demonstrated large interannual as well as seasonal and shorter-term variability in the circulation and in the physical and biogeochemical properties of the upper layer, which is mostly influenced by modifications in meteorological forcing and www.ocean-sci.net/10/771/2014/
773 continental inputs (e.g. Marini et al., 2006; Jeffries and Lee, 2007; Querin et al., 2007; Boldrin et al., 2009; Lipizer et al., 2011; Mihanovi´c et al., 2011). The surface layer is thus characterized by pronounced mesoscale variability which responds to the dynamics of the wind regime and of continental discharge (e.g. Bignami et al., 2007; Cosoli et al., 2012). In the intermediate and deep layers, recurrent variations in the hydrology and biogeochemistry have long been observed in the southern Adriatic and have been ascribed to the periodic ingression of saltier waters from the eastern Mediterranean (Buljan, 1953, and subsequent papers) and, more recently, to a bimodal oscillating circulation pattern involving exchanges between the Adriatic and the Ionian seas (BiOS; Bimodal Oscillating System) on a decadal scale (Borzelli et al., 2009; Gaˇci´c et al., 2010). The renewal of the deepest part of the Adriatic also depends on the sinking of dense water produced in the northern part of the basin (North Adriatic Dense Water; NAdDW) whose formation rate varies on an interannual timescale as a function of winter air–sea fluxes (Manca et al., 2002; Vilibi´c, 2003). As the deep water outflow from the Adriatic represents a key component for the Ionian and eastern Mediterranean deep circulation (Ovchinikov et al., 1985), modifications in the properties of deep waters influence the whole eastern Mediterranean (Roether et al., 1996; Rubino and Hainbucher, 2007; Bensi et al., 2013). Acronyms are defined in Appendix A (Table A1). 2.2
Data set
The data set used in this study includes all data of potential temperature (hereafter named temperature, T , expressed in ◦ C), salinity (S) and dissolved oxygen (DO; mL L−1 ) for the whole Adriatic Sea, from 1911 to 2009 (Fig. 2), available in the Italian National Oceanographic Data Centre (NODC) database managed by OGS (Istituto Nazionale di Oceanografia e di Geofisica Sperimentale). Data have been collected in the framework of several national and international research projects since 1911 by the institutions listed in Appendix A (Table A2). Merging data collected over a century, originating from different sources, acquired by different instruments and with different experimental protocols poses the problems of obtaining a consistent data set that can be used to provide reliable climatological maps and of long-term data comparability. However, even though intercomparison biases among data sets collected over a century cannot be absolutely ruled out, data managed by NODC undergo internationally standardized quality control (QC) procedures (Giorgetti et al., 2005; Holdsworth, 2010; SeaDataNet, 2010), which provide a common quality standard of the merged data: each datum is tagged with a quality flag according to its compliance with QC rules (e.g. out-ofrange values, presence of spikes, comparison with mean profiles and their associated standard deviations). The data considered here exhibit “good” or “probably good” QC value flags (1 or 2 following SeaDataNet scale). Furthermore, the Ocean Sci., 10, 771–797, 2014
774
M. Lipizer et al.: Qualified Adriatic climatology
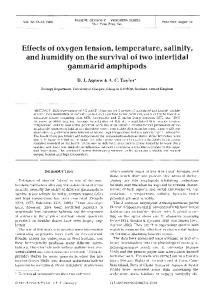
Figure 2. Number of stations per decade, season and variable and geographical distribution of stations (bottom right).
problem of pooling a whole century’s data, acquired with sensors and techniques with different nominal accuracies, has already been addressed by previous authors (Artegiani et al., 1997a; Zavatarelli et al., 1998), who showed that spatial and temporal variability in physical parameters and in dissolved oxygen concentration largely exceeds any discrepancy introduced by the different accuracies associated with the utilized methods. We paid special attention to exploring the uncertainty due to the field reconstruction method used and due to intrinsic variability of the data which results from the sum of experimental errors and of the natural variability of the different areas. The rational for choosing a centennial timescale compared with shorter alternative spans used for atmospheric climate science (30 years are suggested by IPCC protocols, 2001) is motivated by the following considerations: – the ocean has much higher inertia in responding to external vectors of changes, thus preserving a long-lasting record; – the last 30 years saw the central Mediterranean experiencing decadal-prominent variabilities in the circulation (Eastern Mediterranean Transient and possibly the BiOS) that would substantially affect the climatologies of the Adriatic Sea; – the paucity of data with a basin-scale spatial coverage requires the exploitation of largest data set available; Ocean Sci., 10, 771–797, 2014
– earlier climatologies used similar (but shorter) time frames, allowing a comparison among the different efforts. We are aware, however, that the presence of any trends will affect the climatologies but also lead (and be eventually detected) to an increase of the uncertainty which is discussed in Sect. 2.5. The climatological field reconstructions were performed on 26 levels, from the sea surface to the bottom, with decreasing vertical resolution. The depth levels correspond to the following depths (in metres): 0, 5, 10, 15, 30, 50, 60, 70, 80, 100, 120, 140, 150, 160, 180, 200, 225, 300, 350, 400, 450, 500, 600, 800, 1000 and 1200. Up to 50 m, the data considered in each level lie within a ±0.5 m layer, increased to ±1.0 for 60–180 m, to ±2.5 m for 200–800 m and ±10.0 m for 1000–1200 m. To highlight the main structures present in the basin at different depths, we present here climatological field reconstructions from the layers at 0, 50, 100 and 200 m; field reconstructions of the other layers are available at http://nodc.ogs.trieste.it/nodc/metadata/doi (doi:10.6092/2b8c0c65-3334-42e9-8551-4495fdfd7fd4). 2.3
Methodology for oceanographic field approximation
The new and updated climatology has been produced with the variational inverse method (VIM; Brasseur et al., 1996), using the software DIVA (Data-Interpolating Variational www.ocean-sci.net/10/771/2014/
M. Lipizer et al.: Qualified Adriatic climatology Analysis; Troupin et al., 2010). DIVA is an appropriate numerical implementation of VIM suitable for oceanographic data spatial analysis as it is designed to obtain a gridded field from the availability of non-uniformly distributed observations (Barth et al., 2010; Troupin et al., 2012). The code aims to solve 2-D differential or variational problems of the elliptic type with a finite element method (FEM) (Troupin et al., 2012), a method that is widely used in the oceanographic field to reconstruct variable fields in space (see for example Brasseur et al., 1996). Moreover, the DIVA software accommodates the irregular coastline and topography in the approximation process (Troupin et al., 2010, 2012). The finite-element grid covers indeed only the real domain of interest; therefore, barriers due to coastline and topography, bathymetric constraints and islands are taken into account. Under specific conditions, objective analysis and, in particular, the optimal interpolation (OI) method (Gandin, 1969; Bretherton et al., 1976), have been shown to be equivalent to a VIM analysis (McIntosh, 1990); this relationship constitutes a statistical justification of the variational analysis method and of the evaluation of the relative error maps (Brankart and Brasseur, 1998; Rixen et al., 2000; Troupin et al., 2012). Conversely, the FEM allows the solution to be determined on an unstructured grid, and this has been proven to be quite effective where bathymetries and coastlines are complex (Troupin et al., 2010, 2012), such as in the Adriatic basin. This has, moreover, a fundamental advantage over the OI, as the solution is intrinsically found only on the grid elements (which are by definition on the sea). Hence, the covariance across obstacles and land is reduced and the anisotropy of the background covariance is “naturally” introduced. Finally, OI implementation must consider all the data at the same time (or all the data located within a circle of influence around the point of interest, Menemenlis et al., 1997), generating and inverting a covariance matrix of the order of the number of data, while VIM needs to take into account only the number of points, called nodes, that define the trianglebased mesh. For example, there are 25 170 surface temperature measurements over the Adriatic and the basin has been divided into 4500 cells, resulting in a considerable decrease in the computational costs. Using DIVA allows then an efficient reconstruction of values from irregular positions of data points to a regular grid, and a statistical error estimate, ei , is provided with the approximated fields (Troupin et al., 2012; Beckers et al., 2014). The error estimate ei is based, as with the optimal interpolation, on a stationary, space-invariant real covariance function which is chosen a priori on the basis of physical intuition and depends on the correlation length (L), data coverage and the signal-to-noise ratio (SNR) of the data (Troupin et al., 2012).
www.ocean-sci.net/10/771/2014/
775 2.3.1
Mathematical background
The approximated field ϕ is one that will minimize the cost function J [ϕ] defined as (Troupin et al., 2010) J [ϕ] =
Nd X
µi L2 (d i − ϕ (x i , y i ))2
i=1
Z +
(α2 ∇∇ϕ:∇∇ϕ + α1 L2 ∇ϕ · ∇ϕ + α0 L4 ϕ 2 ) dD,
(1)
D
where d i are the original data, Nd is the number of data, L is the correlation length, ∇∇ϕ: ∇∇ϕ is the squared Laplacian of the field ϕ, D is the domain and where additional weights are included to balance the relative contribution of – α0 , which penalizes the field itself (anomalies minimization), – α1 , which penalizes gradients (minimization of spatial gradients), – α2 , which penalizes variability (regularization), – µ, which penalizes data–approximation misfits (objective). Minimization of Eq. (1) is actually performed by a finite element method (FEM), and hence there is a need for generating a finite-element grid. The correlation length (L) is the parameter that defines the dimensions of the grid. In this case, the real domain is split into a grid of triangular finiteelements. To have a proper approximation of the spatial dynamics, L/3 should be assumed as a typical scale of the grid element. This will guarantee that the dominant scales of spatial variability (captured by the correlation function) are properly resolved. In this work, the external parameters correlation length (L) and signal-to-noise ratio (SNR) have been chosen considering the targets of the specific study. The evaluation of their values directly from statistical properties of the data set turns out to be impossible due to inhomogeneous spatial and temporal distribution of data. A detailed analysis of the best parametrization has been carried out through an optimization procedure (generalized cross-validation) and by testing numerous parameter estimates. The automatic optimization procedure turned out to severely underestimate L as the uneven distribution of the data, often strongly correlated and clustered, led to values close to 0.1◦ . This L value would introduce spurious high-wavenumber structures dependent only on the data spatial distribution. Eventually, the selected value (L = 0.8◦ for physical parameters and 1.5◦ for DO) accounts for the length scale of the long-lasting structures that had to be captured by the climatological analysis. This dimensionless value for the correlation length is consistent with the resolution used in literature for the Adriatic basin (Zavatarelli et al., 1998; Giorgetti, 1999). We acknowledge the fact that the L value strongly depends on scientific Ocean Sci., 10, 771–797, 2014
776
M. Lipizer et al.: Qualified Adriatic climatology
intuition and previous knowledge instead of a statistical algorithm. The value assumed for the signal-to-noise ratio, estimated with a generalized cross-validation (GCV, Brankart and Brasseur, 1996), is SNR = 0.5. The low SNR value (0.5) is due to the fact that “noise”, in the case of climatologies, accounts for a number of processes active at different temporal and spatial scales (mesoscale, seasonal cycle, interannual or decadal variability, etc.) thus by far exceeding the simple accuracy and representativeness errors typical of synoptic data sets. The SNR value thus is able to accommodate the large (natural) variability reflected in the data distribution around the median. Several methods have been proposed to assess the error fields associated with DIVA products (Troupin et al., 2012; Beckers et al., 2014). Based on the assumption of the relationship between VIM and OI, in this analysis the error field associated with the approximated fields has been calculated according to the method based on the real covariance function, which allows a more accurate estimate of the error. A detailed description of the method is provided by Troupin et al. (2012). The maps produced at seasonal basis (winter: January– March; spring: April–June; summer: July–September; autumn: October–December) have a spatial resolution of 1/16◦ and the General Bathymetric Chart of the Oceans (GEBCO) bathymetry has been used, with 1/60◦ resolution (http:// www.bodc.ac.uk/data/onlinedelivery/gebco/), to identify the coastlines and the isobaths. 2.4
Validation methodology
All approximation and interpolation methods are based on some idealized assumptions of the underlying statistics that are seldom fully satisfied by real oceanographic observations, and an evaluation of the approximation process is, therefore, required. In this study, the validation process is implemented in two steps: temperature–salinity (T S) diagram comparison and ordinary cross-validation. To verify that the temperature and salinity approximation (carried out independently) does not negatively affect the combined T S properties of the water masses, a comparison was made between T and S charts obtained from the approximated and in situ data at 100 m depth (summer) and 200 m depth (winter), in order to explore the different behaviour during stratification and deep-mixing conditions. In addition, to validate the field approximation methodology and the robustness of the parameter choice, an ordinary cross-validation (OCV; Stone, 1974) was performed on the Adriatic data set: in this case, the seasonal temperature and salinity data sets of the surface and 100 m depth have been used. Ten data subsets were randomly created with 90 % of the original data each. The reconstructed values at the Ocean Sci., 10, 771–797, 2014
positions of data removed from each data subset were then compared with the measured ones from the whole data set. The data–approximation misfit was calculated by means of a quadratic norm, in the positions of the 10 % removed data, between the approximated values and the data. This metric can quantitatively assess the skill of the approximation method in reconstructing the field, but can also help in finding the “best” approximation parameters (Troupin et al., 2012). 2.5
Misfit and qualification of the climatological maps
The analysis of the misfit between in situ data and approximated fields has been carried out for all the layers discussed in the paper, for all parameters and for all seasons, in order to provide an estimate of the “uncertainty” of the climatologies. Let us define the uncertainty ui calculated in the ith position of the grid where Ni observations are available, as the climatology–observation misfit (COM): v uN i X 1 u t ui = (dm − yi )2 {m = 1, . . . , Ni } , Ni m=1 where yi is the value of the approximated field in the ith position, dm are the original data at the ith position and Ni is the number of in situ data available in the same point. The functional form is quite similar to the OCV but, in this case, COM is applied to all observations. The square-norm data–model misfit is widely used both in the OCV and in data assimilation techniques, and is formally similar to the above-defined quantity; however, the interpretation is different, as shown below. COM is here considered a measure of the uncertainty associated with the climatological map. The use of the observations in different frameworks (the climatology is one paradigmatic case) may introduce synopticity and representativeness errors in the processing of the information that may substantially increase the COM estimate, in particular when historical data sets spanning vast areas and several decades are processed. The seasonal approach in building this climatology is meant to reduce the synopticity error, relying on the hypothesis that the seasonal mode of variability is the dominant one. The noise associated with the ith observation is particularly difficult to appraise as it is derived from the sum of a number of random and deterministic errors (JCGM, 2008), specific to every measurement. The misfit produced by approximation solvers is commonly ascribed to the error introduced by the approximation procedure only and, as in the case of DIVA, a statistical error estimate ei comes along with the interpolation procedure. As described in Sect. 2.3, ei depends on L, on SNR and on data coverage, and not only on the local observation values and their variability.
www.ocean-sci.net/10/771/2014/
M. Lipizer et al.: Qualified Adriatic climatology
777
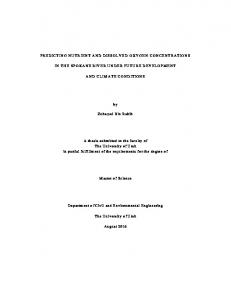
Figure 3. Comparison of T S diagrams based on unevenly distributed in situ observations (black) and approximated data on a regular 1/16◦ grid (red) in summer at 100 m (left) and in winter at 200 m (right).
Conversely, COM can be representative of real fluctuations in the sea properties that are generated by small-scale dynamics and by interannual variability. This is the case when the approximant function is loosely bound to the data (low SNR) and the combination of the noise associated with the observations with the approximation errors (ei ) are lower than COM itself. In this case, the uncertainty u is informative and can be used to provide additional information on the mesoscale processes active in the region. Unfortunately, rigorous statistical methods can seldom be applied because the a priori information and the statistics of the cumulative uncertainty are largely unknown. In practice, in homogeneous data sets the uncertainty ui and the approximation errors ei are expected to be space-invariant and the misfit should depend on the data coverage only (if the approximation parameters are held as constant). In climatological cases, the data are generally abundant and, therefore, the spatial structure of the misfit should exhibit limited variation. If this is not the case, and all the above assumption are still valid, this can be the symptom of an intrinsic variability captured by the observations. As an example, in the case of recurrent presence of fronts, the temporal distribution of the observations is not unimodal and the approximation cannot represent, at the same time, the most probable conditions. To display the misfit, u, associated with each climatological map, the median misfit was computed for four reference levels (0, 50, 100, 200 m), for four seasons and expressed as normalized percent deviation from the value of the approximated field (yi ). 2.6
Determination of long-term variability
Long-term variability in the properties of the deep waters of the central and southern Adriatic was investigated using www.ocean-sci.net/10/771/2014/
all data collected during the period 1911–2009 and available in the NODC database (Table A2). For the central Adriatic, “deep waters” were defined as those below 150 m, in order to limit the effect of seasonal thermocline changes (Artegiani et al., 1997a; Zavatarelli et al., 1998) and in order to focus on the properties of the Jabuka Pit. For the southern Adriatic, deep waters were defined as those below 800 m, in line with earlier definitions (Zavatarelli et al., 1998), in order to exclude from the analysis the Modified Levantine Intermediate Water (MLIW), which is usually centred around 150–400 m (Zavatarelli et al., 1998; Vilibi´c and Orli´c, 2001). In order to use a statistically adequate number of data for each sub-basin, the temporal evolution of temperature, salinity and oxygen concentration has been evaluated from median values computed over periods of 5 years, thus filtering out the shorter timescales. The time series are presented as box plots showing median, interquartile (IQR) and min–max range. Finally, temperature and salinity data were used to derive the equilibrium saturation concentration of dissolved oxygen, and the derived variable apparent oxygen utilization (AOU; mL L−1 ) was calculated from the difference between the saturation concentration and the measured dissolved oxygen concentration. Long-term variability in AOU was used in order to achieve a better understanding of deep water variability and renewal. To verify whether differences between median properties characterizing the five-year periods were statistically significant, the non-parametric unpaired Mann–Whitney U test (Mann and Whitney, 1947) was used because of the nonnormal distribution of data. Statistically significant differences were considered those with p values lower than 0.05. The non-parametric Mann–Kendall (MK) test was used together with Sen’s slope estimator for the determination of
Ocean Sci., 10, 771–797, 2014
778
M. Lipizer et al.: Qualified Adriatic climatology
long-term trend and slope magnitude (Mann, 1945; Sen, 1968; Kendall, 1975). Statistical analysis was performed with Statistica7 StatSoft, XLSTAT software and Kendall– Theil Robust Line V 1.0.1 (Granato, 2006). Several figures were produced with Ocean Data View (ODV; Schlitzer, 2012).
3 3.1
Results and discussion Validation
One of the innovative approaches of this study consists in the validation of climatological maps by means of a series of objective assessments of the approximation performances. In this way, the reader can appreciate the reliability of the results presented. As far as we know, no similar exercise has been published for the Adriatic yet. Figure 3 shows the comparison between in situ and reconstructed T S data from summer at 100 m (left) and winter at 200 m depth (right). The comparison between in situ and reconstructed T S diagrams shows the lower dispersion in the reconstructed fields, owing to the fact that climatology partially filters out the variability, capturing only the “core” of the signal. Both data sets lie largely in the same range of density anomaly, between 28.75 and 29.25 kg m−3 in summer and between 28.75 and 29.5 kg m−3 in winter. In summer, densities cluster along the 29.00 kg m−3 isopycnal, with the exception of the warmest waters that are less dense than 29.00 kg m−3 . The winter T S diagram exhibits the presence of two distinct patterns (more evident in the climatology) connected to the different water masses (MLIW, lighter, warmer and saltier; Middle Adriatic Deep Water (MAdDW), denser, colder and fresher) that characterize the thermohaline properties of this level (Artegiani et al., 1997a). A salient feature common to both T S diagrams is the good preservation of salinity range while the reconstructed values apparently show generally higher temperatures. The difference is expected given the large dispersion of in situ data and the different spatial coverage and abundance of data (unevenly distributed) and approximated fields (regular grid). The next step of calibration and validation, based on ordinary cross-validation, shows that outputs of OCV (Fig. 4) are reassuringly independent of the spatial distribution, showing a mean misfit between the original data set and each data subset that depends on season and depth but is, in all cases, lower than 0.11 ◦ C for temperature and lower than 0.06 for salinity. Within each season and level, the misfit of all data subsets lies generally within a narrow interval. This distribution depends on the variability of the spatial structures (larger at the surface), making it sometimes difficult to reconstruct the in situ data and thus increasing the misfit. The variability in the misfit can also be explained by taking into account the selection of the data subsets that do not consider the Ocean Sci., 10, 771–797, 2014
Figure 4. Mean misfit in temperature (a) and in salinity (b) in the surface layer (solid lines) and at 100 m depth (dashed lines) derived from ordinary cross-validation.
mutual correlation among data, i.e. all the data are assumed to be uncorrelated. In this way, even if the same number of data points is subtracted in building each data subset, the total available information is not equal. As expected, for both parameters, misfits were larger in the surface level than at 100 m depth, due to the larger space and time variability of the oceanographic fields. It is worth noting that for temperature (Fig. 4a), winter surface misfits (0.03 ◦ C) are similar to those at 100 m depth, largely due to the vigorous mixing that generally takes place in this season, homogenizing the water column. Conversely, the salinity (Fig. 4b) shows a stronger difference between the two levels, mostly because the freshwater input signal is limited to the surface. 3.2 3.2.1
Climatological maps Surface
The surface distribution of temperature, salinity and dissolved oxygen concentration exhibits a pronounced seasonal cycle (Fig. 5.1–5.12) and strong longitudinal gradients, particularly evident in salinity (Fig. 5.5–5.8) and DO throughout the year (Fig. 5.9–5.12), and only in winter and autumn in the case of temperature (Fig. 5.1, 5.4). Winter (January–March) is characterized by a pronounced north–south and a less pronounced, but still well recognizable, west–east gradient in surface temperature, with the lowest values (< 9 ◦ C) in the northernmost part of the basin and close to the north-western Italian coast. The cold waters’ southward pathway is geostrophically confined along www.ocean-sci.net/10/771/2014/
M. Lipizer et al.: Qualified Adriatic climatology
779
Figure 5. Climatological map of surface temperature (◦ C) in winter (1), spring (2), summer (3) and autumn (4).
Figure 5. Continued. Climatological map of surface salinity in winter (5), spring (6), summer (7) and autumn (8).
the western coast, delineating pronounced horizontal gradients that are clearly recognizable even south of the Gargano Peninsula. Warmer waters (T > 13 ◦ C), typical of the EAC, occupy the eastern part of the basin (Fig. 5.1). Surface salinity distribution shares some common features with surface temperature, having the river-diluted WAC (S < 37) as the dominant signal (Fig. 5.5). In the southern Adriatic, an area of high salinity (S > 39) is recognized as corresponding to the SAdP. Dissolved oxygen surface distribution seems highly related to temperature and salinity, with the highest values corresponding to the WAC (Fig. 5.9). In spring (April–June) spatial gradients are much weaker: the warmer EAC (T > 18 ◦ C), flowing along the eastern coast and spreading westwards into the South (SAdG) and Middle Adriatic gyres (MAdG), is clearly identified through its temperature signal, and the coldest surface waters (< 16 ◦ C) are found along the north-eastern side of the basin (Fig. 5.2). As reported by Gaˇci´c et al. (1997) from satellite sea surface temperature (SST) data, spring is characterized by inversion of the horizontal temperature gradient in the northern Adriatic, as the coldest waters are present along the eastern coast. In contrast to winter, in spring lowersalinity waters (S < 37) are distributed over a larger area and tend to occupy a large part of the northern Adriatic and the
low-salinity Po River plume shows a north-eastward propagation up to the eastern Croatian coast (Fig. 5.6). In the southern Adriatic, a salinity decrease consequent to freshwater discharge is well recognizable close to the Albanian coast, confirming the patterns previously described by Artegiani et al. (1997b). Seasonal heating drives a moderate decrease in the surface oxygen concentration; however, the east–west gradient is still clearly recognizable, with higher oxygen concentrations (DO > 6 mL L−1 ) in the northern and western regions of the Adriatic, close to the Po River mouth and to rivers in the northernmost part of the basin (Fig. 5.10). During summer, waters of Ionian origin flowing along the eastern coast are slightly colder (23 ◦ C) than the rest of Adriatic surface waters and the coldest waters are present along the north-eastern coast (Fig. 5.3). The WAC is not apparent either in spring or in summer from the temperature field, while in both seasons lower-salinity waters (S < 37) are distributed over a wide area and tend to occupy a large part of the northern Adriatic (Fig. 5.7). This distribution probably derives from the wind-driven vorticity input which creates a double gyre system that, together with the strong stratification, facilitates the entrainment of Po River waters in the northernmost part of the sub-basin (Poulain, 2001; Jeffries and Lee, 2007). Dissolved oxygen concentration has furthermore decreased
www.ocean-sci.net/10/771/2014/
Ocean Sci., 10, 771–797, 2014
780
Figure 5. Continued. Climatological map of surface dissolved oxygen (mL L−1 ) in winter (9), spring (10), summer (11) and autumn (12).
compared to spring (DO mostly < 5.5 mL L−1 ), the distribution is fairly uniform except for the north-western coastal maxima recurrent in all seasons (Fig. 5.9–5.12). Autumn is characterized by cooling over the whole basin by the clear signal of the cold WAC (T < 16 ◦ C) confined along the western coast, and by the warmer EAC (T > 18 ◦ C) along the south-eastern coast (Fig. 5.4). Autumn salinity distribution recalls the winter pattern, with lowersalinity waters confined as a narrow strip along the coast (Fig. 5.8) and also characterized by high oxygen concentrations (DO > 6.0 mL L−1 ) (Fig. 5.12). A common pattern present over all seasons is the clear signal of the river-diluted WAC, confined along the Italian coast by sharp horizontal gradients (usually stronger in winter and in autumn) and extending as far as the Gargano Peninsula. A remarkable feature observed mostly in spring and summer is the north-eastwards propagation of low-salinity waters from the Po River plume, nearly reaching the eastern Croatian coast (Fig. 5.6, 5.7), suggesting that floods can alter the usual Po plume dynamics. The presence of this (weaker) Po signal off the Italian coast in a long time series suggests that the episodic flood extreme events are recurrent enough Ocean Sci., 10, 771–797, 2014
M. Lipizer et al.: Qualified Adriatic climatology
Figure 5. Continued. Climatological map of temperature (◦ C) at 50 m depth in winter (13), spring (14), summer (15) and autumn (16).
to influence the climatology. The seasonal cycle in dissolved oxygen concentration in the surface seems highly influenced by the temperature evolution, with the highest values over the basin in winter, corresponding to the coldest waters, and lowest in summer (Fig. 5.9–5.11). This general pattern is consistent with the strong dependence of oxygen concentration on hydrological parameters, as gas solubility in seawater is inversely correlated with temperature and salinity. The clear signal of the WAC can also be observed in DO concentration which shows, in all seasons, a considerable gradient along the western Adriatic coast with the highest concentrations associated with the lowest salinity (Fig. 5.5–5.8 and 5.9–5.12). This pattern, which is observed also during seasonal surface warming (Fig. 5.10–5.11), indicates that along the western coastal areas, influenced by the WAC, oxygen is probably mainly the result of enhanced primary production fuelled by nutrient-rich waters south of the Po River (Penna et al., 2004; Mauri et al., 2007; Kraus and Supi´c, 2011). In order to provide an estimate of the uncertainty of the climatological patterns observed, the average climatology– observation misfit associated with the seasonal climatologies is presented in Sect. 3.3.
www.ocean-sci.net/10/771/2014/
M. Lipizer et al.: Qualified Adriatic climatology
Figure 5. Continued. Climatological map of salinity at 50 m depth in winter (17), spring (18), summer (19) and autumn (20).
3.2.2 50 m depth The 50 m depth layer is characterized, in all seasons, by remarkable differences between the northern and southern Adriatic and by much lower seasonal variability. In winter, cold waters fill the northern Adriatic and the 100 m isobath, delimiting the northern Adriatic (Fig. 1), seems to limit the northwards propagation of the warmer EAC, resulting in a marked north–south and east–west temperature gradient (Fig. 5.13). The strong temperature gradient present, corresponding to the deepening of the bottom, may result from the sinking of the cold (thus denser) waters of the northern Adriatic shelf below the warmer waters of the central basin, thus forming, at this depth level, a strong thermal front. Low-temperature waters, typical of the northern shelf, are observed all along the western coast, until the Otranto Strait. Lower-salinity waters occupy the margins of the basin and the lowest salinities are present in the western part of the Otranto Strait (lowest salinity core < 38.30) (Fig. 5.17), which is characterized also by low temperature (Fig. 5.13). This feature, which has not been clearly pointed out in previous studies, is presumably due to the progressive sinking of the WAC (retaining the signal of the Po River waters) along the Adriatic and along the slope, and traceable www.ocean-sci.net/10/771/2014/
781
Figure 5. Continued. Climatological map of dissolved oxygen (mL L−1 ) at 50 m depth in winter (21), spring (22), summer (23) and autumn (24).
in this depth layer in the Otranto Strait (Crise and Manca, 1992). Conversely, the South Adriatic Pit is characterized by a well-defined area of high salinity (S > 38.6), low oxygen (DO < 5.4 mL L−1 ) (Fig. 5.21) and by a temperature relative minimum (T < 13.5). This feature is most probably produced by the winter-intensified cyclonic circulation (Poulain, 2001) that induces the uplifting of saltier and lower-oxygen deeper waters inside the SAdG. In the northern part of the shelf, dissolved oxygen presents a limited area of low concentration in (DO < 5.4 mL L−1 ), southward of the Po River outflow, owing to the combined effect of the strong and permanent haline stratification which limits ventilation of the bottom layer and of oxidation of the large loads of organic matter delivered by the river (Artegiani et al., 1997b; Simunovic et al., 2003; Russo et al., 2012). In spring, the temperature distribution (Fig. 5.14) maintains similar patterns with respect to winter. Salinity presents a pronounced decrease in the northern shelf area and close to Albanian coast. The well-defined high-salinity spot corresponding to the South Adriatic Pit is, however, less evident in spring and summer (Fig. 5.18–5.19). Dissolved oxygen distribution in spring (Fig. 5.22) presents a strong north–south gradient and reduced concentration in the northern shelf area (< 5.6 mL L−1 ) and inside the SAdG (< 5.6 mL L−1 ). From Ocean Sci., 10, 771–797, 2014
782
Figure 5. Continued. Climatological map of temperature (◦ C) at 100 m depth in winter (25), spring (26), summer (27) and autumn (28).
winter to spring and, to some extent, also from spring to summer, oxygen concentration shows an increase in this depth layer, which is characteristic of the whole Adriatic, despite the seasonal warming which decreases gas solubility. This overall increase in the 50 m depth layer is the result of phytoplankton productivity, as confirmed by the presence of a deep chlorophyll maximum at this depth (Socal et al., 1999; Nincevic et al., 2002). In fact, seasonal thermohaline stratification prevents the sub-surface layer gas exchange with the atmosphere, and oxygen released as a by-product of photosynthesis can accumulate, thus developing the subsurface oxygen maximum typically observed at this depth (Artegiani et al., 1997a; Zavatarelli et al., 1998; Socal et al., 1999). Despite the general increase in DO concentration, the extension of the low-oxygen area in the north-western shelf increases with the progress of the season, reaching its maximum in summer when both thermohaline stratification and microbial respiration processes are highest (Justi´c et al., 1993; Zavatarelli et al., 1998; Celussi and Del Negro, 2012) (see also maps at 30 m in http://nodc.ogs.trieste.it/nodc/metadata/doi). In summer, colder waters (T < 14.0 ◦ C) are confined in the northern part of the Adriatic Sea, and a warmer water intrusion (T > 15.0 ◦ C) is evident in the central area Ocean Sci., 10, 771–797, 2014
M. Lipizer et al.: Qualified Adriatic climatology
Figure 5. Continued. Climatological map of salinity at 100 m depth in winter (29), spring (30), summer (31) and autumn (32).
(Fig. 5.15). The salinity distribution remains similar to spring (Fig. 5.19), while oxygen distribution presents a characteristic spatial pattern (Fig. 5.23). The low-DO concentration water (DO < 5.5 mL L−1 ), always present in the north-western part, occupies a wide part of the northern shelf along the Italian coast. A strong horizontal gradient is present at this depth, with the lowest DO in the north-western shelf and increased concentration in an area roughly corresponding to the border of the MAdG (Fig. 1). This pattern, previously seen in the MEDAR/MEDATLAS climatology (Russo et al., 2012), is consistent with enhanced biological respiration corresponding to the Po River influence (Justi´c et al., 1993) and with the summer DO maximum associated with the subsurface chlorophyll maximum observed offshore, in the area corresponding to the 100 m isobaths (Totti et al., 2000). The shape of the high oxygen area fits well, in fact, with the cyclonic circulation of the MAdG and is coherent down to 100 m depth (Fig. 5.35 and maps of 60, 70, 80 m in http://nodc.ogs.trieste.it/nodc/metadata/doi). The highest temperature is observed in autumn, and the northward propagation of the EAC is the dominant feature, recognizable by its warmer temperature (T > 16 ◦ C) (Fig. 5.16). The salinity pattern resembles the winter distribution, with lower salinity encountered along the western coast as far as the Otranto Strait and a well-defined www.ocean-sci.net/10/771/2014/
M. Lipizer et al.: Qualified Adriatic climatology
783
Figure 5. Continued. Climatological map of dissolved oxygen (mL L−1 ) at 100 m depth in winter (33), spring (34), summer (35) and autumn (36).
Figure 5. Continued. Climatological map of the 200 m layer of temperature (◦ C) (37), salinity (38) and dissolved oxygen (mL L−1 ) (39) in winter.
high-salinity core in the South Adriatic Pit (Fig. 5.20). Dissolved oxygen displays an overall decrease which is consistent with the seasonal erosion of the thermocline stratification and mixing with overlying oxygen-poorer waters (Fig. 5.24) (Kovaˇcevi´c et al., 2003). As in winter (Fig. 5.21) a lowoxygen area (< 5.4 mL L−1 ) is clearly recognizable inside the SAdG.
(T > 13.5 ◦ C, S > 38.6) protruding along the eastern flank of the basin and crossing the Palagruža Sill. In autumn, temperature (Fig. 5.28), salinity (Fig. 5.32) and oxygen distributions (Fig. 5.36) resemble the winter pattern, with a clear separation of the colder, fresher and oxygen-richer waters in the central basin and the pool of saltier and oxygenpoorer waters confined inside the SAdG. The SAdG signature (high-salinity, low-oxygen core) is stronger in autumn and winter as the intensified cyclonic circulation traps the waters entering the Otranto Strait in a recirculation that homogenizes its properties (see also other depth layers, http: //nodc.ogs.trieste.it/nodc/metadata/doi).
3.2.3 100 m depth In the 100 m layer, temperature and salinity show limited seasonal variability (Fig. 5.25–5.32) and hydrological properties and dissolved oxygen concentrations clearly distinguish the central from the southern Adriatic. Dissolved oxygen concentration presents a general decrease from spring to summer (Fig. 5.34–5.35), indicating the prevailing effect of bacterial production processes in this layer (Šoli´c et al., 2008). As already pointed out at 50 m depth, the western–central basin is occupied by colder, fresher and oxygen-richer waters originating in the northern Adriatic. Bathymetry seems, thus, to act as an obstacle, limiting exchanges between the two basins. In all seasons, but mostly in spring, summer and autumn, the central Adriatic presents a west–east thermal and salinity gradient which is due to the spreading of the MLIW, recognizable by the saltier and warmer waters www.ocean-sci.net/10/771/2014/
3.2.4
200 m depth
The 200 m climatology includes only the Middle Adriatic and the South Adriatic pits, which are physically separated by the shallow (170 m) Palagruža Sill. At 200 m, seasonal variability is hardly recognizable, but all seasonal maps (see http://nodc.ogs.trieste.it/nodc/metadata/doi) show clear differences between the properties of the central and the southern Adriatic waters. In winter, presented here as an example based on the best data coverage, as well as in the other seasons (http://nodc.ogs.trieste.it/nodc/metadata/doi), the two deep basins are characterized by significant differences in Ocean Sci., 10, 771–797, 2014
784
M. Lipizer et al.: Qualified Adriatic climatology
temperature (Fig. 5.37) and salinity (Fig. 5.38); the Middle Adriatic Pit is colder (T < 12 ◦ C) and fresher (S < 38.5) in comparison to the same depth layer in the southern Adriatic (T > 13.5 ◦ C; S > 38.6). Dissolved oxygen concentration at this depth is higher (mostly > 5.2 mL L−1 ) in the MAdP than in the SAdP (< 5 mL L−1 ); however, the patchy distribution prevents identification of evident patterns. The properties in the deepest parts of the Adriatic are discussed in more detail in Sect. 3.4 and climatological maps of the other layers are available at http://nodc.ogs.trieste.it/ nodc/metadata/doi (doi:10.6092/2b8c0c65-3334-42e9-85514495fdfd7fd4). 3.2.5
Comparison with earlier climatologies
The climatological maps (produced by using independent data sets) presented in this article (Fig. 5.1–5.39) exhibit a marked spatial coherence among the variables. This testifies to the importance of the driving dynamical processes (i.e. Po River plume, WAC, EAC, SAdG) acting on the water properties under consideration. This coherence allowed us to provide an interpretation of the dissolved oxygen climatologies consistent with the distribution of thermohaline properties. Spatial coherence was not so clear in the maps presented in Russo et al. (2012) for northern–central Adriatic where shortscale spatial variability is retained. Artegiani et al. (1997b) maps show only partially coherent structures on the surface, also reflecting a lack of data (i.e. in the southern Adriatic), while the scarcity of data at greater depths (100 and 200 m) prevented a reliable reconstruction of the fields. The overall pattern of the surface distribution of physical properties substantially agrees with the earlier climatology of Artegiani et al. (1997b), Zavatarelli et al. (1998) and Russo et al. (2012). In the deeper layers, this climatology provides, for the first time, a clear evidence of the persistence and seasonal variability of the properties of the key dynamical structures that govern the Adriatic Sea (SAdG, the deepening of the WAC, the deep oxygen minimum layer in the northern Adriatic). In contrast to earlier climatologies, this analysis has allowed a clear identification of the seasonal dynamic of the southern Adriatic, which is known to be a key area for the circulation of the whole eastern Mediterranean. Lastly, for the first time, a climatology has been estimated at high vertical resolution (26 levels, http://nodc.ogs.trieste.it/nodc/metadata/doi), thus allowing a better understanding of the dynamic of the Adriatic, which is very attractive also for model applications. A quantitative comparison between the different climatologies turned out to be difficult both because of the different data spatial coverage and because of the lack of availability of earlier interpolated fields. The comparisons between satellite SST climatology (Marullo et al., 2007; SeaDataNet Climatologies, 2013) and these climatological maps based on in situ data gave consistent results in all seasons as the principal patterns (e.g. Ocean Sci., 10, 771–797, 2014
latitudinal and longitudinal thermal gradients) are well revealed by both products. 3.3
Average climatology–observation misfits
The seasonal variability in the uncertainty (u), for each depth layer presented above (Fig. 5.1–5.39), is summarized in Table 1, which shows the median of the climatology– observation misfit, expressed as a percent deviation from the climatology, and the 95th percentile values of the u distribution for the three parameters (temperature, salinity and oxygen) for the four seasons. The 95th percentile values have been chosen to provide a spread indicator of the misfit. Table 1 shows that the surface layer exhibits the highest uncertainty, in both temperature and salinity, and that this is greatest in spring and autumn for temperature and in summer for salinity. This can be ascribed to the high variability in the forcing fields (wind events, river run-off and related plume dynamics, etc.) influencing mostly the upper layer during the stratified seasons. The surface DO presents an almost constant uncertainty; however, very high 95th percentile values (all exceeding 26.3 %) are found. This may be due to the temperature- and salinity-dependent solubility, to the different sampling techniques adopted over time or to the relative paucity of data if compared with T and S. In the sub-surface layers, the uncertainty shows a limited seasonal variability for temperature with a peak autumn 95th percentile value below 12.3 % at 50 m and 8.3 % at 100 m. Uncertainty in salinity is low (< 0.5 %) and constant throughout the year, with the maximum 95th percentile values in all seasons always below 1.0 % in all layers. Conversely, the uncertainty associated with dissolved oxygen climatology in sub-surface layers is higher (median up to 18.5 % at 200 m in autumn) and can reach the highest 95th percentile values in spring and autumn (over 50 % in all layers). This result implies that the interpretation of the DO climatology in the deeper layers must be carried out with some caution and that, in the worst case, the misfit can exceed 51 %. Considering the spatial distribution of the uncertainty (Fig. 6), it is remarkable that during winter the surface temperature uncertainty (Fig. 6a) exhibits a different distribution with respect to salinity at the same depth (Fig. 6b): salinity uncertainty is highest (up to 30 %) in the north-western part of the Adriatic Sea, influenced by the freshwater input from the Po River. The salinity uncertainty pattern shows a pronounced tongue extending from the Po River mouth towards the centre of the northern Adriatic, and the higher u indicates an area where climatology–observation misfit is relevant, and, consequently, a large variability in the offshore freshwater penetration. This area has been, in fact, demonstrated to be very sensitive to prevailing wind regimes and river forcing which can drive the spreading of the Po River plume in opposite directions (Jeffries and Lee, 2007). In this case, the uncertainty map provides clear and additional www.ocean-sci.net/10/771/2014/
M. Lipizer et al.: Qualified Adriatic climatology
785
Table 1. Uncertainty u associated with climatological maps of temperature, salinity and dissolved oxygen, expressed as percent deviation from the approximation (%), represented as the median and 95th percentile value misfit of the seasonal maps. Bold font indicate the highest median and 95th percentile values for each variable. Winter
Level
Spring
Summer
Autumn
Median
95 %
Median
95 %
Median
95 %
Median
95 %
0m 50 m 100 m 200 m
4.6 2.8 2.5 1.4
18.9 9.5 7.8 4.9
14.9 3.8 3.1 1.8
27.9 9.2 7.3 4.9
5.6 3.8 3.3 2.0
12.5 9.3 4.2 5.6
11.7 4.8 3.3 2.2
27.6 12.2 8.3 5.3
Salinity
0m 50 m 100 m 200 m
0.9 0.3 0.2 0.1
8.4 0.8 0.6 0.4
1.3 0.3 0.2 0.1
8.1 0.9 0.6 0.4
2.1 0.4 0.2 0.1
8.8 0.9 0.8 0.4
1.2 0.3 0.2 0.1
10.2 0.8 0.5 0.4
Dissolved oxygen
0m 50 m 100 m 200 m
6.1 5.9 11.4 14.2
51.6 34.8 44.0 35.7
6.4 4.3 3.9 4.7
26.3 50.8 50.7 50.6
6.0 7.7 5.0 5.6
34.3 39.2 50.7 46.8
7.0 9.0 6.1 18.5
32.9 51.1 51.2 50.9
Temperature
information on the modes of surface circulation in the northern Adriatic. Temperature uncertainty shows a more uniform spatial distribution and a latitudinal gradient, with higher u in the northern Adriatic: this can be related to the stronger impact and to the erratic behaviour of energetic atmospheric forcing such as the Bora winds (strong north-eastern katabatic winds) responsible for intense winter cooling. Contrary to the intuitive belief that more data density will end up with a better statistical estimate, Fig. 6a and b show that the area of maximum data density (the northern Adriatic) is associated with the maximum uncertainty, probably because in this area the data distribution is far from being Gaussian, and in the climatology we find a superposition of different, temporally disjointed, patterns. Conversely, the relative approximation error field e (Fig. 6d, e) is at a minimum in the northern Adriatic, as this is highly dependent on the data density. This means that the uncertainty is representative of an actual sitespecific variability which, by definition, the climatology itself is unable to represent. During summer, the surface temperature and salinity uncertainty (Fig. 7a, b) is lower than in winter and more uniformly distributed along the whole basin; the salinity uncertainty is more pronounced in a narrow coastal zone, stronger in proximity to the major river mouths (Fig. 7b). The characteristic tongue observed in winter (Fig. 6b) is no longer recognizable in summer, probably due to the weaker wind regime, the lower continental inputs and the spreading of the lighter freshwater over the entire northern basin, typical of stratified conditions (Jeffries and Lee, 2007). The same consideration on the approximation error fields valid for winter still holds for summer (Fig. 7d and e). Dissolved oxygen uncertainty at the surface does not reveal any clear spatial distribution, unlike temperature and salinity; even though, as in the cases of T and S, the northern www.ocean-sci.net/10/771/2014/
Adriatic is characterized by relatively higher uncertainty, high values (up to 40–70 %) are also calculated in the south, especially in winter (Fig. 6c). Due to the dependence of oxygen solubility on temperature and (to a lesser extent) on salinity, the expected oxygen uncertainty should follow the temperature. This is weakly recognizable in winter (Fig. 6a, c), when high uncertainty is found in the northern and in the southern Adriatic; however, in the case of DO uncertainty, several outliers are apparently distributed randomly all along the basin in winter (Fig. 6c) and summer (Fig. 7c). This discrepancy and the relatively high uncertainty can be ascribed to larger experimental errors in sampling and analytical determination of surface oxygen concentration, due to sea–air interactions, than in temperature and salinity. Considering that half of the measurements are below 7 % uncertainty (Table 1), the outcomes of the approximation (climatological maps) are robust enough for climatological purposes. Finally, the approximation error patterns for the two seasons (Figs. 6f and 7f) are not far from those obtained for T and S in both seasons (Figs. 6d, e, 7d, e) with some exception for the coastal areas not covered by observations, which further indicates the prevalent dependence of e on data density. Comparing the uncertainty (Figs. 6a–c and 7a–c) and error field maps (Figs. 6d–f and 7d–f) it is possible to evaluate the validity of the climatology map. The error field map indicates that, where the number of data is low, the error field is high and the reliability of the approximation is low. Conversely, the uncertainty map shows how the algorithms used for interpolation mask the natural variability of the data.
Ocean Sci., 10, 771–797, 2014
786
M. Lipizer et al.: Qualified Adriatic climatology
Figure 6. Uncertainty u maps in winter of surface temperature (a), salinity (b) and oxygen (c) climatology (expressed as percent deviation from the approximation). Measurement locations are displayed on the error field e maps of temperature (d), salinity (e) and oxygen (f), expressed as ◦ C, salinity unit and mL L−1 , respectively. Colour scales are indicated in each map.
3.4
Multi-decadal trends in the deep waters on a century scale
Climatologies, by their very nature, tend to smooth out any potential temporal trend (the hypothesis of stationarity, at least on the seasonal level, is implicitly assumed as granted). A climatology of a certain variable is informative if the approximated field represents a space-dependent “average” (in a broad sense). This implies that the COM statistical properties should be valid for the whole time spanned by the climatology. In the presence of trends, obviously this is no longer true. The climatologies presented here have been examined under this perspective on a centennial scale to identify whether clear temporal trends can be found. In surface waters, the high variability introduced by coastal processes (as testified Ocean Sci., 10, 771–797, 2014
by the COM analysis reported in Table 1) and the far-fromoptimal data coverage (at least for some decades) prevent any sensible trend estimate. Conversely, the above COM analysis indicates that the uncertainty tends to decrease with depth (Table 1), providing the possibility that, below the upper layer, strongly influenced by the seasonal cycle, the relatively small anomalies in specific “hot spots” (Middle Adriatic and South Adriatic pits) can be relevant for climatic studies. For the Adriatic, the T , S and DO in the deepest part of the SAdG (< 800 m) are commonly considered as both indicators and drivers of longterm deep ocean processes involving not only the Adriatic Sea but also the whole eastern Mediterranean. The data set used to estimate this climatology spans more than a century, thus enabling capture of signals of climatic variability (if any).
www.ocean-sci.net/10/771/2014/
M. Lipizer et al.: Qualified Adriatic climatology
787
Figure 7. As in Fig. 6 for summer.
Long-term variability of temperature, salinity, oxygen concentration and AOU in deep waters of the Middle and South Adriatic pits is presented in Figs. 8 and 9 as box plots showing the properties in the waters below 150 m in the central Adriatic and below 800 m in the south. The five-year nonparametric statistics are aimed at filtering out the short-term interannual variability identified for both areas (e.g. Marini et al., 2006; Cardin et al., 2011). Most of the medians lie within the range reported by Zavatarelli et al. (1998) for the deep waters in the central and the southern Adriatic, considering a smaller data set ending in the early 1990s, and our results are also coherent with interannual variability studies based on more recent data (e.g. Marini et al., 2006; Cardin et al., 2011; Vilibi´c et al., 2011). In addition, this longer time series enables, for the first time, an appraisal of the centennial-scale variability.
www.ocean-sci.net/10/771/2014/
In the shallower Middle Adriatic Pit, temporal variability between the statistics calculated over consecutive fiveyear periods is pronounced for temperature, with the lowest median in the early 1950s (10.89 ◦ C) and the highest in the early 1960s (12.80 ◦ C) (Fig. 8a). The outcomes of the Mann–Whitney U test analysis indicate that median temperature differences between consecutive five-year periods were in most cases statistically significant (10 cases out of 12). An evident rise in deep water temperature is observed in the early 1960s (+1.64 ◦ C compared with the previous period) and late 1990s (+0.89 ◦ C), and a considerable decrease is reported in the first years of the 1980s (−0.63 ◦ C) and in the late 2000s (−0.81 ◦ C). This time series analysis leads to the conclusion that the dominant mode of temperature variability has a multidecadal scale. In the case of salinity, variability between subsequent five-year periods is, in most cases, masked by overlapping IQR (Fig. 8b). The lowest median salinity (38.33) is reported in the first period (1910–1914)
Ocean Sci., 10, 771–797, 2014
788
M. Lipizer et al.: Qualified Adriatic climatology
Figure 8. Box plots show the five-year median (line), interquartile range (IQR, box) and extremes (whiskers) of temperature (a), salinity (b), dissolved oxygen (c) and AOU (Apparent Oxygen Utilization) (d) in the deep waters of the central Adriatic. Asterisks (*) indicate when statistics are based on less than 3 years of data. The year on the x axis indicates the beginning of the five-year period.
and the highest in the late 1970s (38.56). Median dissolved oxygen concentration presents data dispersion which masks variability between subsequent periods, and differences were statistically significant in a limited number of cases (5 out of 11) (Fig. 8c). As an overall trend, a decrease is recognizable starting in the early 1980s, with the lowest median in the early 1990s (4.2 mL L−1 ), which is, however, calculated from data collected in a single year (1990), and the highest median DO is reported at the beginning of the 20th century (5.4 mL L−1 ). Interannual and multidecadal variability in the deep water properties has also been observed in independent data collected in the Palagruža Sill area. This variability has been ascribed to the advection of waters of different origin, due to reversal in the Ionian Sea circulation, and weakening of the thermohaline circulation in the Adriatic (Vilibi´c et al., 2012, 2013). In the Middle Adriatic Pit, northwards of the sill, deep water variability can thus have an advective origin both from the south (alternation between ingression of MAW and MLIW) and from the north (fluctuating
Ocean Sci., 10, 771–797, 2014
contribution from NAdDW), as well as a local origin due to in situ ageing. The temporal evolution of apparent oxygen utilization (AOU) was calculated to investigate whether modifications in the oxygen content are due to advection of a different water mass, with its distinctive oxygen concentration, or to local “ageing” consequent on reduced ventilation. Positive AOU indicates the prevalence of microbial oxygen consumption over oxygen replenishment from the upper layers and increasing AOU is, thus, regarded as a proxy for deep-water ageing. In the deep central Adriatic, median AOU ranges between 0.4 mL L−1 in the early 1960s to 1.3 mL L−1 in the late 2000s, with large and overlapping IQR in some periods (Fig. 8d). Large variability within each five-year period, especially in the case of dissolved oxygen and AOU, is probably related to short-term variability in the hydrological properties of the Middle Adriatic Pit due to the periodical, though occasional, renewal consequent on dense water formation over the northern Adriatic shelf (Vilibi´c, 2003; Marini et al., 2006). In particular, the large IQR in the late 1990s
www.ocean-sci.net/10/771/2014/
M. Lipizer et al.: Qualified Adriatic climatology
789
Figure 9. As in Fig. 8, for the southern Adriatic.
reflects the very large variability in dissolved oxygen saturation reported by Marini et al. (2006). Even though differences between consecutive five-year periods are statistically significant only in 5 out of 10 cases, since the beginning of this time series, and mostly since the late 1970s, Sen’s trend analysis based on annual median data indicates that apparent oxygen utilization in the deep waters of the central Adriatic has been continuously increasing (+0.02 mL L−1 year−1 ), possibly indicating a less efficient or frequent ventilation of the deep waters, due to the weakening of the surface thermohaline cell as recently proposed by Vilibi´c et al. (2012, 2013), based on time series in the Palagruža Sill. In comparison with the shallower pits of the central basin, in the deep waters of the southern Adriatic (> 800 m), data variability within each five-year period is reduced (Fig. 9a–d) as indicated by the narrow IQR for all parameters. Variability between consecutive periods is particularly relevant in the case of temperature and salinity. In the case of temperature, differences between subsequent periods are in most cases (8 out of 10) highly statistically significant (p < 0.01). The lowest median temperature was measured at the beginning
www.ocean-sci.net/10/771/2014/
of the time series (12.65 ◦ C) and the highest in the late 1970s (13.23 ◦ C). The early 1980s were characterized, as observed in the MAdP (Fig. 8a), by a significant T decrease (−0.16 ◦ C), as previously documented by Vilibi´c and Orli´c (2001), and by a salinity and oxygen increase, associated with the lowest AOU of the time series, which suggests an energetic deep water renewal. The end of this time series was also characterized by a significant temperature rise in comparison with the late 1990s (+0.27 ◦ C) (Fig. 9a). Salinity presents an overall increase throughout the time series, with the lowest median in the 1940s (38.51) and the highest in the 2005–2009 period (38.73) (Fig. 9b). Large variability has been observed especially in the late 1960s and 1980s. Median salinity presents an evident rise in the 1970s, concomitant with the higher temperature decade (Fig. 9a, b). Fluctuations on a decadal scale can be detected, possibly connected with the “Adriatic ingression”, documented since the 19th century (Buljan, 1953). This periodic variability has been related to reversal in the circulation of the intermediate layers in the Ionian Sea (Gaˇci´c et al., 2010) and, for the 1990s, to the influence of the Eastern Mediterranean Transient (EMT, Roether
Ocean Sci., 10, 771–797, 2014
790 et al., 1996; Klein et al., 1999) in the Adriatic (Manca et al., 2006; Cardin et al., 2011). Median oxygen concentrations present pronounced temporal variability, ranging between 5.3 mL L−1 during the early 1980s and 4.5 mL L−1 in the late 1990s, with particularly pronounced variations in the 1960s and starting in the early 1980s (Fig. 9c). The late 1990s show a dramatic decrease which distinguishes this period from the whole time series. This period is also characterized by the highest AOU (1.3 mL L−1 ), suggesting significant ageing of the deep waters since the early 1980s (Fig. 9d). The dramatic oxygen decrease, and accompanying AOU increase, associated with significant salinity and limited temperature decrease observed in the late 1990 is a clear sign of reduced deep ventilation consequent on the EMT, which caused the intrusion into the Adriatic of the less saline “old” Eastern Mediterranean Deep Water (EMDW) (Manca et al., 2003). The maximum dilution, i.e. salinity decrease, observed in 1995 had a negative impact on convective processes and deep-water renewal (Cardin et al., 2011), and brought about the largest AOU of the time series. This long time series reveals the EMT as the most dramatic “suppressor” of deep water renewal on a century scale, as no other comparable events have been recorded. Considering together the timescales of temperature, salinity, dissolved oxygen and AOU and the available information on past dense water formation events, one can trace back the ventilation history of the South Adriatic Pit. The lowest AOU in the early 1980s, associated with the highest oxygen, a relative decrease in temperature and increase in salinity in comparison with the previous period (Fig. 9a–d), all point towards the deep ventilation of the South Adriatic Pit documented in 1982 (Ovchinikov et al., 1985). On the other hand, the abrupt oxygen decrease and AOU increase evident in the early 1960s, characterized by a relative temperature increase and salinity decrease, may indicate that a period of reduced deep ventilation, similar to that consequent to the EMT but much weaker, may have already occurred. Finally, the last period of this time series (2005–2009) is characterized by an increased MLIW inflow (high temperature and salinity) and by a concurrent oxygen increase of 0.65 mL L−1 since the previous period, which is similar to what occurred between 1999 and 2002 after a new deep ventilation episode (Manca et al., 2006). These properties point towards a recovery of energetic deep-water renewal conditions, which restore pre-EMT oxygen concentration. Conversely, after the effect of the EMT, temperature and salinity of the South Adriatic pit now differ profoundly from the characteristics of the Adriatic Deep Water (AdDW) previously observed, being now warmer and saltier than in the past. The time series in the Middle and South Adriatic pits seem mostly characterized by different temporal patterns of variability. Sen’s trend estimates calculated in both areas indicate differences between the two areas. The Middle Adriatic Pit (MAdP) shows a statistically significant (p < 0.05) increasing AOU (+0.2 mL L−1 decade−1 ) and decreasing trend in Ocean Sci., 10, 771–797, 2014
M. Lipizer et al.: Qualified Adriatic climatology DO (−0.1 mL L−1 decade−1 ) since the late 1970s, while no clear trends are recognizable for temperature and salinity; however, the 1910–1914 salinity data are significantly lower than all the following available five-year periods. This result points towards the large influence of biogeochemical processes consuming oxygen, which is not efficiently restored by physical processes of dense water formation. Conversely, in the southern Adriatic, a statistically robust long-term salinity (+0.018 decade−1 ) increase is evident, while no trends are evident in DO and AOU variability and, even after the dramatic decline of deep ventilation in the 1990s, physical processes, i.e. open ocean convection, are strong enough to restore deep oxygen concentrations. This can lead to the conclusion that the biotic activity is dominant in the MAdP while physical processes dominates the biogeochemical properties in SAdP. Any attempt to directly connect the observed patterns (Figs. 8 and 9) to the well-known decadal climate variability in the Mediterranean region (Mariotti and Dell’Aquila, 2012) turned out to be unsuccessful, suggesting that the complex interactions between physical forcing, internal dynamics and remote control cannot be disentangled by just simple statistical analysis. 4
Conclusions
As a final summary, we can draw the following conclusions: – A new qualified climatology for T , S and DO has been produced for the whole Adriatic basin, based on data spanning almost a century (1910–2009). This climatology is developed for 26 levels, has a spatial resolution of 1/16◦ and focuses on the deepest parts of the basin. The larger temporal and spatial data coverage allowed the clear identification of several new patterns in comparison with previous climatologies (Artegiani et al., 1997b; Zavatarelli et al., 1998; Russo et al., 2012). Furthermore, this analysis also provides estimates of the uncertainty of climatological field approximation derived from the data–approximation misfit. – The field approximations have been qualified using calibration/validation techniques (ordinary crossvalidation) and real vs. synthetic T S diagram intercomparisons to the assess the reliability of the results obtained. Misfits calculated from OCV were always less than 0.11 ◦ C for temperature and 0.06 for salinity. – The concept of data–approximation misfit associated with a climatology has been introduced here, showing its potential to provide additional information. High misfit associated with front space-time variabilities has been detected and it was found to be largest in the surface layer, in spring for temperature (median uncertainty 14.9 %) and in summer for salinity (median www.ocean-sci.net/10/771/2014/
M. Lipizer et al.: Qualified Adriatic climatology 2.1 %). Conversely, dissolved oxygen exhibits higher uncertainty in the deeper layers (median up to 18.5 % at 200 m depth). The climatology–observation misfit analysis can provide important additional information that can be extracted as a by-product of the climatological approximation procedure. – While the climatological maps confirm the overall picture of the thermohaline properties and of DO for the Adriatic, and the prominent seasonal signal connected to the Po River input, additional new features have been identified and described with better accuracy. This updated climatology has allowed a clear identification of the seasonal dynamic of the southern Adriatic where a clear DO minimum is typically observed in the centre of the SAdG due to the doming induced by cyclonic circulation. Conversely, in the northern Adriatic, the summer DO bottom minimum is presumably driven by biotic respiration processes fuelled by the seasonal loading of nutrient and organic matter discharged by the Po River. Below 100 m, all properties profoundly differ between the central and the southern Adriatic. This indicates that the exchanges between the two sub-basins in the intermediate layers appear to be much weaker and possibly limited by the strong topographically controlled recirculation in the SAdG.
791 As a general comment, despite its limited geographical dimensions, the Adriatic Sea hosts different interacting processes, sensitive to seasonal and longer-term variability. The behaviour differs between its sub-basins and even the deepest pits (located 260 km apart), supposedly prone to reacting similarly to the climatic signal, which exhibit different responses. Our reanalysis of data collected since the beginning of the 20th century confirms features reported previously by several authors and based on shorter time windows (Artegiani et al., 1997a; Vilibi´c et Orli´c, 2001; Manca et al., 2003; Cardin et al., 2011; Vilibi´c et al., 2011, 2012, 2013), but allows, for the first time, appreciation of the importance of phenomena in a century-long perspective and, furthermore, allows the identification of events not yet reported, such as the significant deep ventilation of the SAdP in the early 1980s and a weak EMT-like event probably occurring in the early 1960s. This climatology can help to define a baseline for the 21st century but, at the same time, shows that the more recent data seem to have a different behaviour, with a stronger rate of variability. An apparent speed-up in temperature increase in the SAdP is suggested by the last decade’s data and, in light of on-going global changes, deserves specific future investigation.
– The properties of the South Adriatic Pit clearly show the remote effects of EMT (lower salinity, temperature and DO) while no effect is observed in MAdP. The EMT is noted to be the most dramatic signal ever recorded over the whole data set. This long time series revealed a similar, but less energetic, concomitant variation in T , S and DO in the 1960s. This allows to speculate that a weaker EMT-like event could have previously occurred. Referring to the beginning of the time series, the deepest part of the southern Adriatic seems now to be significantly saltier (+0.18 since the period 1910–1914, with an increase of +0.018 decade−1 since 1945) and also warmer (+0.54 ◦ C since 1910–1914), even though a long-term temperature trend could not be statistically demonstrated. Conversely, the MAdP presents a long-term increase in apparent oxygen utilization (+0.77 mL L−1 since 1910–1914, with a constant increase of +0.2 mL L−1 decade−1 after the ’70s).
www.ocean-sci.net/10/771/2014/
Ocean Sci., 10, 771–797, 2014
792
M. Lipizer et al.: Qualified Adriatic climatology
Appendix A
Table A1. List of acronyms. AdDW AOU BiOS COM DIVA DO EAC EMDW EMT FEM IQR ISW MAdG MAdP MAdDW MAW MK MLIW MSFD NAdDW NAdG NODC OCV OI QC ROFI S SAdG SAdP SNR SST T VIM WAC WFD
Adriatic Deep Water apparent oxygen utilization bimodal oscillating system climatology–observation misfit Data-Interpolating Variational Analysis dissolved oxygen Eastern Adriatic Current Eastern Mediterranean Deep Water Eastern Mediterranean Transient finite element method interquartile range Ionian Surface Water Middle Adriatic Gyre Middle Adriatic Pit Middle Adriatic Deep Water Modified Atlantic Water Mann–Kendall Modified Levantine Intermediate Water Marine Strategy Framework Directive North Adriatic Dense Water North Adriatic Gyre National Oceanographic Data Centre ordinary cross-validation optimal interpolation quality control region of freshwater influence salinity South Adriatic Gyre South Adriatic Pit signal-to-noise ratio sea surface temperature temperature variational inverse method Western Adriatic Current Water Framework Directive
Ocean Sci., 10, 771–797, 2014
www.ocean-sci.net/10/771/2014/
M. Lipizer et al.: Qualified Adriatic climatology
793
Table A2. List of the projects and the institutes which have provided the data used in this study. Project
Period
Institute
AAS ADRIA
1990–1994 1971–1973
ADRICOSM/ADRICOSM-EXT
2001–2006
ASCOP
1979–1991
DINAS/DIGOT
1977–1985
EGE-MED XBT DATA EGITTO-1 EUROMARGE-AS International Biological Project
1992–1999 2005 1993–1996 1965–1965
MAST III/MTP II/MATER
1997–1999
MAT
1999–2003
MFSPP/MFSTEP
1998–2006
National oceanographic program OSO (OPEN SEA OCEANOGRAPHY) OSO, MEDPOL
2000 1989 1988–1989
OTRANTO
1993–1996
PAA PCO PFP
1995–1998 1986–1989 1978–1979
POEM/POEM-BC
1984–1998
PRISMA-1/PRISMA-2
1994–1998
PRV SARI SESAME Southern Adriatic
1986–1990 1994–1995 2006–2008 1990–1991
CNR, Istituto di Biologia del Mare, Venice OGS, Dipartimento di Oceanografia, Trieste ARPA Emilia Romagna, Struttura Oceanografica Daphne, Cesenatico CNR, Istituto di Ricerche sulla Pesca Marittima, Ancona Center for Marine Research, Rovinj ENEA, Centro Ricerche Ambiente Marino, La Spezia Institute of Oceanography and Fisheries, Split Laboratorio di Biologia Marina, Trieste National Institute of Biology, Piran OGS, Dipartimento di Oceanografia, Trieste CNR, Istituto Sperimentale Talassografico, Trieste CNR, Istituto di Biologia del Mare, Venice CNR, Istituto di Ricerche sulla Pesca Marittima, Ancona OGS, Dipartimento di Oceanografia, Trieste CNR, Istituto Sperimentale Talassografico, Trieste OGS, Dipartimento di Oceanografia, Trieste Dept. of Navigation, Hydrography and Oceanography, Istanbul OGS, Dipartimento di Oceanografia, Trieste CNR, Istituto per la Geologia Marina, Bologna CNR, Istituto di Biologia del Mare, Venice CNR, Istituto Sperimentale Talassografico, Trieste CNR, Istituto di Ricerche sulla Pesca Marittima, Ancona OGS, Dipartimento di Oceanografia, Trieste CNR, Istituto di Ricerche sulla Pesca Marittima, Ancona ENEA, Centro Ricerche Ambiente Marino, La Spezia OGS, Dipartimento di Oceanografia, Trieste Institute of Oceanography and Fisheries, Split National Centre for Marine Research, Athens National Centre for Marine Research, Athens CNR, Istituto Sperimentale Talassografico, Trieste National Centre for Marine Research, Athens OGS, Dipartimento di Oceanografia, Trieste CNR, Istituto di Biologia del Mare, Venice CNR, Istituto di Biologia del Mare, Venice CNR, Istituto di Biologia del Mare, Venice CNR, Istituto Sperimentale Talassografico, Trieste CNR, Istituto di Biologia del Mare, Venice CNR, Istituto di Ricerche sulla Pesca Marittima, Ancona Division of Applied Sciences, Harvard University, Cambridge Institut fur Umwelt Physik, Bremen Institute of Oceanography and Fisheries, Split National Centre for Marine Research, Athens OGS, Dipartimento di Oceanografia, Trieste CNR, Istituto Sperimentale Talassografico, Trieste CNR, Istituto di Ricerche sulla Pesca Marittima, Ancona OGS, Dipartimento di Oceanografia, Trieste CNR, Istituto Studio Dinamica Grandi Masse, Venice CNR, Istituto di Biologia del Mare, Venice CNR, Istituto di Biologia del Mare, Venice Stazione Zoologica, Naples OGS, Dipartimento di Oceanografia, Trieste CNR, Istituto Sperimentale Talassografico, Trieste
www.ocean-sci.net/10/771/2014/
Ocean Sci., 10, 771–797, 2014
794
M. Lipizer et al.: Qualified Adriatic climatology
Table A2. Continued. Project
UNKNOWN
VECTOR
Period
Institute
1964 1972 1966–1972 1977–1981 1983–1984 1911–1914 1974–1997 1979 1913-1999 1972 1975–1985 1977 1991 1969 1958–1978 1977 1911–1914 1966 1958 1990 1908–1993 1962 2006–2009
Akademia e Shkencave, Tirana CNR, Istituto Studio Dinamica Grandi Masse, Venice CNR, Istituto di Biologia del Mare, Venice CNR, Istituto di Ricerche sulla Pesca Marittima, Ancona CNR, Istituto Oceanografia Fisica, La Spezia Commissione Permanente per lo Studio dell’Adriatico, Venice Croatian Hydrographic Institute, Split IO RAS, Institute of Oceanology of the Russian Academy of Sciences Institute of Oceanography and Fisheries, Split Israel Oceanographic and Limnological Research, Haifa Istituto Idrografico della Marina, Genoa MSU, Moscow State University OB-SOI, Odessa Brunch of State Oceanography Institute, Ukraine OGS, Dipartimento di Oceanografia, Trieste Observatoire Oceanologique de Villefranche-Sur-Mer POI, Pacific Oceanological Institute, Vladivostok Permanente Internationale Kommission fuer die Erforschung der Adria, Vienna SHOM, Musee Oceanographique de Monaco Southern Scientific Research Institute of Marine Fisheries and Oceanography UKRNCES, Ukrainian National Center of Ecology of Seas, Ukraine UNKNOWN Woods Hole Oceanographic Institution, MA OGS, Dipartimento di Oceanografia, Trieste
Ocean Sci., 10, 771–797, 2014
www.ocean-sci.net/10/771/2014/
M. Lipizer et al.: Qualified Adriatic climatology Acknowledgements. We acknowledge all the institutes and the projects listed in Table A2 for the data used in this research. We also wish to thank B. Manca, V. Cardin, G. Civitarese and V. Kovaˇcevi´c for the more recent data. We acknowledge the GeoHydrodynamics and Environmental Research group (GHER) of the University of Liege, Belgium, for the development of the DIVA analysis software, the support of the Italian flagship project RITMARE and the EU FP6 and FP7 Projects SeaDataNet, SeaDataNet II and EMODNET (MARE/2008/03 – Lot 3 Chemistry) from the Directorate-General for Maritime Affairs and Fisheries. We are grateful to two anonymous reviewers for their valuable suggestions. Edited by: J. M. Huthnance
References Artegiani, A., Bregant, D., Paschini, E., Pinardi, N., Raicich, F., and Russo, A.: The Adriatic Sea general circulation. Part I: air-sea interactions and water mass structure, J. Phys. Oceanogr., 27, 1492–1514, 1997a. Artegiani, A., Bregant, D., Paschini, E., Pinardi, N., Raicich, F., and Russo, A.: The Adriatic Sea general circulation, Part II: Baroclinic circulation structure, J. Phys. Oceanogr., 27, 1515–1532, 1997b. Barth, A., Alvera-Azcárate, A., Troupin, C., Ouberdous, M., and Beckers, J.-M.: A web interface for griding arbitrarily distributed in situ data based on Data-Interpolating Variational Analysis (DIVA), Adv. Geosci., 28, 29–37, doi:10.5194/adgeo-28-292010, 2010. Beckers, J. M., Barth, A., Troupin, C., and Alvera-Azcárate, A.: Approximate and Efficient Methods to Assess Error Fields in Spatial Gridding with Data Interpolating Variational Analysis (DIVA), J. Atmos. Ocean. Technol., 31, 515–530, 2014. Bensi, M., Rubino, A., Cardin, V., Hainbucher, D., and ManceroMosquera, I.: Structure and variability of the abyssal water masses in the Ionian Sea in the period 2003–2010, J. Geophys. Res.-Oceans, 118, 931–943, 2013. Bignami, F., Sciarra, R., Carniel, S., and Santoleri, R.: Variability of Adriatic Sea coastal turbid waters from SeaWiFS imagery, J. Geophys. Res.-Ocean., 112, C03S10, doi:10.1029/2006JC003518, 2007. Boldrin, A., Carniel, S., Giani, M., Marini, M., Aubry, F. B., Campanelli, A., Grilli, F., and Russo, A.: Effects of bora wind on physical and biogeochemical properties of stratified waters in the northern Adriatic, J. Geophys. Res.-Ocean., 114, C08S92, doi:10.1029/2008JC004837, 2009. Borzelli, G. L. E., Gaˇciˇc, M., Cardin, V., and Civitarese, G.: Eastern Mediterranean transient and reversal of the Ionian Sea circulation, Geophys. Res. Lett., 36, L15108, doi:10.1029/2009GL039261, 2009. Brankart, J. and Brasseur, P.: Optimal analyis of in situ data in the Western Mediterranean using statistic and cross-validation, J. Atmos. Ocean. Technol., 13, 477–491, 1996. Brankart, J. and Brasseur, P.: The general circulation in the Mediterranean Sea: a climatological approach, J. Marine Syst., 18, 41– 70, 1998. Brasseur, P., Beckers, J. M., Brankart, J. M.,and Schoenauen, R.: Seasonal temperature and salinity fields in the Mediterranean Sea: Climatological analyses of a historical data set, Deep-Sea
www.ocean-sci.net/10/771/2014/
795 Res. Pt. I, 43, 159–192, doi:10.1016/0967-0637(96)00012-X, 1996. Bretherton, F., Davis, E., and Fandry, C.: A technique for objective analysis and design of applied to MODE-73, Deep-Sea Res., 23, 559–582, 1976. Buljan, M.: Fluctuations of Salinity in the Adriatic, Institut za Oceanografiju i Ribarstvo–Split (Croatia), Reports, II, 64 pp., 1953. Cardin, V. and Gaˇci´c, M.: Long-term heat flux variability and winter convection in the Adriatic Sea, J. Geophys. Res.-Ocean., 108, 8103, doi:10.1029/2002JC001645, 2003. Cardin, V., Bensi, M., and Pacciaroni, M.: Variability of water mass properties in the last two decades in the South Adriatic Sea with emphasis on the period 2006–2009, Cont. Shelf Res., 31, 951– 965, 2011. Celussi, M. and Del Negro, P.: Microbial degradation at a shallow coastal site: Long-term spectra and rates of exoenzymatic activities in the NE Adriatic Sea, Estuar. Coast. Shelf S., 115, 75–86, 2012. Civitarese, G., Gacˇci´c, M., Lipizer, M., and Eusebi Borzelli, G. L.: On the impact of the Bimodal Oscillating System (BiOS) on the biogeochemistry and biology of the Adriatic and Ionian Seas (Eastern Mediterranean), Biogeosciences, 7, 3987–3997, doi:10.5194/bg-7-3987-2010, 2010. Cosoli, S., Gaˇci´c, M., and Mazzoldi, A.: Surface current variability and wind influence in the northeastern Adriatic Sea as observed from high-frequency (HF) radar measurements, Cont. Shelf Res., 33, 1–13, 2012. Crise, A. and Manca, B.: Digital thematic maps from CTD measureemnts, A case study in the Adriatic Sea, Boll. Oc. Teor. Appl., 10, 15–40, 1992. Cushman-Roisin, B., Gaˇci´c, M., Poulain, P., and Artegiani, A.: Physical Oceanography of the Adriatic Sea: past, present and future, edited by: Gandin, L., Kluwer Academic Publisher, Springer, 2001. Gaˇci´c, M., Marullo, S., Santoler, R., and Bergamasco, A.: Analysis of the seasonal and interannual variability of the sea surface temperature field in the Adriatic Sea from AVHRR data (1984– 1992), J. Geophys. Res.-Ocean., 102, 22937–22946, 1997. Gaˇci´c, M., Eusebi Borzelli, G. L., Civitarese, G., Cardin, V., and Yari, S.: Can internal processes sustain reversals of the ocean upper circulation? The Ionian Sea example, Geophys. Res. Lett., 37, L09608, doi:10.1029/2010GL043216, 2010. Gandin, L. S.: Objective analysis of meteorological fileds, Israel Program for Scientific Translations, Jerusalem, 242 pp., 1969. Giani, M., Djakovac, T., Degobbis, D., Cozzi, S., Solidoro, C., and Umani, S. F.: Recent changes in the marine ecosystems of the northern Adriatic Sea, Estuar. Coast. Shelf S., 115, 1–13, 2012. Giorgetti, A.: Climatological analysis of the Adriatic Sea termohaline characteristic, Boll. Geofis. Teor. Appl., 40, 53–73, 1999. Giorgetti, A., Burca, M., Manca, B. B., and Tomini, I.: Compilation of a quality-controlled database of biological and chemical oceanographic parameters in the Central Mediterranean Sea, Boll. Geofis. Teor. Appl., 46, 357–376, 2005. Granato, G. E.: Kendall-Theil Robust Line (KTRLine-version 1.0) – A visual basic program for calculating and graphing robust nonparametric estimates of linear-regression coefficients between two continuous variables, Techniques and Methods of the US
Ocean Sci., 10, 771–797, 2014
796 Geological Survey, book 4, chap. A7, US Geological Survey, 31 pp., 2006. Holdsworth, N.: EMODNET Chemical: QC and QA basic guidelines, 10 pp., doi:10.6092/3CB41F4C-C401-45A7AB32-0ABD373E03BB, available at: http://www.nodc.it/doi/ documents/QC_Guidelines_EMD-Chemical_version1.2.doc (last access: 20 October 2013), 2010. Jeffries, M. A. and Lee, C. M.: A climatology of the northern Adriatic Sea’s response to bora and river forcing, J. Geophys. Res.Ocean., 112, C03S02, doi:10.1029/2006JC003664, 2007. JGCM 2008: 100 Evaluation of measurements data – Guide to the expression of uncertainty in measurements, JCGM, 134 pp., available at: http://www.bipm.org/en/publications/guides/ gum.html (last access: 20 October 2013), 2008. Justi´c, D., Nancy, N., Rabalais, R., Turner, E., and Wiseman Jr., W. J.: Seasonal coupling between riverborne nutrients, net productivity and hypoxia, Mar. Poll. Bull., 26, 184–189, 1993. Kendall, M. G.: Rank Correlation Methods, 4th Edn., Charles Griffin, London, UK, 1975. Klein, B., Roether, W., Manca, B. B., Bregant, D., Beitzel, V., Kovacevic, V., and Luchetta, A.: The large deep water transient in the Eastern Mediterranean, Deep Sea Res. Pt. I, 46, 371–414, 1999. Klein, B., Roether, W., Civitarese, G., Gaˇci´c, M., Manca, B. B., and d’Alcala, M. R.: Is the Adriatic returning to dominate the production of Eastern Mediterranean Deep Water?, Geophys. Res. Lett., 27, 3377–3380, 2000. Kovaˇcevi´c, V., Gaˇci´c, M., Fusco, G., and Cardin, V.: Temporal evolution of thermal structures and winter heat content change from VOS-XBT data in the central Mediterranean Sea, Ann. Geophys., 21, 63–73, doi:10.5194/angeo-21-63-2003, 2003. Kraus, R. and Supi´c, N.: Impact of circulation on high phytoplankton blooms and fish catch in the northern Adriatic (1990–2004), Estuar. Coast. Shelf Sci., 91, 198–210, 2011. Lipizer, M., Cossarini, G., Falconi, C., Solidoro, S., and Fonda Umani, S.: Impact of different forcing factors on N:P balance in a semi-enclosed bay: the Gulf of Trieste (North Adriatic Sea), Cont. Shelf Res., 31, 1651–1662, doi:10.1016/j.csr.2011.06.004, 2011. ˇ Malaˇciˇc, V., Celio, M., Cermelj, B., Bussani, A., and Comici, C.: Interannual evolution of seasonal thermohaline properties in the Gulf of Trieste (northern Adriatic) 1991–2003, J. Geophys. Res.Ocean., 111, C08009, doi:10.1029/2005JC003267, 2006. Manca, B. B., Kovaˇcevi´c, V., Gaˆci´c, M., and Viezzoli, D.: Dense water formation in the southern Adriatic Sea and spreading into the Ionian Sea in the period 1997–1999, J. Marine Syst., 33–34, 133–154, 2002. Manca, B. B., Budillon, G., Scarazzato, P., and Ursella, L.: Evolution of dynamics in the Eastern Mediterranean affecting water mass structures and properties in the Ionian and Adriatic Seas, J. Geophys. Res.-Ocean., 108, 8102, doi:10.1029/2002JC001664, 2003. Manca, B. B., Ibello, V., Pacciaroni, M., Scarazzato, P., and Giorgetti, A.: Ventilation of deep waters in the Adriatic and Ionian Seas following changes in thermohaline circulation of the Eastern Mediterranean, Clim. Res., 31, 239–256, 2006. Mann, H. B.: Non-parametric test against trend, Econometrica, 13, 245–259, 1945.
Ocean Sci., 10, 771–797, 2014
M. Lipizer et al.: Qualified Adriatic climatology Mann, H. B. and Whitney, D. R.: On a Test of Whether one of Two Random Variables is Stochastically Larger than the Other, Ann. Mathemat. Stat., 18, 50–60, doi:10.1214/aoms/1177730491, 1947. Marine Strategy Framework Directive 2008/56/EC: European Commission, Brussels, Belgium, 2008. Marini, M., Russo, A., Paschini, E., Grilli, F., and Campanelli, A.: Short-term physical and chemical variations in the bottom water of middle Adriatic depressions, Clim. Res., 31, 227–237, 2006. Mariotti, A. and Dell’Aquila, A.: Decadal climate variability in the Mediterranean region: roles of large-scale forcings and regional processes, Clim. Dynam., 5–6, 1129–1145, 2012. Marullo, S., Buongiorno Nardelli, B., Guarracino, M., and Santoleri, R.: Observing the Mediterranean Sea from space: 21 years of Pathfinder-AVHRR sea surface temperatures (1985 to 2005): reanalysis and validation, Ocean Sci., 3, 299–310, doi:10.5194/os3-299-2007, 2007. Mauri, E., Poulain, P. M., and Južniˇc-Zonta, Z.: MODIS chlorophyll variability in the northern Adriatic Sea and relationship with forcing parameters, J. Geophys Res.-Ocean., 112, C03S11, doi:10.1029/2006JC003545, 2007. Mauri, E., Poulain, P. M., and Notarstefano, G.: Spatial and temporal variability of the sea surface temperature in the Gulf of Trieste between January 2000 and December 2006, J. Geophys. Res.-Ocean., 113, C10012 doi:10.1029/2007JC004537, 2008. McIntosh, P. C.: Oceanographic data interpolation: objective analysis and splines, J. Geophys Res., 95, 13529–13541, 1990. Menemenlis, D., Fieguth, P., Wunsch, C., and Willsky, A.: Adaptation of a fast optimal interpolation algorithm to the mapping of oceanographic data, J. Geophys. Res.-Ocean., 102, 10573– 10584, 1997. Mihanovi´c, H., Cosoli, S., Vilibi´c, I., Ivankovi, D., Dadi´c, V., and Gaˇci´c, M.: Surface current patterns in the northern Adriatic extracted from high-frequency radar data using selforganizing map analysis, J. Geophys. Res.-Ocean., 116, C08033, doi:10.1029/2011JC007104, 2011. Nincevic, Ž., Marasovic, I., and Kušpilic, G.: Deep chlorophyll-a maximum at one station in the middle Adriatic Sea, J. Mar. Biol. Assoc. UK, 82, 9–19, 2002. Ovchinnikov, I. M., Zats, V. I., Krivosheya, V. G., and Udodov, A. I.: Formation of Deep Eastern Mediterranean water in the Adriatic Sea, Oceanology, 25, 704–707, 1985. Penna, N., Capellacci, S., and Ricci, F.: The influence of the Po River discharge on phytoplankton bloom dynamics along the coastline of Pesaro (Italy) in the Adriatic Sea, Mar. Poll. Bull., 48, 321–326, 2004. Poulain, P. M.: Adriatic Sea surface circulation as derived from drifter data between 1990 and 1999, J. Marine Syst., 29, 3–32, 2001. Poulain, P.-M. and Cushman-Roisin, B.: Chapter 3 Circulation, in: Physical Oceanography of the Adriatic Sea, Kluwer Academic Publisher, Dordrecht,the Netherlands, 67–109, 2001. Querin, S., Crise, A., Deponte, D., and Solidoro, C.: Numerical study of the role of wind forcing and freshwater buoyancy input on the circulation in a shallow embayment (Gulf of Trieste, northern Adriatic Sea), J. Geophys. Res., 112, C03S16, doi:10.1029/2006JC003611, 2007. Raicich, F.: On the fresh water balance of the Adriatic Sea, J. Marine Syst., 9, 305–319, 1996.
www.ocean-sci.net/10/771/2014/
M. Lipizer et al.: Qualified Adriatic climatology Rixen, M., Beckers, J., Brankart, J., and Brasseur, P.: A numerically efficient data analysis method with error map generation, Ocean. Model, 2, 45–60, 2000. Robinson, A. R., Malanotte-Rizzoli, P., Hecht, A., Michelato, A., Roether, W., Theocharis, A., Ünlüata, Ü., Pinardi, N., Artegiani, A., Bergamasco, A., Bishop, J., Brenner, S., Christinidis, S., M., Gacic, D., Georgopoulos, M., Golnaraghi, M., Hausmann, H.G., Junghaus, A., Lascaratos, M. A., Latif, W. G., Leslie, C. J., Lozano, T., Oguz„ E., Özsoy, E., Papageorgiou, E., Paschini, Z., Rozentroub, E., Sansone, P., Scarazzato, R., Schlitzer, G.C., Spezie, E., Tziperman, G., Zodiatis, L., Athanassiadou, M., Gerges, M., and Osman, M.: General circulation of the Eastern Mediterranean, Earth-Sci. Rev., 32, 285–309, 1992. Roether, W., Manca, B. B., Klein, B., Bregant, D., Georgopoulos, D., Beitzel, V., Kovaˇcevi´c, V., and Lucchetta, A.: Recent changes in Eastern Mediterranean deep waters, Science, 271, 333–335, doi:10.1126/science.271.5247.333, 1996. Rubino, A., and Hainbucher, D.: A large abrupt change in the abyssal water masses of the Eastern Mediterranean, Geophys. Res. Lett., 34, L23607, doi:10.1029/2007GL031737, 2007. Russo, A., Carniel, S., Sclavo, M., and Krzelj, M.: Climatology of the Northern-Central Adriatic Sea, in: Modern Climatology, edited by: Wang, S.-Y., Shangai, China, 177–212, 2012. Schlitzer, R.: Ocean Data View, available at: http://odv.awi.de (last access: 20 October 2013), 2012. SeaDataNet Climatologies: available at: http://gher-diva.phys.ulg. ac.be/web-vis/clim.html, last access: 28 October 2013. SeaDataNet, Data Quality Control Procedures, version 2.0, 78 pp., available at: http://www.seadatanet.org/Standards-Software/ Data-Quality-Control (last access: 20 October 2013), 2010. Sen, P. K.: Estimates of the regression coefficient based on Kendall’s tau, J. Am. Stat. Assoc., 39, 1379–1389, 1968. Siani, G., Magny, M., Paterne, M., Debret, M., and Fontugne, M.: Paleohydrology reconstruction and Holocene climate variability in the South Adriatic Sea, Clim. Past, 9, 499–515, doi:10.5194/cp-9-499-2013, 2013. Simunovic, A., Piccinetti, C., Paklar, G. B., Despalatovic, M., Grubelic, I., Antolic, B., and Zuljevic, A.: The occurrence of hypoxia in the Northern Adriatic at the end of 1994, Fresenius Environmental Bulletin, 12, 740–745, 2003. Socal, G., Boldrin, A., Bianchi, F., Civitarese, G., De Lazzari, A., Rabitti, S., and Turchetto, M. M.: Nutrient, particulate matter and phytoplankton variability in the photic layer of the Otranto strait, J. Marine Syst., 20, 381–398, 1999. Šoli´c, M., Krstulovi´c, N., Vilibi´c, I., Kušpili´c, G., Šestanovi´c, S., Šanti´c, D., and Ordulj, M.: The role of water mass dynamics in controlling bacterial abundance and production in the middle Adriatic Sea, Marine Environ. Res., 65, 388–404, 2008. Solidoro, C., Bastianini, M., Bandelj, V., Codermatz, R., Cossarini, G., Melaku Canu, D., Ravagnan, E., Salon, S., and Trevisani, S.: Current state, scales of variability, and trends of biogeochemical properties in the northern Adriatic Sea, J. Geophys. Res.-Oceans, 114, C07S91, doi:10.1029/2008JC004838, 2009. Stone, M.: Cross-validatory choice and assessment of statistical predictions, J. Roy. Statist. Soc., 36, 111–147, 1974.
www.ocean-sci.net/10/771/2014/
797 Supi´c, N., Grbec, B., Vilibi´c, I., and Ivancˇci´c, I.: Long-term changes in hydrographic conditions in northern Adriatic and its relationship to hydrological and atmospheric processes, Ann. Geophys., 22, 733–745, doi:10.5194/angeo-22-733-2004, 2004. Tedesco, L., Socal, G., Bianchi, F., Acri, F., Veneri, D., and Vichi, M.: NW Adriatic Sea biogeochemical variability in the last 20 years (1986–2005), Biogeosciences, 4, 673–687, doi:10.5194/bg-4-673-2007, 2007. Theocharis, A., Gacic, M., and Kontoyiannis, H.: Physical and dynamic processes in the coastal and shelf areas of the Mediterranean, in: The Sea: The global coastal ocean. Regional studies and syntheses, Vol. 11, John Wiley & Sons., New York, USA, 863–888, 1998. Totti, C., Civitarese, G., Acri, F., Barletta, D., Candelari, G., Paschini, E., and Solazzi, A.: Seasonal variability of phytoplankton populations in the middle Adriatic sub-basin, J. Plankton Res., 22, 1735–1756, 2000. Troupin, C., Machín, F., Ouberdous, M., Sirjacobs, D., Barth, A., and Beckers, J. M.: High-resolution Climatology of the North-East Atlantic using Data-Interpolating Variational Analysis (Diva), J. Geophys. Res., 115, C08005, doi:10.1029/2009JC005512, 2010. Troupin, C., Barth, A., Sirjacobs, D., Ouberdous, M., Brankart, J. M., Brasseur, P., Rixen, M., Alvera-Azcárate, A., Belounis, M., Capet, A., Lenartz, F., Toussaint, M. E., and Beckers, J. M.: Generation of analysis and consistent error fields using the Data Interpolating Variational Analysis (DIVA), Ocean Model., 52–53, 90–101, 2012. Vilibi´c, I.: An analysis of dense water production on the North Adriatic shelf, Estuar. Coast. Shelf Sci., 56, 697–707, 2003. Vilibi´c, I. and Orli´c, M.: Least-squares tracer analysis of water masses in the South Adriatic (1967–1990), Deep-Sea Res. Pt. I, 48, 2297–2330, 2001. Vilibi´c, I. and Supi´c, N.: Dense water generation on a shelf: the case of the Adriatic Sea, Ocean Dynam., 55, 403–415, 2005. Vilibi´c, I., Mihanovi´c, H., Šepi´c, J., and Matijevi´c, S.: Using SelfOrganising Maps to investigate long-term changes in deep Adriatic water patterns, Cont. Shelf Res., 31, 695–711, 2011. Vilibi´c, I., Matijevi´c, S., Šepi´c, J., and Kušpili´c, G.: Changes in the Adriatic oceanographic properties induced by the Eastern Mediterranean Transient, Biogeosciences, 9, 2085–2097, doi:10.5194/bg-9-2085-2012, 2012. Vilibi´c, I., Šepi´c, J., and Proust, N.: Weakening thermohaline circulation in the Adriatic Sea, Clim. Res., 55, 217–225, doi:10.3354/cr01128, 2013. Water Framework Directive 2000/60/EC, European Commission, Brussels, Belgium, 2000. Wolf, J. and Luksch, J.: 1881 Physicalische Untersuchungen in adriatischen und sicilisch jonischen Meere während des Sommers 1880 an Bord des Dampfers “Hertha”. Beillage zu Mitteailungen aus dem Gebiete des Seeswesens, Hf. 8, 9 – Pola, 1–79 pp., 1881. Zavatarelli, M., Raicich, F., Bregant, D., Russo, A., and Artegiani, A.: Climatological biogeochimical characteristics of the Adriatic Sea, J. Marine Syst., 18, 227–263, 1998.
Ocean Sci., 10, 771–797, 2014