1
Web Intelligence and Agent Systems: An International Journal 5 (2007) 1–5 IOS Press
Qualitative Preference-Based Service Selection for Multiple Agents Hongbing Wang a,∗ , Jie Zhang b , Cheng Wan a , Shizhi Shao a and Robin Cohen c a
Science and Engineering, Southeast University, China E-mail:
[email protected] b School of Computer Engineering, Nanyang Technological University, Singapore E-mail:
[email protected] c School of Computer Science, University of Waterloo, Canada E-mail:
[email protected]
AbstractService selection is one of the important problems in applications of multi-agent systems. A qualitative way is desirable for service selection according to agents’ preferences on non-functional Quality of Service (QoS) attributes of services. However, it is challenging when the decision has to be made for multiple agents with preferences on attributes that may be incomplete. In this paper, we first use a qualitative graphical representation tool called CP-nets to describe preference relations in a relatively compact, intuitive and structured manner. We then propose a preference reasoning algorithm to construct a derivation tree from a CP-net for each agent and then generate all service patterns for this agent. The Rank semantic is used together with the Lex semantic to provide the ordering of different service patterns. After that, we merge ranked service patterns for all agents and select a set of services that satisfy these agents the most. Finally, we also propose a semantic validation algorithm to show the satisfactory degree of the best service patterns according to other voting semantics. Experimental results indicate that this method can always obtain optimal outcomes which closely satisfy all agents, within acceptable execution time. Keywords: Multi-agent Service Selection, Qualitative Preference, CP-nets, mCP-nets, Incomplete Preference
1. Introduction Service selection has drawn more and more attention [1,2,3]. The service that satisfies an agent the most among a set of services needs to be selected based on the agent’s preferences on non-functional QoS attributes of services. In most existing solutions, an utility function is used to represent an agent’s preferences, which is a powerful quantitative approach to knowledge representation. In many cases, it is however desirable to assess preferences in a qualitative rather than quantitative way. For example, an agent may express its preference that it prefers value a over value b for one attribute of some type of services, instead of using a numeric value to represent its preferences on value a and value b respectively. Besides, a quantitative ap* Corresponding
author. E-mail:
[email protected].
proach may induce errors from agents in identifying their utilities and thus make wrong selection of services, as it is sometimes not straightforward to assign an utility value to an attribute value. Research studies on services selection based on preferences mainly focus on a single agent’s preferences. But in many real situations, a decision may have to be made for a group of agents with different preferences on QoS attributes of web services [4]. In addition, the agents’ preferences may also be incomplete [5]. Incompleteness of preferences represents an absence of knowledge about the relationship between certain pairs of outcomes. It arises naturally when we have not fully elicited agents’ preferences or when agents have privacy concerns which prevent them from revealing their complete preference orderings. It then becomes difficult to comprehensively consider all the
c 2007 – IOS Press and the authors. All rights reserved 1570-1263/07/$17.00 ⃝
2
H. Wang et al. / Qualitative Preference-Based Service Selection for Multiple Agents
agents’ preferences and select services which satisfy them the most. In this paper1 , we use CP-nets [7] to represent qualitative preference relations in a relatively compact, intuitive and structured manner under conditional ceteris paribus (all else being equal) preference statements. Based on this representation, we propose a preference reasoning algorithm to first construct a derivation tree from a CP-net for each agent and then generate all service patterns for this agent. We also rank the service patterns by the Rank semantic [8]. Finally, we merge ranked service patterns for all agents based on the Lex semantic, and select a set of services that satisfy these agents the most. In addition, a semantic validation algorithm is proposed to show the satisfactory degree of the best service patterns according to the voting semantics of Pareto, Majority and Max. The processes of service selection for multiple agents with incomplete preferences are demonstrated by a concrete example, involving three agents with different preferences. The performance of our method is also evaluated by a wide set of artificially generated QoS attributes of services and values of attributes. More specifically, we verify the effectiveness of our algorithms and compare it with the quantitative approach. We also record down the execution time of our algorithms. For these experiments, we vary the total number of available services, the number of attributes for services, the number of agents involved in service selection, as well as the number of possible attribute constraint values. Experimental results confirm that our method is able to more effectively select the most optimal services for agents than the quantitative approach in different simulation scenarios. The execution time of our method is also acceptable. The remainder of the paper is organized as follows. A motivation scenario is given in Section 2. Section 3 introduces the notions and concepts of preference logic, CP-nets, mCP-nets, and voting semantics. In Sections 4 and 5, the representing and reasoning techniques of preferences and the illustrative examples are presented. The experimental results are provided in Section 6. Section 7 summarizes and compares our method with the related work. Conclusions and future work are finally given in Section 8.
1 This
paper is the extended version of our previous work in [6].
2. An Example Scenario In a typical scenario of service selection between a group of users, each user describes her preferences. The agent acting on behalf of the user will identify the relevant services that satisfy this user the most. The agent will also communicate and negotiate with other agents to reach an agreement on services that closely satisfy all these users. A motivating real life example for our work is the field of enterprise information management [9]. In this field, the most widely used application by different departments is probably the data storage and access service. These services need to meet the needs of different departments. For example, a company’s branches need to choose a proper data storage and access service when they conduct joint marketing activities. Each branch expresses its preferences over QoS attributes of services. The branch A may prefer security over other attributes (i.e. response time and price). Branch B may be concerned more with the attribute of response time. Other branches may prefer some other quality attributes (e.g. the platform). If no branch can persuade other branches, no service can satisfy all these branches. In addition, some branches may express their preferences on only a part of the attributes. We focus on service selection for finding services that closely satisfy these branches.
3. Preliminaries We begin with a brief outline of relevant notions from decision theory, CP-nets introduced by Boutilier et al. [7], and mCP-nets and voting semantics proposed by Rossi et al. [8], which are the fundamental concepts and methods for the proposal of our algorithms of service selection for multiple agents with qualitative preferences that may be incomplete. 3.1. Preference Logic Assume that the world can be in one of a set of states S, and in each state s there are a number of actions As that can be performed. Each action in one state denotes a specific outcome. The set of all outcomes is denoted by O. A preference ranking is a total preorder over the set of outcomes: o1 ≽ o2 means that outcome o1 is equal to or more preferred than outcome o2 ; o1 ≻ o2 means that outcome o1 is strictly more preferred than
H. Wang et al. / Qualitative Preference-Based Service Selection for Multiple Agents
outcome o2 ; while o1 ∼ o2 denotes that the decision maker is indifferent between o1 and o2 . Assume a set of variables (attributes) V = {X1 , ..., Xn } with domains D(X1 ), ..., D(Xn ). An assignment x of values to a set X ⊆ V of variables (also called an instantiation of X) is a function that maps each variable in X to an element of its domain: if X = V , x is a complete assignment, otherwise x is a partial assignment [4]. We denote by Asst(X) the set of all assignments to X. If x and y are assignments to disjoint sets X and Y (X ∩ Y = ∅), respectively, we denote the combination assignment set of x and y by xy. For any outcome o, we denote by o[X] the value x ∈ D(X) assigned to variable X by that outcome. A subset of variables X is preferentially independent of its complement Y = V − X iff for all x1 , x2 ∈ Asst(X) and y1 , y2 ∈ Asst(Y ), we have: x1 y1 ⊆ x2 y1 iff x1 y2 ⊆ x2 y2 . That is, the structure of the preference relation over assignments to X does not change and can be assessed as other attributes vary. Let X, Y , and Z be a partition of V into three disjoint nonempty sets. X is conditionally preferentially independent of Y given an assignment z ∈ Asst(Z) iff for all x1 , x2 ∈ Asst(X) and y1 , y2 ∈ Asst(Y ), we have: x1 y1 z ⊆ x2 y1 z iff x1 y2 z ⊆ x2 y2 z. In other words, if X is conditionally preferentially independent of Y for all z ∈ Asst(Z), then X is conditionally preferentially independent of Y given the set of variables Z. 3.2. CP-nets CP-nets introduced by Boutilier et al. [7] is a tool for compactly representing qualitative preference relations under the ceteris paribus assumption. A CPnet over variables V = {X1 , ..., X2 } is a directed graph G over X1 , ..., X2 whose nodes are annotated with conditional preference tables CPT(Xi ) for each Xi ∈ V . Each conditional preference table CPT(Xi ) associates a total order ≻iu with each instantiation u of Xi ’s parents P a(Xi ) = U . For each variable Xi , we ask the user to identify a set of parent variables P a(Xi ) that can affect her preference over various values of Xi . Formally, given P a(Xi ) we have that Xi is conditionally preferentially independent of V − (P a(Xi ) ∪ {Xi }). Given this information, we ask the user to explicitly specify her preferences over the values of Xi for all instantiations of the variable set P a(Xi ) to generate the CP-net and CPT.
3
3.3. mCP-nets We first introduce partial CP-nets as a CP-net in which certain attributes may not be ranked. This implies that the agent is indifferent to the values of these attributes. We put together several partial CPnets to represent the incomplete preferences of multiple agents. A mCP-nets [8] is a set of m partial CPnets which may share some attributes, such that every attribute is ranked by at least one of the partial CPnets. An outcome for a mCP-nets is an assignment of the values to the attributes in all the partial CP-nets in their domains. Note that a CP-net is also a special mCP-nets where m=1. Thus, service selection based on mCP-nets inherits complexity of and is more complicated than that based on a single CP-net. 3.4. Voting Semantics We reason about a mCP-nets by querying each partial CP-net and then merging the results, which can be seen as each agent “voting" whether an outcome dominates another. There are five different voting semantics: Pareto, Majority, Max, Lex, and Rank [8], described as follows: – In Pareto, outcomes are often incomparable. An outcome is Pareto optimal iff no other outcome is better. – Majority and Max are the weaker criteria, and many agents often vote in favor or for incomparability. Two outcomes are majority OR max incomparable iff they are not ordered either way. – In the Lex semantic, agents are ordered by their importance. Two outcomes are lexicographically incomparable iff there exists some distinguished agent such that all agents higher in the ordered are indifferent between the two outcomes and the outcomes are incomparable to the distinguished agent. – In the Rank semantic, each agent ranks each outcome. Two outcomes are ranked indifferent iff the sums of the ranks assigned to them are the same. The Pareto, Lex and Rank semantics define strict orderings. By comparison, neither the Majority nor Max semantics induce a strict ordering. The five voting semantics are also embedded by Rossi et al. [8] in the context of mCP-nets, but they did not provide actual algorithm designs. We extend and implement the Rank semantic together with the Lex semantic to address multiple agents’ preferences on QoS attributes
4
H. Wang et al. / Qualitative Preference-Based Service Selection for Multiple Agents
in service selection, by considering the case where agents may have different preferences and they may be weighted differently in making decisions on services. We also validate the selected best services according to the other three voting semantics (Pareto, Majority and Max).
a1 : file system a2 : database
a1 ≻ a2
A: Platform
C: Response time
a1 : c1 ≻ c2 a2 : c1 ≻ c2
c1 : Response time RUNTIME then 14: break; 15: end if 16: end for 4.3.1. Derivation Tree Based on an agent’s preferences represented in a CP-net, an algorithm is proposed to generate a derivation tree. The agent’s preference statements of the attributes that are conditioned by a smaller number of or no other attributes will be in the upper level of
5
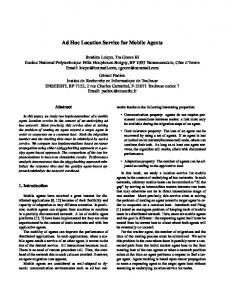
the tree. Nodes are conditioned by their parents. In the same level of the tree, the preference statements (nodes) will be listed according to their priorities from left to right. For the children of the same parent, the left children are more preferred than the right children. The pseudo-code summary for generating a derivation tree is shown in Algorithm 1, and the derivation tree for agent X’s preferences in Figure 1 is shown in Figure 3. Nodes a1 and a2 are in the upper level of the tree because attribute A is unconditional. Node a1 is a left child because it is more preferred than node a2 . 4.3.2. Service Patterns and Rank Semantic Service patterns of an agent are generated from its derivation tree. We then use the Rank semantic method to separate the service patterns into different sets in order to find the best patterns. Definition 3 Service Pattern: is a combination of attribute constraints for all attributes of QoS, i.e. a1 b1 c1 d1 e1 . Definition 4 Rank of Service Pattern: is a number expressing the degree of the service pattern to meet agents’ preferences. Definition 5 aSet: short for an analogous set is a set of items ordered according to their values. An item in an aSet can also be an aSet called Sub_aSet. Definition 6 Service Pattern aSet: is an aSet whose items are service patterns ordered based on their rank values. As shown in Figure 3, there may be many paths from the top to the bottom of the derivation tree. The left paths are more preferred than the right ones (see Algorithm 1). The combination of all paths will become an aSet T . For example, the aSet from Figure 3 is T = {T1 , T2 , ..., T10 }, and T1 = a1 c1 e1 , T2 = a1 c1 e2 and etc. If the agent’s preferences are incomplete, the attributes that are not in the CP-net (called remaining attributes) should be added to each path to become a service pattern. If the remaining attributes have their own priority order, the order will be added into patterns for integrity and accurateness. Suppose that the attributes of Security (B) and Price (D) have strict priorities, b1 ≻ b2 and d1 ≻ d2 . T1 becomes a service pattern Sub_aSet as T1 = {{a1 c1 e1 b1 d1 } ≻ {a1 c1 e1 b1 d2 , a1 c1 e1 b2 d1 } ≻ {a1 c1 e1 b2 d2 }}. The pseudo code for generating all service patterns is shown in Algorithm 2.
6
H. Wang et al. / Qualitative Preference-Based Service Selection for Multiple Agents
start
a1
a2
c1
e1
e2
ample, Rank(a1 c1 e1 b1 d1 ) = 101, Rank(a1 c1 e1 b1 d2 ) = 102, and Rank(a1 c1 e1 b2 d1 ) = 102. a1 c1 e1 b1 d2 and a1 c1 e1 b2 d1 have the same rank value because they are in the same Sub_aSet of T1 . The pseudo code for ranking service patterns is shown in Algorithm 3.
start
a1
c2
a2
c1
e3
e1
e2
c2
e3
(a)
e2, e3
e1
(b) start
a1
a2
c1
e1
e2
c2
e3
e2, e3
c1
e1
e1
e2
c2
e3
e2, e3
e1
(c)
Figure 3. Derivation Tree of CPT for Agent X
Algorithm 2 Generating Service Pattern aSet Input: Preference statements; Derivation tree T r; Output: Service pattern aSet T 1: int i = 0; aSet T = NULL; 2: for each path in tree T r from left to right do 3: i = i + 1; 4: Combine preference statements in all levels; 5: Sub_aSet T [i] = NULL; 6: Add the combination into T [i] as an item; 7: Add T [i] into aSet T ; 8: end for 9: for each remaining attribute do 10: if attribute value has strict priority then 11: Order preference statements by priority; 12: end if 13: Add them into each Sub_aSet in T ; 14: end for
Algorithm 3 Ranking Service Patterns in aSet Input: Service pattern aSet T ; setWeight; Output: Ranked service patterns in aSet 1: int i = 0; 2: for each Sub_aSet in T by priority do 3: i = i + 1; 4: j = 0; 5: for each service pattern in T [i] by priority do 6: j = j + 1; 7: Rank(pattern[j]) = i × setWeight + j; 8: end for 9: end for
4.3.3. Merging and Selection After we have an aSet for each agent and service patterns with rank values in each aSet, we now merge the aSets for all agents and compute the total rank values of each service pattern in the merged aSet. Service selection for the agents will depend on these total rank values of service patterns. Different organizational forms exist among agents. If all the agents have equal weight, the same pattern’s rank values of the agents will simply be added. The pattern with the highest total rank is the best pattern for all the agents. However, agents may be weighted differently in making decision on services. In this case, the total rank of service pattern j (j is the id of the pattern) can be computed as follows: M ∑ Rank_total(j) = [Rankij × W eight(i)] (1) i=1
Because T1 contains the best service patterns, we define the initial rank of items in T1 as a number setWeight. The value of setWeight is larger than the product of the size of aSet T and the maximum size of the Sub_aSets of T . In the example in Section 5, we set setWeight to be 100. The initial rank of the items in T1 is then 100. The rank of each pattern in T1 will be added by its order number. For ex-
where i is the id of an agent, M is the total number of agents, and Rankij is agent i’s rank for service pattern j. The total weight of all agents is normalized to 1. If some patterns have the same total rank, each of these patterns will be ordered by its weighted distance to the mean of all rank values for this pattern. Note that the mean value can be calculated by Equation 1 because
H. Wang et al. / Qualitative Preference-Based Service Selection for Multiple Agents
the total weight is 1. The weighted distance can then be computed as follows:
Dis(j) =
M ∑ [W eight(i)×|Rankij −Rank_total(j)|2 ] i=1
(2) The pseudo code for merging service patterns and computing their total rank values is shown in Algorithm 4. Algorithm 4 Merging Service Patterns Input: Total number of agents M ; ranked service pattern aSet for each agent; weight of each agent (optional); Output: Service patterns ordered by total rank; 1: if no weight of agents provided then 1 2: Weight of each agent = M ; 3: end if 4: Initialize Rank_total of each pattern = 0; 5: Compute Rank_total using Equation 1; 6: Order service patterns according to Rank_total 7: for each set of patterns with same Rank_total do 8: Compute weighted distance using Equation 2; 9: Order them according to weighted distance; 10: end for Based on the total rank values of all service patterns, service selection is done by matching available services with service patterns. The services that match the patterns with the smallest rank values will be returned to all agents. The pseudo code for service selection is shown in Algorithm 5. 4.3.4. Semantic Validation of Best Service Patterns As mentioned in Section 3.4, there are mainly five voting semantics in service selection. In the above algorithms, the Rank semantic is used together with the Lex semantic to produce the order of different service patterns. But, in real world applications, other semantics may also be concerned when selecting services based on preferences of each member agent in a decision group. We thus propose to make use of the other three voting semantics (i.e. Pareto, Majority and Max) as additional validation for the best service patterns that are ranked according to the Rank and Lex semantics. We provide for each of the best service patterns
7
Algorithm 5 Service Selection Input: Service patterns ordered by total rank; A set of available services; Output: Service patterns ordered by total rank; 1: for each available service do 2: Find matching pattern based on attribute values; 3: end for 4: boolean flag = true; 5: while flag do 6: for each ordered service pattern do 7: Find services that match the pattern; 8: if found matched services then 9: flag = false; 10: end if 11: end for 12: end while 13: return the found services; a satisfactory degree calculated using Pareto, Majority and Max respectively. Pareto-Satisfactory Degree (P SD) of a service pattern is a percentage value to describe the satisfactory degree of the service pattern according to the Pareto voting semantic. Let one of the best service patterns (i.e. patterns with the smallest rank values according to Algorithm 4) be Pj and |Pj | be the number of attribute constraints (see Definition 1) in this pattern. If one of the attribute constraints in the pattern is preferred by all agents according to the agents’ preference statements, the attribute constraint is called a Pareto-satisfactory attribute constraint. Let |Pj pP areto | be the number of Pareto-satisfactory attribute constrains in the pattern Pj . We have the Pareto-Satisfactory Degree of Pj as follows: P SD(Pj ) =
|Pj pP areto | ∗ 100% |Pj |
(3)
If the number of agents preferring an attribute constraint in Pj is larger than the number of the rest of the agents, the attribute constraint is called the Majoritysatisfactory attribute constraint. Let |Pj pM ajority | be the number of Majority-satisfactory attribute constraints in the pattern Pj . Accordingly, the MajoritySatisfactory degree (M ajSD) can be defined as follows: M ajSD(Pj ) =
|Pj pM ajority | ∗ 100% |Pj |
(4)
8
H. Wang et al. / Qualitative Preference-Based Service Selection for Multiple Agents
If the number of agents preferring an attribute constraint in Pj for an attribute is larger than the maximum number of agents that prefer any of the other attribute constraints for the same attribute, and also larger than the number of agents that disclaim the attribute, the attribute constraint is called the Maxsatisfactory attribute constraint. Let |Pj pM ax | be the number of Max-satisfactory attribute constraints in the pattern Pj . Accordingly, the Max-Satisfactory degree (M axSD) can be defined as follows: M axSD(P atj ) =
|Pj pM ax | ∗ 100% |Pj |
(5)
According to the definition of the above three voting semantics, we can derive two important characteristics of the relationships between the three voting semantics. First, if an attribute constraint is called the Paretosatisfactory attribute constraint, it will satisfy all the agents’ requirements. So the number of agents that do not prefer the attribute constraint is zero. Obviously, if an attribute constraint satisfies the Pareto voting semantic, it will also satisfy the Majority voting semantic and the Max voting semantic. Second, the number of agents preferring a Majority-satisfactory attribute constraint is larger than the total number of agents that do not prefer any of the outcome, which is larger than the maximum number of agents that prefer any of the other outcomes. So, if a preference outcome satisfies the Majority voting semantic, it will also satisfy the Max voting semantic. Based on the above relationship characteristics of voting semantics, we can simplify the calculation of |Pj pM ax | and |Pj pM ajority |. The pseudo code for semantic validation is summarized in Algorithm 6. Note that, in the algorithm, to check whether an agent prefers an attribute constraint in a service pattern, we can traverse the agent’s derivation tree to see whether the attribute constraint appears on the left branch of the attribute. If the attribute constraint appears on the left branch, it means that the agent prefers the attribute constraint. If the attribute constraint appears on the right branch, it means that the agent prefers other attribute constraints for the preference. If the attribute does not appear in the derivation tree, it means that the agent disclaims the attribute and the attribute constraint. 4.3.5. Algorithm Complexity Analysis Assume that the number of attributes included in a CP-net is attN um and the maximum number of attribute constraints in one preference statement is
Algorithm 6 Semantic Validation Input: Top N service patterns ordered by total rank; Derivation tree of each agent; Output: Semantic satisfactory degrees of the service patterns; 1: int nPrefer, nPreferOther, nDisclaim; 2: //number of agents preferring the attribute constraint, other constraints and disclaiming attribute, respectively 3: for each service pattern Pj do 4: for each attribute constraint in Pj do 5: nPrefer = nPreferOther = nDisclaim=0; 6: for each agent with a derivation tree do 7: if it prefers the attribute constraint then 8: nPrefer ++; 9: else 10: if it prefers other constraints then 11: nPreferOther ++; 12: else 13: if it disclaims the attribute then 14: nDisclaim ++; 15: end if 16: end if 17: end if 18: end for 19: if nPreferOther=nDisclaim=0 then 20: |Pj pP areto | ++; |Pj pM ajority | ++; 21: |Pj pM ax | ++; 22: else 23: if nPrefer>nPreferOther+nDisclaim then 24: |Pj pM ajority | ++; 25: |Pj pM ax | ++; 26: else 27: if (nPrefer>nPreferOther) AND (nPrefer>nDisclaim) then 28: |Pj pM ax | ++; 29: end if 30: end if 31: end if 32: end for 33: Compute P SD(Pj ), M ajSD(Pj ), M axSD(Pj ); 34: end for 35: return semantic satisfactory degree of each pattern;
H. Wang et al. / Qualitative Preference-Based Service Selection for Multiple Agents
maxP S. The computational complexity of line 1 in Algorithm 1 is lower than O(maxP S). The computational complexity of the first and second For loops is lower than O(attN um×maxP S). Because the duplicate operator costs only O(1) time, the computational complexity of the second For loop will decrease dramatically depending on the ratio of duplicates. Furthermore, this algorithm gives the agent the right to set the runtime limit. If the runtime limit is reached, the algorithm will stop and return the left part of the derivation tree which represents the comparatively more preferred combination of attributes. Some methods of cutting derivation trees may also be considered in our future work. Suppose that the number of all service quality attributes is aN um_all and the maximum number of attribute constraints of one attribute is maxAC. The worst case complexity of Algorithms 2 and 3 is O(aN um_allmaxAC ). But, if the attribute constraints of agents remain stable over time, this step can be processed in advance to improve the efficiency. If the size of aSet T is sizeT and we adopt the bin sort method to order service patterns, the complexity of Algorithm 4 is O(M × sizeT × log(sizeT )), where M is the total number of agents. The complexity of Algorithm 5 is dependent on sizeT and the number of available services for selection. Because Algorithm 6 is used to validate the semantic satisfaction of selected service patterns, only top N service patterns are considered in the algorithm. The complexity of Algorithm 6 is determined by the number of attributes in one pattern and the number of agents. Furthermore, although we use three semantics to validate the patterns, we only need to execute one round of loop because of the relationships between the three semantics discussed earlier. So the complexity of Algorithm 6 is O(M × attN um). Our experimental results in Section 6 indicate that the runtime of our algorithms is tolerable for a large number of available services.
5. Example Demonstration In this section, we follow up with the example scenario described in Section 2 and the preferences of agent X in Section 4.1, and add preferences of other two agents, Y and Z. We demonstrate the processing results of our service pattern generation, ranking, merging, as well as semantic validation algorithms. The preferences of agents Y and Z are represented by CP-nets, as shown in Figures 4 and 5. Agent Y
9
proposes its incomplete preference sequence: Security ≽ Price ≽ Location, and agent Z’s preference sequence is more complicated: Platform ≽ Security ∼ Response_time ≽ Location. Their preference statements are expressed in Figure 4 (b) and Figure 5 (b). As described in Section 4.3, we first generate derivation trees for these two CP-nets respectively, using Algorithm 1. From each derivation tree, we use Algorithm 2 to generate a service pattern aSet for each agent, and rank these service patterns using Algorithm 3. The 5 best Sub_aSets for each agent from T1 to T5 are listed in Tables 1, 2 and 3. b1 ≻ b2
B: Security
D: Price
b1 : low b2 : high d1 : Price < $50
b1 : d1 ≻ d2 b2 : d1 ≻ d2
d2 : Price ≥ $50
d1 : e 1 ≻ e 2 ≻ e 3
e2 : Location = Toronto
d2 : e 2 ≻ e 3 ≻ e 1
e3 : Location = London
e1 : Location = New York
E: Location
(b)
(a)
(c)
Figure 4. (a,b) CP-net for Agent Y, (b) CPT, (c) Preference Statements
A: Platform
a1 ≻ a2 a1 : b1 ≻ b2 , c1 ≻ c2 a2 : b1 ≻ b2 , c1 ≻ c2
B: Security
C: Response time
b1 c1 : e1 ≻ e2 ≻ e3 b1 c2 : (e2 , e3 ) ≻ e1 b2 c1 : e1 ≻ e3 ≻ e2
E: Location
b2 c2 : e2 ≻ e3 ≻ e1
(a)
(b)
Figure 5. (a,b) CP-net for Agent Z, (b) CPT
From Tables 1, 2 and 3, we can see that a1 b1 c1 d1 e1 is in the best Sub_aSet of every agent. We can conclude that this service pattern should be the best one for all the agents. Our Algorithm 4 merges service patterns in the aSet of each agent and assigns a total rank value for each service pattern. The 10 best service patterns are listed in Table 4 along with their rank values and their distance from the respective mean rank values averaged over all agents (see Equations 1 and 2). Note that the three agents have equal weight in this case. From Table 4, we can see that service pattern a1 b1 c1 d1 e1 is indeed ranked the best by our algo-
10
H. Wang et al. / Qualitative Preference-Based Service Selection for Multiple Agents Table 1 Ranked Service Pattern aSet for Agent X
{a1 c1 e1 b1 d1 }:101 ≻ {a1 c1 e1 b1 d2 , a1 c1 e1 b2 d1 }:102 ≻ {a1 c1 e1 b2 d2 }:103 {a1 c1 e2 b1 d1 }:201 ≻ {a1 c1 e2 b1 d2 , a1 c1 e2 b2 d1 }:202 ≻ {a1 c1 e2 b2 d2 }:203 {a1 c1 e3 b1 d1 }:301 ≻ {a1 c1 e3 b1 d2 , a1 c1 e3 b2 d1 }:302 ≻
We also show the results of ranking when agents’ decisions are weighted differently. In this example, X’s weight is 0.6, Y’s weight is 0.2, and Z’s weight is also 0.2. We list the 10 best service patterns in Table 5. Because no two patterns have the same total rank values, the distance of service patterns from their respective means is not shown in the table.
{a1 c1 e3 b2 d2 }:303 {a1 c2 e2 b1 d1 , a1 c2 e3 b1 d1 }:401≻{a1 c2 e2 b1 d2 , a1 c2 e3 b1 d2 , a1 c2 e2 b2 d1 , a1 c2 e3 b2 d1 }:402≻{a1 c2 e2 b2 d2 , a1 c2 e3 b2 d2 }:403 {a2 c2 e1 b1 d1 }:501 ≻ {a2 c1 e1 b1 d2 , a2 c1 e1 b2 d1 }:502 ≻ {a2 c1 e1 b2 d2 }:503
Table 2 Ranked Service Pattern aSet for Agent Y {b1 d1 e1 c1 a1 , b1 d1 e1 c1 a2 }:101≻{b1 d1 e1 c2 a1 , b1 d1 e1 c2 a1 }:102 {b1 d1 e2 c1 a1 , b1 d1 e2 c1 a2 }:201≻{b1 d1 e2 c2 a1 , b1 d1 e2 c2 a1 }:202 {b1 d1 e3 c1 a1 , b1 d1 e3 c1 a2 }:301≻{b1 d1 e3 c2 a1 , b1 d1 e3 c2 a1 }:302 {b1 d2 e2 c1 a1 , b1 d2 e2 c1 a2 }:401≻{b1 d2 e2 c2 a1 , b1 d2 e2 c2 a1 }:402 {b1 d2 e3 c1 a1 , b1 d2 e3 c1 a2 }:501≻{b1 d2 e3 c2 a1 , b1 d2 e3 c2 a1 }:502
Table 3 Ranked Service Pattern aSet for Agent Z {a1 b1 c1 e1 d1 , a1 b1 c1 e2 d1 }:101≻{a1 b1 c1 e1 d2 , a1 b1 c1 e2 d2 }:102 {a1 b1 c1 e3 d1 }:201≻{a1 b1 c1 e3 d2 }:202 {a1 b1 c2 e2 d1 , a1 b1 c2 e3 d1 }:301≻{a1 b1 c2 e2 d2 , a1 b1 c2 e3 d2 }:302 {a1 b1 c2 e1 d1 }:401≻{a1 b1 c2 e1 d2 }:402 {a1 b2 c1 e1 d1 }:501≻{a1 b2 c1 e1 d2 }:502
Table 4 Merged and Ranked Service Patterns #
Pattern
Rank_total
1
a1 b1 c1 d1 e1
101
Distance from Mean 0
2
a1 b1 c1 d1 e2
168
57.74
3
a1 b1 c1 d2 e1
202
172.63
4
a1 b1 c1 d1 e3
268
207.61
5
a1 b1 c2 d1 e2
301
99.50
6
a1 b1 c2 d1 e3
335
57.45
7
a1 b1 c2 d1 e1
335
207.60
8
a1 b1 c1 d2 e3
368
207.60
9
a1 b1 c2 d2 e2
402
100.00
10
a1 b2 c1 d1 e1
435
304.96
rithms. The service patters a1 b1 c2 d1 e3 and a1 b1 c2 d1 e1 have the same rank 335. They are then ranked by their distance to their respective mean rank values. In this case, a1 b1 c2 d1 e3 is closer to its mean and ranked higher than a1 b1 c2 d1 e1 .
Table 5 Agents with Different Weights #
Pattern
1
a1 b1 c1 d1 e1
Rank_total 101
2
a1 b1 c1 d2 e1
131.9
3
a1 b1 c1 d1 e2
191
4
a1 b2 c1 d1 e1
201.8
5
a1 b1 c1 d2 e2
221.9
6
a1 b2 c1 d2 e1
232.7
7
a1 b1 c1 d1 e3
291
8
a1 b2 c1 d1 e2
301.8
9
a1 b1 c1 d2 e3
321.9
10
a1 b2 c1 d2 e2
332.7
Comparing Tables 4 and 5, we can see that a1 b1 c1 d1 e1 still has the best rank. This service pattern is a dominant one and is not affected by the importance of agents’ preferences. However, many other service patterns’ positions are changed. For example, a1 b1 c1 d2 e1 was less preferred than a1 b1 c1 d1 e2 in Table 4, but it now becomes more preferred in Table 5 when agents have different weights. The service pattern a1 b1 c1 d2 e2 is ranked the fifth in Table 5 but was not even in the top 10 list of Table 4. Different weights of agents’ decisions do affect the final ranking of service patterns. Our algorithms are able to capture this effect. Furthermore, we make use of the semantic validation algorithm to validate the ranking results under different voting semantics. According to the preferences of the three agents X, Y and Z, the semantic voting results are shown in Table 6. Here, we use “1" to indicate that an agent prefers the attribute constraint, “-1" to indicate that the agent prefers other attribute constraints, and “0" to indicate that the agent disclaims the attribute. Based on the agents’ voting results, the satisfied voting semantics are also presented for each attribute constraint in a service pattern in the table. Note that as discussed in Section 4.3.4, if an attribute satisfies Pareto, it also satisfies both Majority and Max. If it satisfies Majority, it also satisfies Max. The semantic “Null" means that the attribute constraint does not satisfy any voting semantic.
H. Wang et al. / Qualitative Preference-Based Service Selection for Multiple Agents Table 6 Semantic Validation of Top 3 Service Patterns Pattern
Constraint
X
Y
Z
Semantic
a1 b1 c1 d1 e1
a1 b1
1 0
0 1
1 1
Majority Majority
c1 d1
1 0
0 1
1 0
Majority Null
a1 b1 c1 d1 e2
a1 b1 c1 d2 e1
e1
1
1
1
Pareto
a1
1
0
1
Majority
b1 c1
0 1
1 0
1 1
Majority Majority
d1 e2
0 -1
1 -1
0 0
Null Null
a1 b1
1 0
0 1
1 1
Majority Majority
c1 d2
1 0
0 -1
1 0
Majority Null
e1
1
-1
1
Majority
Table 7 Semantic Validation Results
11
a quantitative approach. We then evaluate our method based on a large number of random QoS attribute values. After that, the execution time of our method is tested for different numbers of generated candidate services, QoS attributes, agents and possible values for each attribute, respectively. Finally, we use the three voting semantics of Pareto, Majority and Max to verify the performance of the top 5 Sub_aSets generated by our method. 6.1. Effectiveness Comparison with a Quantitative Approach We begin with a set of experiments to verify the effectiveness of our approach and compare with a quantitative approach. In these experiments, the good outcome of an approach means that the approach correctly ranks candidate services and remains their relative positions according to agents’ preferences, no matter what other services are. The effectiveness of the approach is then evaluated as the ratio of the number of good outcomes over all tests.
#
Pattern
PSD
MajSD
MaxSD
1
a1 b1 c1 d1 e1
20%
80%
80%
2
a1 b1 c1 d1 e2
0%
60%
60%
3
a1 b1 c1 d2 e1
0%
80%
80%
C
D
4
a1 b1 c1 d1 e3
0%
60%
60%
S1
1
0
98
98
98
98
5
a1 b1 c2 d1 e2
0%
60%
60%
S2
12
10
86
85
86
86
6
a1 b1 c2 d1 e3
0%
60%
60%
S3
34
31
66
65
66
66
7
a1 b1 c2 d1 e1
0%
40%
40%
S4
65
62
36
35
36
36
8
a1 b1 c1 d2 e3
0%
60%
60%
S5
96
95
6
8
8
8
9
a1 b1 c2 d2 e2
20%
60%
60%
10
a1 b2 c1 d1 e1
20%
60%
60%
Table 8 Five Manually Generated Services Service
Integrity Throughout Availability
B
Table 9
The semantic validation results for the top 10 service patterns are shown in Table 7. Generally, the patterns with higher ranking scores have better semantic validation results. In Table 7, we can see that the first pattern is still the best according to the semantic validation. But the third pattern is better than the second pattern according to the voting semantics of Pareto and Majority. In this case, it is up to the agents to decide which voting semantics they concern more in order to choose the most suitable service patterns.
6. Experimental Results In this section, we show experimental results from four aspects. We first carry out experiments to verify the effectiveness of our method and compare it with
Ranking of the Five Manually Generated Services Service
Test 1
Test 2
Test 3
Test 4
Test 5
S1
1
1
1
1
1
S2
2
3
3
3
3
S3
8
9
8
10
8
S4
19
22
20
21
21
S5
23
30
29
30
30
The first experiment involves six service attributes (B, C and D mentioned in Section 4.1, and Integrity, Throughout and Availability) where agents have the consistent preferences over the values of these attributes. For example, every agent prefers a lower price (D) and higher security (B). This setting allows us to objectively identify a set of services, some of which are strictly more preferred than the others by all agents. The domain of these attributes is normalized to be
12
H. Wang et al. / Qualitative Preference-Based Service Selection for Multiple Agents
[0, 100]. 5 services are manually generated so that S1 ≻ S2 ≻ S3 ≻ S4 ≻ S5 by all agents as shown in Table 8. Another 25 services are randomly generated. 4 agents with randomly generated preferences are also involved in the experiment. We run the experiment for 5 times and report the ranking of the five services in Table 9. Although the rank of each service is different in each test in the experiment, our approach remains the relative positions of candidate services according to agents’ preferences. It gives five good outcomes in all five tests. So the effectiveness of our approach in this experiment is 1. In the second experiment, we evaluate the effectiveness of our approach in a more general case. In this experiment and all the later experiments in this section, six QoS attributes are involved, including the five ones mentioned in Section 4.1 and the extra one, Availability (F: 0 - 100%). Agents may not have consistent preferences for these attributes. Each attribute has 2 values. We generate 500 candidate services. 4 agents are involved in this experiment with randomly generated preferences, some of which are incomplete. This experiment includes two cases. In the first case (Case 1), each agent has the equal weight, while in the second case (Case 2), we assign each agent with a different weight. For each case, our approach generates the best 5 service pattern Sub_aSets. We measure the satisfaction ratio of services in each pattern, and check whether our approach generates ranked service patterns that correctly match their satisfaction ratio. The satisfaction ratio of one service S can be calculated by ∑4 Pi′ i=1 Pi W eight(i), where Pi is the total number of preference statements for agent i and Pi′ is the number of satisfied preference statements by service S for this agent. The average satisfaction ratios of the services in the best 5 service pattern Sub_aSets after running the experiment for 5 times are listed in Table 10. We can see that the ranking of the 5 best Sub_aSets generated by our approach correctly matches their average satisfaction ratios, which confirms that our approach accurately ranks services. Table 10 Average Satisfaction Ratio of the Best 5 Sub_aSets Cases
T1
T2
T3
T4
T5
Case 1
0.95
0.88
0.83
0.72
0.65
Case 2
0.97
0.88
0.82
0.74
0.66
The third experiment is carried out to demonstrate that a classic quantitative approach (i.e. of [10]) may have problems when agents cannot accurately identify
Table 11 Incorrect scores of Another Quantitative Approach Service
Correct Score
Incorrect Score
Incorrect Rank
S13
352
376
3
S4
368
368
4
S16
400
352
7
S5
320
296
13
S19
368
280
16
their quantitative preferences. In this experiment, each agent assigns a score in [1, 10] to each attribute value of a service. However, an agent may incorrectly represent its preference by ±1, i.e. a score of 9 may be assigned to a attribute value with the correct score of 10. 30 services are randomly generated for the experiment involving 8 agents. Applying the quantitative approach to both correct and incorrect scores of attribute values respectively, we can see from some examples in Table 11 that the quantitative approach incorrectly assigns scores to some services, and thus generates wrong ranks for them because of the incorrect scores of service attribute values assigned by agents. 6.2. Further Test Based on Random QoS Attribute Values In the second set of experiments, we further test our algorithms based on a wide set of randomly generated QoS attribute values of a large number of candidate services. In some of these experiments, attributes may have a larger number of possible values, which are artificially generated. 1000, 5000, and 8000 candidate services are randomly generated respectively. We also compare the results of service selection for different cases where each attribute has 2, 4, and 8 values respectively. We can see from Figures 6(a), 6(b) and 6(c) that the best Sub_aSet T1 in each case (i.e. where 1000 services are generated and each attribute has 4 values) has at least one service. These services satisfy the agents the most. As can be seen from these figures, the number of services in each Sub_aSet decreases when attributes have more possible values. This is simply because more possible values for attributes will increase the number of attribute constraints. It becomes more difficult for candidate services to match service patterns in aSets. Comparing the three figures, we can see that the number of services in each Sub_aSet increases when a larger number of candidate services are generated.
H. Wang et al. / Qualitative Preference-Based Service Selection for Multiple Agents
213
209
150 119
119 100 50 711
0
31 15
61
T1
T2
967
800 600
497
3
T4
497
400 194
200
11
T3
2000
1000
46
40
1316
2 Values 4 Values 8 Values
1200
393 2
0
T5
142 T2
T1
39 6
176 49
T3
T4
45
2237
2 Values 4 Values 8 Values
2099
1500 1000
889
799
500 102 25
298 87
T3
T4
278
136 0
T5
525 2
375 T2
T1
Service Pattern Sub_aSets
Service Pattern Sub_aSets
(a)
(b)
(c)
35 30 25 20 15 10
208 5 T5
Service Pattern Sub_aSets
2 Values 4 Values 8 Values
40 Execution Time (ms)
1400 2 Values 4 Values 8 Values
Selected Services
Selected Services
200
Selected Services
250
13
0 1000
5000 8000 Number of Available Services
(d)
Figure 6. (a) Service Selection from 1000 Services; (b) Service Selection from 5000 Services; (c) Service Selection from 8000 Services; (d) Runtime for Different Numbers of Candidate Services;
30
Execution Time (ms)
Execution Time (ms)
700
25 20 15 10 5
800 2 Values 4 Values 8 Values
700
600 500 400 300 200 100
0 9 12 Number of Attributes
15
500 400 300 200
702
100
0 6
600
1500 2 Agents 4 Agents 8 Agents 16 Agents
Execution Time (ms)
800 2 Values 4 Values 8 Values
35
Execution Time (ms)
40
0 2
4
8 Number of Agents
(a)
16
2
4 6 Number of Possible Values
(b)
8
0
5
10 15 20 Execution Number
(c)
25
30
(d)
Figure 7. (a) Runtime for Different Numbers of Attributes; (b) Runtime for Different Numbers of Agents; (c) Runtime for Different Numbers of Possible Values; (d) Average Execution Time
140 120
83.3% 83.3%
80
70.1% 62%
57.6% 46.1% 46.7% 35%
60 40
33.3% 25%
T1
T2
80
120
83.3% 71.5%
66.7%
T3
59.5%
56.3%
60 40
140
33.3% 20%
T2
80
120
74%
66.7%
0
T5
48.1%
44.6%
38%
33.8%
33.3%
80
T2
T3
75% 66.7%
62% 53.5%
60 16.7%
16.9% 10%
0%
0% 0
T5
39.3%
33.3%
40
T4
48.5%
43.2%
20
0%
0% T1
Pareto Majority Max 100%
100
17.2%
16.7%
0%
T4
60.3%
55.1%
60
20
T3
140
100
40
8.3% T1
Pareto Majority Max 100%
18.5% 0%
0
T5
37.4%
34.6%
0% T4
47.5%
45.1%
20 0%
0
100
20.7%
16.7%
20
36%
Pareto Majority Max
Rank Value(%)
100
Pareto Majority Max
Rank Value(%)
Rank Value(%)
120
Rank Value(%)
140
T1
T2
0% T3
0% T4
Service Pattern Sub_aSets
Service Pattern Sub_aSets
Service Pattern Sub_aSets
Service Pattern Sub_aSets
(a)
(b)
(c)
(d)
T5
Figure 8. The value of PSD, MajSD, MaxSD under different numbers of agents.(a) 4 Agents; (b) 8 Agents; (c) 16 Agents; (d) 32 Agents
140 120
100 80
75%
66.7%
62%
53.5%
60
43.2%
40 20 0
16.7%
T1
48.5% 39.3%
33.3%
T2
0%
80
120
77.7% 66.7%
0
38.9%
35.6%
40
T5
50%
44.4%
11.1%
0% T1
T2
Pareto Majority Max 100%
140 120
100 78% 80
66.7%
62.5%
55.6%
60
49.5%
45.1%
0% T3
0% T4
T5
40.1%
36.3%
40
Pareto Majority Max 100%
100 80
80%
73.3%
63.3%
60% 60
45.7%
40
52.1%
20 0
8.3% T1
8.3% T2
20
0%
0% T3
0% T4
T5
0
42.5%
38%
23.3%
22.8%
19.6%
11.1%
0% T4
61.1%
55.6%
60
20
0% T3
140
100
16.9% 10%
Pareto Majority Max 100%
Rank Value(%)
Pareto Majority Max 100%
Rank Value(%)
Rank Value(%)
120
Rank Value(%)
140
6.7% T1
6.7% T2
0%
0% T3
T4
Service Pattern Sub_aSets
Service Pattern Sub_aSets
Service Pattern Sub_aSets
Service Pattern Sub_aSets
(a)
(b)
(c)
(d)
0% T5
Figure 9. The value of P SD, M ajSD, M axSD under different numbers of attribute:(a) 6 attributes; (b) 9 attributes; (c) 12 attributes; (d) 15 attributes
H. Wang et al. / Qualitative Preference-Based Service Selection for Multiple Agents
Pareto Majority Max 100%
140 120
100
83.5%
80% 80
67.5%
66.7%
49.5%
60
55.3% 42.1%
40 20 0
45.6%
26.7% 6.7% T1
6.7% T2
0%
0% T3
T4
0% T5
Pareto Majority Max 100%
140 120
100 80
80%
73.3%
63.3%
60% 60
45.7%
52.1% 38%
40 20 0
42.5%
23.3% 6.7% T1
6.7% T2
0%
80
T5
120
76.7%
70.1%
59.5%
55.6%
60
42.6%
40
48.8% 39.2%
34.8%
Pareto Majority Max 100%
100 80
72.4%
66.7%
55.6%
52.1%
60
39.5% 40
19.2%
0% T4
140
100
20
0% T3
Pareto Majority Max 100%
Rank Value(%)
Rank Value(%)
120
Rank Value(%)
140
Rank Value(%)
14
0
6.7% T1
6.7% T2
20
0%
0% T3
T4
0% T5
0
6.7% T1
6.7%
0%
T2
43.2% 35.6% 31.2% 16.8% 0%
T3
T4
Service Pattern Sub_aSets
Service Pattern Sub_aSets
Service Pattern Sub_aSets
Service Pattern Sub_aSets
(a)
(b)
(c)
(d)
0% T5
Figure 10. The value of P SD, M ajSD, M axSD under different numbers of value:(a) 2 values; (b) 4 values; (c) 6 values; (d)8 values
6.3. Experiments on Execution Time In the third set of experiments, we analyze the execution time of our algorithms for different numbers of generated candidate services, QoS attributes, agents and possible values for each attribute, respectively. In the first three cases, each variable has 2, 4, and 8 values respectively. Our analysis has been performed on a 2.13GHz Intel Core2 Workstation with 2GB of RAM. We first look at how the execution time will change when different numbers of candidate services are generated. There are two agents in this experiment. From Figure 6(d), we can see that the execution time of our algorithms will increase exponentially when a larger number of candidate services are generated. We then fix the number of candidate services to 1000. We vary the number of attributes from 6 to 15. The results are shown in Figure 7(a). The execution time of our algorithms also increases exponentially with the increase of the number of attributes. These results comply with our analysis of algorithm complexity in Section 4.3.5. However, we can see that the execution time is only 36.8ms for the case where there are 15 attributes in total and each attribute has 8 possible values. This is acceptable for such a large number of generated candidate services. We then vary the number of agents from 2 up to 16 to compare the execution time. In this case, there are 8000 candidate services. We can see from Figure 7(b) that the execution time increases linearly with the number of agents. Our algorithms scale well with the increase of the number of agents involved in the service selection process. We also fix the number of candidate services to 8000 and the number of attributes to 15, but vary the number of possible values for each attribute. The results in Figure 7(c) show that our algorithms increase exponentially when each attribute has a larger number of possible values. Finally, we test the execution time of our algorithms for the extreme case
where there are 8000 candidate services, 15 attributes, and 16 agents, and each attribute has 8 possible values. We run our experiment for 30 times. The results plotted in Figure 7(d) show that the average execution time of our algorithms for this extreme case is less than 1 second, which is still acceptable for users of service selection. Furthermore, the time of each execution is close to the average execution time, indicating that our experimental results in this section are statistically significant. 6.4. Experiments on Semantic Validation In this section, we show the results of semantic validation for the top 5 Sub_aSets when varying the number of agents, attributes and attribute constraint values. The first set of experiments is to show the semantic validation for the top 5 Sub_aSets under the voting semantics of Pareto, Majority and Max when the number of agents is 4, 8, 16 and 32 respectively. These experiments involve 6 attributes and each attribute has 4 constraint values. As some Sub_aSets (for example, T2) may contain more than one service patterns, we compute the average value of P SD, M ajSD and M axSD for service patterns in those Sub_aSets. The values of P SD, M ajSD and M axSD for the top 5 service pattern Sub_aSets are shown in Figure 8. From the results, we can see that when the number of agents is 4, service patterns in T1 have P SD=33.3%, M ajSD=83.3% and M axSD=83.3%, while service patterns in T5 have P SD=0%, M ajSD=20.7% and M axSD=36%. The values of P SD, M ajSD and M axSD are from high to low for T1 to T5. This trend is also true when the number of agents is 8, 16 and 32 respectively, which demonstrates that the ranking for the top 5 Sub_aSets is reliable. The second set experiments aims to verify the top 5 Sub_aSets under the voting semantics of Pareto, Majority and Max when the number of attributes is 6, 9,
H. Wang et al. / Qualitative Preference-Based Service Selection for Multiple Agents
12 and 15 respectively. It involves 32 agents, and each attribute has 4 constraint values. The values of P SD, M ajSD and M axSD for the top 5 Sub_aSets’s are shown in Figure 9. From the results, we can see that under 6 attributes, service patterns in T1 have P SD = 16.7%, M ajSD = 66.7% and M axSD = 100%, while those in T5 have P SD = 0%, M ajSD = 16.9% and M axSD = 39.3%. The values of P SD, M ajSD and M axSD are from high to low for T1 to T5. This trend is also true for the cases of 9 attribute, 12 attribute, 15 attribute, which validates that the ranking for the top 5 Suba Sets is reliable. The third set of experiments is used to verify the top 5 Sub_aSets under Pareto, Majority and Max when varying the number of attribute constraints. These experiments involve 32 agents and 15 attributes, and the number of constraint values of each attribute varies from 2 to 8. The semantic validation for the top 5 Sub_aSets is shown in Figure 10. From the results, we can see that under 2 constraint values, T1 has P SD = 6.7%, M ajSD = 80%, and M axSD = 100%, while T5 has P SD = 0%, M ajSD = 26.7%, and M axSD = 45.6%. The values of P SD, M ajSD, and M axSD are from high to low for T1 to T5 when the number of constraint values is 2. This trend is also true for the cases where the number of attribute values is 4, 6, and 8 respectively. This confirms that the ranking of the top 5 Sub_aSets is reliable. The additional semantic validation also provides more information for agents to select best service patterns, in order to find the most satisfactory services.
7. Related Work In recent years, service selection based on QoS for multiple agents has become an important research problem in the area of service computing. The existing investigation is mainly focused on three directions: QoS-oriented service selection, the group decision of multi-agents, and uncertain preferences and factors in service selection. In this section, we provide brief descriptions of the studies in each direction and contrast our work with those studies. Different quantitative approaches have been proposed for QoS-oriented service selection [1,2,11]. Ardagna and Pernici [2] introduce a mixed integer linear programming modeling approach to the service selection problem. Lamparter et al. [1] uses utility function policies which are drawn from multi-attribute decisions theory methods to develop algorithms for opti-
15
mal service selection. However, these methods require users to provide the exact weight of each attribute. In many situations, users possibly do not know how they should assign weights to attributes in order to maximally meet their preferences. Quantitative methods have also been considered for service composition. Quantitative intentional automata (QIA) [12] is proposed to address the composition of service oriented computing. QIA is an extension of constraint automata (CA) that incorporates the influence of a system’s environment on its performance. The quantitative constraint automata extends CA with quantitative models to capture such non-functional aspects of a system’s behavior. An efficient service selection algorithm [13] is also presented to provide the appropriate ground for QoS-aware composition in dynamic service environments. This algorithm is formed as a guided heuristic, and uses “quality level" to express the QoS attributes of services. It proceeds by exploring a combinatorial search tree built from candidate services according to certain rules. Although quantitative approaches have been widely used, qualitative methods, on another hand, are more general. Garcia et al. [14] present a service selection framework that transforms qualitative preferences into an optimization problem. However, they address only a single agent’s complete preferences. Group decision making of multi-agents is also an important direction of related research work. HerreraViedma et al. [15] present a selection process to deal with group decision making problems with incomplete fuzzy preference relations. They use consistency measures to estimate the incomplete fuzzy preference relations, and propose an iterative procedure to estimate the missing information in incomplete fuzzy preference relations. Xu and Chen [16] develop linear-programming models for dealing with MAGDM (multiple-attribute group decision making) problems, where the information about attribute weights is incomplete and the decision makers have their preferences on alternatives. Zhang et al. [17] propose an integration approach to combine multiple attribute decision making with users’ preference information on alternatives. [18] allows users to interpret the relationships between their query terms and the query space. Accordingly, it allows the users to take an active role in the information retrieval process. Some researchers have done work in the combination of service selection and group decision. For example, in [19], Lo et al. propose a Web Services Integration and Processing Language to describe opera-
16
H. Wang et al. / Qualitative Preference-Based Service Selection for Multiple Agents
tions and data sources in data processing and integration to fulfill dynamic business requirements. [20] propose an enhanced I-B and B-MDL algorithm, which tries to reduce constraint computation costs and improve the pruning efficiency by means of sort order for candidate parent nodes. [21] tries to solute the problem that efficient local selection strategy fails short in handling global QoS requirements. The authors consider the quantitative non-functional properties of services, and propose a solution that consists of two steps: 1) a mixed integer programming (MIP) is used to find the optimal decomposition of global QoS constraints into local constraints; 2) distributed local selection is then used to find the best services that satisfy these local constraints. Furthermore, they use the notion of skyline to express the services’ quantitative QoS attributes. [22] propose an approach to effectively and efficiently select services for composition, reducing the number of candidate services to be considered. [23] distinctively use the concept of lexicographical preferences for the multi-criteria decision-making of the most suitable information and services that fit user needs. The criterion satisfaction levels are defined with a single threshold that represents a boundary value between acceptable and unacceptable values of attributes of alternatives. [24] propose an algorithm that can recommend a number of suitable services based on the user’s QoS requirements. In this work, the service’s response time, trust degree and monetary cost are considered. [25] tries to use a semantic method to support the automated discovery, selection, and composition of services. They design an efficient model-driven approach to generate OWL-S ontologies from Unified Modeling Language (UML) models. But, due to the complexity of the OWL-S grammar and UML, it is difficult to realize the service selection and discovery manually. Some researchers try to use empirical analysis to study consumer selection of ECommerce websites in a B2C environment [26]. They present and empirically examine a model where website value in terms of website quality as well as awareness of the site and consumer differences are key variables in explaining online consumer behavior in their choice of websites despite the existence of price dispersions. [27] propose several multiple criteria programming methods for analyzing customers’ behavior and finding the appropriate measures to satisfy the VIP user’s requirements. [28] examine a class of WSC problems, attempting to balance the trade-off between offline composition and online information gathering with a view of producing high-quality compositions
efficiently and without excessive data gathering. Their investigation is performed in the context of the semantic web employing an existing preference-based Hierarchical Task Network WSC system. [29] propose an interaction model to detect and resolve inconsistencies in evolving service compositions. This work presents a new method that associates web services with agents’ capability of communication and reflective process execution. [30] presents a framework for web service composition based on social norms, particularly obligations. Because of the importance of user preferences during the service selection, some researchers have studied the effect of uncertain preference in service computing. [31] studies the problem of majority-rule-based collective decision-making where the agents’ preferences are represented by CP-nets. This paper proposes an efficient SAT-based approach, called MajCP, to compute the majority winning alternatives. [32]studies the problem of dominance testing in CP-nets. The authors propose a heuristic algorithm for dominance testing with arbitrary acyclic CP-nets. Their work is only applicable for acyclic CP-nets. Furthermore, uncertain factors have been considered in the QoS of services. In [33], an approach is proposed to measure the quality of elementary services based on the superposition of uncertain factors. And services’ priorities can be determined by a method according to the qualities of elementary services. Although many researchers have worked on the service selection in the environment of multi-agents, the existing approaches are mostly based on quantitative approaches. But in many cases, user’s preference cannot be represented by quantitative approaches. In this case, qualitative approaches can be another choice for the representation of agents’ preferences. We apply the compact representation of agents’ preferences using CP-nets and propose a list of algorithms by implementing the Rank and Lex semantics that are verified by other voting semantics, to select satisfactory services for multiple agents with incomplete preferences.
8. Conclusions and Future Work Our work allows for service selection based on agent preferences in a qualitative rather than quantitative way. We use CP-nets for representing agents’ incomplete preference statements. We also implement the Rank and ceteris paribus semantics for aggregating multiple agents’ preferences. We then apply this ap-
H. Wang et al. / Qualitative Preference-Based Service Selection for Multiple Agents
proach in the design of the algorithms to QoS-based service selection for multiple agents with incomplete preferences. Our experimental results show that our approach is effective in selecting the best services for multiple agents even when they have incomplete preferences, and the execution time of our algorithms is generally acceptable for a large number of agents when many services are available for selection. Our approach may be extended to cope with more general group decision making problems with incomplete preference relations, as we will consider more complex preferences for service selection in the future. For future work, we will also consider preference analysis when there is a cycle in CP-nets.
Acknowledgments This work is partially supported by the NSFC (61232007) and JSNSF of China (No.BK2010417).
References [1] S. Lamparter, A. Ankolekar, R. Studer, and S. Grimm, “Preference based selection of highly configurable web services,” in Proceedings of the 16th ACM International Conference on World Wide Web (WWW), Banff, AB, Canada, 2007, pp. 1013 – 1022. [2] D. Ardagna and B. Pernici, “Adaptive service composition in flexible processes,” IEEE Transactions on Software Engineering, vol. 33, no. 6, pp. 369–384, 2007. [3] P. Xiong and Y. Fan, “Qos-aware web service selection by a synthetic weight,” in Proceedings of the Fourth International Conference on Fuzzy Systems and Knowledge Discovery (FSKD), Haikou, China, 2007, pp. 632–637. [4] C. Boutilier, R. I. Brafman, H. H. Hoos, and D. Poole, “Preference-based constrained optimization with cp-nets,” Computational Intelligence, vol. 20, no. 2, pp. 137–157, 2004. [5] H. Wang, J. Zhang, Y. Tang, and S. Shao, “Collaborative approaches to complementing qualitative preferences of agents for effective service selection,” in Proceedings of the 23rd IEEE International Conference on Tools with Artificial Intelligence (ICTAI), Boca Raton, Florida, USA, 2011, pp. 51–58. [6] H. Wang, J. Zhang, C. Wan, S. Shao, R. Cohen, J. Xu, and P. Li, “Web service selection for multiple agents with incomplete preferences,” in Proceedings of the IEEE/WIC/ACM International Conference on Web Intelligence (WI), Toronto, Canada, 2010, pp. 565–572. [7] C. Boutilier, R. I. Brafman, C. Domshlak, H. H. Hoos, and D. Poole, “Cp-nets: A tool for representing and reasoning with conditional ceteris paribus preference statements,” Journal of Artificial Intelligence Research, vol. 21, pp. 135–191, 2004. [8] F. Rossi, K. B. Venable, and T. Walsh, “mcp nets: Representing and reasoning with preferences of multiple agents,” in Proceedings of the National Conference on Artificial Intelligence (AAAI), San Jose, CA, United states, 2004, pp. 729 – 734.
17
[9] L. Weigang and V. Fracari Branco, “A web information system for determining the controllers of financial entities in central bank of brazil,” Web Intelligence and Agent Systems, vol. 4, no. 1, pp. 99–116, 2006. [10] R. L. Keeney and H. Raiffa, Decision with Mutiple Objectives: Preferences and Value Tradeoffs. Wiley, 1976. [11] Z. Maamar, Q. Sheng, and B. Benatallah, “Towards a conversation-driven composition of web services,” Web Intelligence and Agent Systems, vol. 2, no. 2, pp. 145–150, 2004. [12] F. Arbab, T. Chothia, R. Van Der Mei, S. Meng, Y. Moon, and C. Verhoef, “From coordination to stochastic models of qos,” in Proceedings of the 11th International Conference on Coordination, Lisbon, Portugal, 2009, pp. 268–287. [13] S. Sohrabi and S. A. McIlraith, “Preference-based web service composition: A middle ground between execution and search,” in Proceedings of the 9th International Semantic Web Conference (ISWC), Shanghai, China, 2010, pp. 713–729. [14] J. M. Garcia, D. Ruiz, A. Ruiz-Cortes, and J. A. Parejo, “Qosaware semantic service selection: An optimization problem,” in Proceedings of the IEEE Congress on Services (SERVICES), Honolulu, HI, United states, 2008, pp. 384–388. [15] E. Herrera-Viedma, F. Chiclana, F. Herrera, and S. Alonso, “Group decision-making model with incomplete fuzzy preference relations based on additive consistency,” IEEE Transactions on Systems Man and Cybernetics Part B (Cybernetics), vol. 37, no. 1, pp. 176–189, 2007. [16] Z. S. Xu and J. Chen, “MAGDM linear-programming models with distinct uncertain preference structures,” IEEE Transactions on Systems Man and Cybernetics Part B, vol. 38, no. 5, pp. 1356–1370, 2008. [17] Q. Zhang, W.-J. Feng, and D. Shao, “An integration approach to multiple attribute decision making with preference information on alternatives,” in Proceedings of the Chinese Control and Decision Conference (CCDC), Yantai, Shandong, China, 2008, pp. 3977–3981. [18] O. Hoeber, X. Yang, and Y. Yao, “Visiq: Supporting visual and interactive query refinement,” Web Intelligence and Agent Systems, vol. 5, no. 3, pp. 311–329, 2007. [19] E. Lo, D. Cheung, C. Ng, and T. Lee, “Wsipl: An xml scripting language for integrating web service data and applications,” Web Intelligence and Agent Systems, vol. 4, no. 1, pp. 25–41, 2006. [20] J. Ji, C. Liu, J. Yan, and N. Zhong, “An improved bayesian network structure learning algorithm and its application in an intelligent b2c portal,” Web Intelligence and Agent Systems, vol. 5, no. 2, pp. 127–138, 2007. [21] M. Alrifai and T. Risse, “Combining global optimization with local selection for efficient qos-aware service composition,” in Proceedings of the 18th International World Wide Web Conference (WWW), Madrid, Spain, 2009, pp. 881–890. [22] M. Alrifai, D. Skoutas, and T. Risse, “Selecting skyline services for qos-based web service composition,” in Proceedings of the 19th International Conference on World Wide Web (WWW), Raleigh, NC, United states, 2010, pp. 11–20. [23] R. R. Yager, G. Gumrah, and M. Z. Reformat, “Using a web personal evaluation tool - pet for lexicographic multi-criteria service selection,” Knowledge-Based Systems, vol. 24, no. 7, pp. 929–942, 2011. [24] L. Zhao, Y. Ren, M. Li, and K. Sakurai, “Flexible service selection with user-specific qos support in service-oriented architecture,” Journal of Network and Computer Applications, vol. 35,
18
H. Wang et al. / Qualitative Preference-Based Service Selection for Multiple Agents
no. 3, pp. 962 – 973, 2012. [25] I.-W. Kim and K.-H. Lee, “A model-driven approach for describing semantic web services: From uml to owl-s,” IEEE Transactions on Systems, Man and Cybernetics, Part A: Systems and Humans, vol. 39, no. 6, pp. 637–646, 2009. [26] H. Zo and R. K., “Consumer selection of e-commerce websites in a b2c environment: A discrete decision choice model,” IEEE Transactions on Systems, Man and Cybernetics, Part A: Systems and Humans, vol. 39, no. 4, pp. 819–839, 2009. [27] P. Zhang, X. Zhu, Z. Zhang, and Y. Shi, “Multiple criteria programming models for vip e-mail behavior analysis,” Web Intelligence and Agent Systems, vol. 8, no. 1, pp. 69–78, 2010. [28] M. S. Sohrabi Shirin, “Preference-based web service composition: A middle ground between execution and search,” in Proceedings of the 9th International Semantic Web Conference (ISWC), 2010, pp. 713–729. [29] R. Elio, E. Stroulia, and W. Blanchet, “Using interaction models to detect and resolve inconsistencies in evolving service compositions,” Web Intelligence and Agent Systems, vol. 7,
no. 2, pp. 139–160, 2009. [30] J. Gutierrez-Garcia, F. Ramos-Corchado, and J. Koning, “An obligation-based framework for web service composition via agent conversations,” Web Intelligence and Agent Systems, vol. 10, no. 2, pp. 135–150, 2012. [31] M. Li, Q. B. Vo, and R. Kowalczyk, “Majority-rule-based preference aggregation on multi-attribute domains with cp-nets,” in Proceedings of the 10th International Conference on Autonomous Agents and Multiagent Systems (AAMAS), Taipei, Taiwan, 2011, pp. 659–666. [32] ——, “Efficient heuristic approach to dominance testing in cpnets,” in Proceedings of the 10th International Conference on Autonomous Agents and Multiagent Systems (AAMAS), Taipei, Taiwan, 2011, pp. 353–360. [33] K. Yue, W. Liu, X. Wang, and J. Li, “Approach for measuring quality of web services based on the superposition of uncertain factors,” Computer Research and Development, vol. 46, no. 5, pp. 841–849, 2009.