well suited to computational neuroscience because nerve cells are homeostatic, maintaining many cellu- lar parameters within a relatively small number of.
Qualitative Reasoning as a Modeling Tool for Computational Neuroscience Lawrence Hunter, Jeffery L. Krichmar, and James L. Olds {hunter, jkrichma, olds) @ kias.gmu.edu Krasnow Institute for Advanced Study Mail Stop 2A 1 George Mason University Fairfax, Virginia, USA Abstract. Integrating knowledge of cellular and molecular physiology in biologically realistic models of neural activity is a crucial part of modern neuroscience. Existing state of the art computational neural modeling tools such as GENESIS and NEURON are constrained in their application by their large computational demands . In this paper, we present QRN, a semi-qualitative neural modeling approach based on QSIM, which achieves accurate and efficient modeling of nerve cells at the molecular level, and provides significant speedups over numeric differential equation models . Qualitative modeling is well suited to computational neuroscience because nerve cells are homeostatic, maintaining many cellular parameters within a relatively small number of nearly discrete states. We introduce a simple weight scheme for resolving ambiguity in QRN, and demonstrate that QRN models closely match both neurobiological reality and the results of numeric models . We also present a simplified model, SQRN, that achieves the same results at even greater efficiency . 1 Introduction An increasingly popular tool among -neuroscientists interested in understanding neural behavior is computational models . Computational models summarize what is known about a system (Stein and Glickstein 1992) and reveal emergent properties that are difficult to deduce from neurobiological experiments (Churchland and Sejnowski 1993). The field of computational neuroscience focuses on the question of how the brain computes as opposed to the more classical question of what is the brain's structure (Bower and .3reman 1994). Modeling approaches in computational neuroscience generally fall into one of two categories . In one approach, differential equations describing the state of a neuron are developed by studying the electrical properties of a neuron
under laboratory conditions. The equations are then used to model the behavior of a neuron in an idealized situation . The Hodgkin-Huxley model of the giant squid axon (see Hille 1992 for review) and Rall's model of passive cable properties of dendrites (Rail 1964, Segev 1992) are two early models that gave credence to the use of mathematical equations to describe neural phenomena . GENESIS, a general purpose modeling tool, uses numerical integration methods to the solve equations that characterize a computational simulation (Bower and Beeman 1994) . Another general purpose neural simulator, NEURON, connects cable sections together with each section containing differential equations describing membrane properties and channel kinetics (Hines 1993). These mathematical models tend to be computationally expensive and thus difficult to scale up to large networks of neurons. An alternative approach is the use of artificial neural networks, which model assemblies of elements that have some of the features of biological neurons. These models tend to use weights to describe synaptic efficacy and either a step or a sigmoid function to describe action potentials. Artificial neural networks have been instrumental in developing a theory of distributed coding in the visual system (Lehky and Sejnowski 1990) and the vestibulo-ocular reflex (Anastasio and Robinson 1989). However, these models sacrifice features of real brain networks, such as, synaptic transmission, temporal properties and architecture for the ability to build large assemblies of neuronal elements (Chapeau-Blondeau and Chambet 1995) Recently, Idan Segev called for a class of intermediate models that "still retain the essential features of the full models" of single neurons but allow the creation of large networks (Segev 1992). We have developed an approach, called the Qualitative Reasoning Neuron (QRN), that meets this criteria . QRN qualitatively reproduces single neuron behavior, but is computationally simple enough to use in large scale neural networks. QRN is based on the Qualitative Simulation (QSIM) algorithm (Kuipers 1986), but resolves ambiguity through the use of integer weights identifying the relative importance of influences on states . The technique is extremely efficient because few quantitative values need to be calculated. However, accurately detailed and predictive properties emerge from QRN simulations . QRN has been used to simulate the voltage and current response predicted by the Hodglan-Huxley squid axon model (Krichmar 1994) and simulate adaptive motor
control in a moderately sized model of the cerebellar cortex (Krichmar 1995). The precision that mathematical models provide can be unnecessary and burdensome on processing time. Qualitative reasoning focuses on detecting and reporting critical changes and trends in the system under simulation . In this paper, we describe in some detail a qualitative model of a particular type of neuron, and demonstrate that the qualitative model retains impor tant neurophysiological detail while being significantly more computationally efficient than numeric differential equation models . Our test case compares QRN with a carefully validated numeric model, which represents the current state of the art in numeric neural modeling . This model is of a neuron called the Purkinje cell, which has been mathematically described in the literature (Bush and Sejnowski 1991, Rapp et al . 1994, Rapp et al. 1992). QRN is compared directly with a GENESIS model of the Purkinje cell (De Schutter and Bower 1994ab) . We show that the QRN model of the Purkinje cell is less computationally intensive than GENESIS without losing accuracy or fidelity . 2 Methods QRN simulates the behavior of a single Purkinje cell by qualitatively describing the relationships among the various ionic currents and cell's membrane potential. Ambiguities in these influences are balanced against each other by small integer weights, which can be easily determined from the biological literature . In general, computation in the QRN algorithm is performed through integer addition, subtraction or table lookups . Division and exponential operators are unnecessary and only one integer multiplication operation is used in the software that executes the QRN algorithm. The software, written in C++, has a modular design that facilitates scaling to larger network models . 2.1 QRN Model Simulation of a Purkinje Cell In this section, we describe in detail the states and influences used to model the Purkinje cell . The parameters of the QRN model are based on De Schutter and Bower's GENESIS model of a cerebellar Purkinje :;ell (De Schutter and Bower 1994ab). The morphology of the cell, derived from the De Schutter and Bower PN19 representation, is based on the morphology of a guinea pig Purkinje cell from Rapp et al. (cell 1, Rapp et al. 1994). The QRN model contains 1 soma, 9 main dendrites, 60 thick dendrites, and 1530 spiny dendrites. The inputs to the model are as fol-
lows : Each spiny dendrite has a spine that receives parallel fiber input. A single climbing fiber contacts each thick dendrite and main dendrite . -A stellate cell synapses on each spiny dendrite and two stellate cells synapse on each thick dendrite . Each soma and main dendrite receives basket cell inhibition . The distribution of channels in the QRN implementation of the Purkinje cell model is comparable to those described by De Schutter and Bower. QRN models a fast sodium current (NaF), a persistent odium current (NaP), a P calcium current (CaP), a T calcium current (CAT), an anomalous rectifier (Kh), a delayed rectifier (Kdr), a persistent potassium current (KM), an A current (KA), a BK calcium-activated potassium current (KC), a K2 calcium-activated potassium current (K2), a glutamate channel for parallel fiber input (PF), a glutamate channel for climbing fiber input (CF), a GABA channel for basket cell input (BK), and a GABA channel for stellate cell input (ST). Table 1 describes the distribution of the modeled channels, their relative weight by cell compartment type, and a threshold landmark, if applicable . The relative weight expresses the density, g, of channels, and is used to resolve ambiguities in the state calculations . As was done in the GENESIS model, the weights of the channels are allowed some variation from the published values so that the model produces appropriate global behavior for a Purkinje cell . The threshold landmark is used if a channel does not open until the level of activity of an input parameter increases beyond a given threshold. For ex ample, the BK calcium-activated potassium channel does not allow K+ ions to flow out of the cell until a certain amount of Ca' is present inside the cell . Qualitatively, this would be described by the equation: M+(TH(Ca, BK Threshold), K+) All of QRN's parameters are continuous variables with the exception of the NaF and NaP channels in the soma, and the KA and Kdr channels in the soma and main dendrites . QRN models NaP as a discrete yaria4le with open, closed and inactive states . When : tk~e mmembrane potential reaches above the threshold given, in Table 1, NaP transitions from closed to open. :lRuring the open state, an influx of Na' causes the + level within the cell to increase . If the level of Na- reaches the peak landmark value, NaP transitions to inactive . During the inactive state, Na' influx halts and the level of Na+ stays steady . When the membrane potential reaches the steadystate landmark value, NaP transitions to the closed state.
267
Name NaF NaP CaP
CaT Kh Kdr KM
Soma Weight
Main Dendrite Weight
Thick Dendrite Weight
Spiny Dendrite Weight
N/A
N/A
40
N/A
N/A
N/A
N/A 1
7
7
7
10
1
2
2
N/A
N/A
N/A
KA
2
2
K2
N/A
1
1
PF
CF
BK ST
1
2
N/A NIA
KC
1
2
50
10
N/A
N/A
N/A
25
15
N/A 20
N/A
N/A N/A
50
N/A
50
Threshold 10
N/A
5
2
N/A N/A
N/A N/A N/A N/A 1
9
10 N/A N/A 20
N/A
20
N/A 5 30
45
N/A N/A N/A N/A
Table 1. Distribution and relative weights of the channels modeled by QRN. Weights are integers used to scale opposing influences on a state to resolve ambiguities. These weights are derived from the neurobiological literature (e.g. Forsythe and Westbrook 1988, Holmes and Levy 1990, Nelson et al. 1986). A weight of N/A indicates that the channel is not present in that compartment type. Channels with a threshold will be inactive until the input to the channel is above the given threshold value. A threshold of N/A indicates that the channel does not have a threshold. The NaF channel is similar to the NaP channel, but has additional logic to qualitatively represent the faster time course in response to a large increase in membrane potential . For example, active climbing fibers increase the magnitude of change in soma membrane potential, as given by the qualitative weight, more than summation of synapses in the dendritic tree . If this larger increase in membrane potential occurs, the NaF channel transitions to an accelerated state and a different set of landmark values are used to represent the faster opening and closing of NaF channels . QRN models the KA channel as a discrete variable with open and closed states . When the membrane potential reaches above the threshold given in Table 1, KA transitions from closed to open . During the open state, an efflux of K+ causes the level of intracellular K+ to decrease. When the membrane potential reaches the steady-state landmark value, KA transitions to the closed state. During the closed state, K+ efflux halts and the level of K+ stays steady . QRN models the Kdr channel as a discrete variable with open, closing and closed states . When
the membrane potential reaches above the threshold given in Table 1, Kdr transitions from closed to open. During the open state, an efflux of K+ causes the level of intracellular K+ to decrease and the qualitative state of Kdr increases. When Kdr reaches the landmark representing the maximum open time for the channel, Kdr transitions to closing and the qualitative state of the Kdr channel decreases. Kdr transitions from the closing state to the closed state when it reaches its minimum landmark value. During the closed state, K+ efflux halts and the level of K+ stays steady . Kdr has an accelerated state similar to the NaF channel described above during which the Kdr landmarks represent faster open and close time con- . stants . The constraints on the Purkinje cell describe the qualitative interaction of parameters within the dendritic spine, spiny dendrite, thick dendrite, main dendrite and soma compartments . The constraints also describe the qualitative interaction between compartments . A compartment receives the membrane potential of its children and the calcium of its parent as input. Attenuation is modeled by a weight
Figure 1 . Constraints on the dendritic shine. The dendritic spine receives parallel fiber input (Pf) . Pf input has a monotonically increasing effect on the membrane potential of the spine (ESP) . that decreases the magnitude of the parent calcium by one half in the spiny dendrite and by one fourth elsewhere. Attenuation of the child membrane potential is modeled with a weight decrease of one fourth . The dendritic spine receives parallel fiber input. An increase in activity of the parallel fiber will increase the membrane potential of the dendritic spine. The constraint model for the dendritic spine is shown in Figure 1 . The spiny dendrite receives input from the membrane potential of the neighboring spine, stellate inhibition and calcium from its parent . The parent branch can be either a thick dendrite, a main dendrite, the soma, or another spiny dendrite . The constraints on spiny dendrite calcium are resolved through qualitative simulation of the CAT and CaP channels . The constraints on spiny dendrite potassium are resolved through qualitative simulation of the K2 and KC channels . The constraint model for the spiny dendrite is shown in Figure 2. Not shown in Figure 2 are calcium and potassium uptake currents that have a relative weight of one. The thick dendrite receives as input the membrane potential of the neighboring child benches, a single climbing fiber, a single stellate cell and calcium from its parent branch. -The child branch can be a spiny dendrite or another thick dendrite . The parent branch can be either a main dendr~te, the soma, or another thick dendrite . The constraints on thick dendrite calcium are resolved through qualitative simul -
Figure 2. Constraints on the spiny dendrite . The spiny dendrite receives input from the dendritic spine (ESP), stellate cells (ST), and the parent's calcium (CaParent) . CaParent, ESP, ST, spiny dendrite calcium (CaSPD), a persistent potassium current (KM), and potassium (K) all have a qualitative effect on the membrane potential of the spiny dendrite (ESPD). An increase in ESPD opens voltage gated calcium channels, CaP and CaT, that consequently has, a qualitative effect on the calcium-activated potassium channels KC and K2 (shown as CaK in the figure). tion of the CaT and CaP channels . The constraints on thick dendrite potassium are resolved through qualitative simulation of the K2 and KC channels . The constraint model for the thick dendrite is shown in Figure 3 . Not shown in Figure 3 are calcium and potassium uptake currents that have a relative weight of one . The main dendrite receives as input the membrane potential of the neighboring child branches, a single climbing fiber, a single basket cell and calcium from its parent branch . The child branch can be a thick dendrite or another main dendrite . The parent branch can be either the soma, or another main dendrite . The constraints on main dendrite calcium are resolved through qualitative simulation of the CaT and CaP channels . The constraints on main dendrite potassium are resolved through qualitative simulation of the K2 and KC calcium-activated channels, as well as the KA and Kdr voltage-activated channels. The constraint model for the main dendrite is shown in Figure 4. Not shown in Figure 4 are calcium and potassium uptake currents that have a relative weight of one.
Figure 3. Constraints on the thick dendrite . The thick dendrite receives input from the child dendritic branches (EChild), climbing fiber (CF), stellate cell (ST), and the parent's calcium (CaParent) . CaParent, CF, EChild . ST, thick dendrite calcium (CaTHD), a persistent potassium current (KM), and potassium (K) all have a qualitative effect on the membrane potential of the spiny dendrite (ETHD). An increase in ETHD opens voltage gated calcium channels, CaP and CaT, that consequently, has a qualitative effect on the calcium-activated potassium channels KC and K2 (shown as CaK in the figure). Figure 4. Constraints on the main dendrite . The main dendrite receives input from the child dendritic branches (EChild), climbing fiber (CF), basket cells (BK), and the parent's calcium (CaParent) . CaParent, CF, EChild . BK, main dendrite calcium (CaMD), potassium (K), a persistent potassium current (KM), and a leak current (L) all have a qualitative effect on the membrane potential of the main dendrite (EMD). An increase in EMD opens voltage-gated calcium channels, CaP and CaT, that consequently, has a qualitative effect on the calcium-activated potassium channels KC and K2 (shown as CaK in the figure) . An increase in EMD opens voltage-gated potassium channels KA and Kdr.
270
Ca
so
K
Na
E so
Eso
E so
E so
Eso
E so
so K
Figure 5. Constraints on the soma . The soma receives input from the neighboring branch of a main dendrite (EMD) and basket cells (BK) . EMD, BK, soma calcium (CaSO), potassium (K), a persistent potassium current (KM), sodium (Na) and a leak current (L) all have a qualitative effect on the membrane potential of the soma (ESO). An increase in ESO opens voltage-gated calcium channel (CaT), voltage-gated potassium channels (KA and Kdr) and voltage-gated sodium channels (NaF and NaP). The soma receives as input the membrane potential of the neighboring main dendrite branch and basket inhibition . The constraints on soma calci um are resolved through qualitative simulation of the CaT channel. The constraints on soma potassium are resolved through qualitative simulation of the KA, Kdr and Kh voltage-activated channels . The constraints on soma sodium are resolved through qualitative simulation of NaF and NaP voltage-activated channels . The constraint model for the soma is shown in Figure 5 . Not shown in Figure 5 are calcium, potassium and sodium uptake currents that have a relative weight of one.
2.2 Simplified QRN (SQRN) Purk:nje Cell with Active Spines and Axon A second qualitative reasoning model (SQRN) of the Purkinie cell was developed with the intention of creating a model with qualitatively iden tical output but simpler (and faster to compute) structure. Ultimately, we hope to be able to automate this optimization process so that computationally efficient and functionally identical models can be pro-
duced from initial models that are based on the neurobiological literature . This simplified model has one soma that has 64 dendrritc branches, each of which, have 24 dendritic spines . There are 1536 total spines in the mod el. Simplifications of the Section 2 .3 Purkinje cell model include : 1) Collapsing the voltage-gated calcium channels into one dendrite parameter. 2) Collapsing the calcium-activated potassium channels into one dendrite parameter . 3) Building a uniform dendritic tree . 4) Changing the soma into a summing junction of the membrane potential given by its child dendrites. 5) Setting the weight of all parameters to one . There are two versions of this simplified model ; one with passive spines and the other with active spines . The passive spine version utilizes the same constraints as illustrated in Figure l . In the active spine version, the bulk of the processing is in the dendritic spine (see Figure 6). These spines model subcellular processes that lead to calcium spikes and cerebellar LTD (based on Figure 2 of Linden and Connor 1995). The constraint model for the simplified Purkinje cell is given in Figures 6 through 8.
Figure 6. Constraints on the Dendritic Spine. The dendritic spine receives a parallel fiber (Pf) and dendritic calcium (CaD) as input. The membrane potential at the dendritic spine (ESP), shown on the left, is based on the qualitative interaction between sodium ions (Na), CaSP, internal stores of calcium at the spine (CaSP), and voltage attenuation (shown as the EXPD function) . Phospholipase C (PLC) is activated in the presence of glutamate due to Pf activity . CaSP levels increase due to activation of instill- 1,4,5-triphospate (IP3) . Cerebellar long-term depression (LTD), shown on the right is due to a desensitization of the AMPA receptor to Pf input . LTD is based on the qualitative interaction of Na, CaSP, 1,2 diacyglycerol (DAG) and protein kinase C (PKC). Figure 7. Constraints on the Dendrite . The dendrite receives climbing fiber (CF) and a voltage signal from the dendritic spines (ESP) as input. The figure on the left illustrates the constraints involved in the calculation of dendritic membrane potential (ED) . ED is based on the qualitative interaction between ESP, CF, dendritic calcium (CaD) and voltage attenuation of ED (shown by EXPD function) . The figure on the right illustrates the constraints involved in the calculation of voltage-gated calcium at the dendrite . CaD is based on the qualitative interaction between ED, stellate cell inhibition (st), and CaD current attenuation due to the opening of calcium activated potassium channels (Ca-K). Figure 8. Constraints on the Soma. The soma receives climbing fiber (CF) and a voltage signal from the dendrites (ED) as input . The figure illustrates the constraints involved in the calculation of somatic membrane potential (ESO). ESO is based on the qualitative interaction between ED, CF, basket cell (BK) inhibition and voltage attenuation of ESO (shown by EXPD function) .
Figure 9. Single simple spike in response to excitatory input from parallel fibers . The chart on the left is a qualitative plot of the soma membrane potential parameter of the QRN model . The Y-axis lists the landmarks for soma membrane potential. The parameter's value is either at or between a landmark . The arrows denote the qualitative direction of the parameter. The double arrow represents a direction of steady . The chart on the right is the post-processor output of the QRN model. Both charts represent the membrane potential at the soma over time. On both charts, the number tags denote landmark transitions. Tag I marks sub-threshold steady-state . Tag 2 marks the transition from steady-state to above threshold . Tag 3 denotes the peak of the action potential . Tag 4 denotes the transition from the absolute refractory period to the relative refractory period . Tag 5 marks the end of the relative refractory period . See text for details on the post-processor . Similar to the version described in section 2. t, the simplified QRN Purkinje cell model simulates the accelerated opening and closing of channels during climbing fiber input by using landmark values for the soma membrane potential that reflect the faster time course . 2.3 Synaptic Inputs to the Model The inputs to both the QRN and SQRN modare simulated similar to the GENESIS Purkinje els cell model. Parallel fiber excitation fired asynchro nously ranging from 1 Hz to 100 Hz . Inhibitory stellate cells fired asynchronously ranging from I Hz to 30 Hz (Edgley and Lidierth 1987, Mitgaard 1992) . Excitatory climbing fibers fired as an ascending volley from the main dendrites to the thick dendrites (Llinas and Nicholson 1976) . Inhibitory basket cells fired synchronously to the soma and main dendrites . 2.4 Execution of the Purkinje Cell Simulation The QRN simulation of a Purkinje cell was carried out as close to the GENESIS simulation as possible . A time step represents a simulation time of 20 microseconds . The Purkinje cell model ran under
version 2.01 of the GENESIS simulator. All three models executed their simulations under LINUX on a 75MHz Pentium Personal Computer with 16Mb of RAM . 2.5 Analyzing QRN Results As was previously discussed, qualitative reasoning describes a system by the qualitative behavior of its parameters . The parameters can be increasing, decreasing or steady . The value of these parameters are represented by landmarks and not numerical values . Therefore, it is difficult to display QRN's results on a standard graph. The chart on the left of Figure 9 shows QRN's output of the qualitative parameter, membrane potential at the soma (ESO), during a single simple spike. The arrows in the chart represent the qualitative direction of the parameter. The up arrow denotes increasing, the down arrow denotes decreasing, and the double arrow denotes steady . At tag 1, the qualitative value is at "steady-state", that is, between the minimum landmark and the threshold landmark. Qualitative parameters, such as calcium, sodium, and membrane potential in the dendritec tree cause ESO to increase and decrease between these
27 3
ORN - Complex Spike 0.02
=
0.01
0+
-0 .01
-0 .02
-0.03
-0 .04
-0 .05
-0 .06 -0.002
h 0
I 0 .002
F 0.004
I 0 .006 Tlnw Non)
1 0.008
1 0 .01
f 0.012
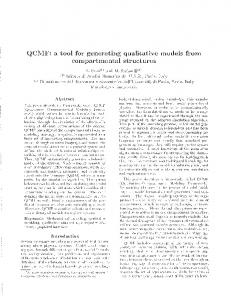
Figure 10. Complex spikes in response to climbing fiber input. This graph shows membrane potential at the soma over time. The model receives at? ascending volley of climbing fiber activity at time 0. The model shows the characteristic burst of activity associated with a complex spike. two landmarks. Tag 2 illustrates ESO increasing above the threshold landmark . This causes NaF channels to open resulting in a qualitative increase in the sodium parameter that in turn increases ESO. At tag 3, the NaF channels are closing while the Kdr channels are opening . This results in a qualitative increase in the potassium parameter that in turn decreases ESO . ESO transitions from increasing to decreasing . NaF channels transition to an inactive state. During the inactive state, no more action potentials can occur. At tag 4, ESO reaches the minimum landmark and remains steady . NaF channels transition from inactive to closed, while Kdr channels are slowly closing. During this relative refractory period, action potentials would be possible if enough excitation occurred to overcome the efflux of potassium. Finally, ESO increases signifying the end of the relative refractory period at tag 5. In order to display the output of QRN in a way more resembling membrane potential recordings, a display post-processor was developed. The post-processor replaces the qualitative values with analog values of the soma membrane potential that correspond to landmark transitions . Each of the five tags shown in Figure 9 represents a landmark transition . For example, between tags 1 and 2, the quali-
tative values are replaced with analog values corresponding to steady-state . The qualitative values between tags 2 and 3 are replaced with analog values representing the rising edge of an action potential. The time and the value of points replaced is dependent of the time and type of landmark transition in the QRN simulation . The chart on the right of Figure 9 shows the output of the post-processor . All subsequent figures that display membrane potential at the soma will use this method . Only the five landmark transitions shown in the figure are necessary for displaying simple spikes, complex spikes and the effects of inhibition . 3 Results All results reported in this section are based on experiments testing the two qualitative reasoning Purkinje cell models described in the Methods sec tion . Experiments were designed to test the models' responses to climbing fiber input, parallel fiber excitation with stellate cell inhibition, and basket cell inhibition . The execution time of the qualitative reasoning models is compared to the GENESIS Purkinje cell model (De Schutter and Bower 1994ab)
Model
Runtime for five second simulation
Genesis
464 minutes
QRN
189 minutes
SQRN (active spines)
138 minutes
SQRN (passive spines)
65 minutes
Table 2: Comparison of nintimes . The times represent the amount of computer time in minutes needed to complete a simulation of 250,000 time steps, or five second real time. All tests are run on a 75Mhz Pentium PC running LINUX. The PF activity is asynchronous at 25 Hz and the stellate inhibition is asynchronous at 1 Hz. 3.1 Response to Climbing Fiber Input Summation of parallel fiber inputs in the Purkinje cell dendritic tree results in a simple spike shown in Figure 9. Activation of a single climbing fiber input to the Purkinje cell results in a burst of activity called a complex spike. Figure 10 illustrates QRN's ability to model a complex spike in response to climbing fiber input. As was described in the methods section, the climbing fiber input is an ascending volley starting at the main dendrite and moving up the dendritic tree to the thick dendrites. Consequently, the level of calcium increases first at the main dendrites, then at the thick dendrites and finally at the spiny dendrites. These calcium spikes coupled with opening and closing of sodium and potassium channels in the soma result in a complex spike. A wide variety of other tests were run on the system, all producing results that either closely reproduced the GENESIS model or, in two minor cases, identified failures of the GENESIS model to produce physiologically reasonable results (probably due to a bug in GENESIS) . These results are published in detail elsewhere (Krichmar, Olds & Hunter, submitted) . 3.5 Comparison of Simulation Times The amount of computer time the four different Purkinje cell models needed to execute a simulation is shown in Table 2. The times reported are based on a 5 second simulation (250,000 time steps) with asynchronous parallel fiber input at 25 Hz and asynchronous stellate cell input at 1 Hz. QRN is approximately 2.5 times faster than the GENESIS model . The simplified QRN with active dendritic spine pro-
cessing is approximately 3 times faster than the GENESIS model. The simplified QRN with passive spines is approximately 7 times fasterthan the GENESIS model. All simulations were ran onthe same computer with the same number of time steps. 4 Discussion The results reported in this paper demonstrate that the use of the qualitative reasoning algorithm facilitates the creation of efficient models without sacrificing vital details. Specifically, QRN simulated detailed, qualitative interactions between the ions and channels found in the different compartments that make up a cerebellar Purkinje cell . Although dependent on qualitative parameters, the output of a QRN model is testable, accurate and quantitative . The complex spike time course, simple spike firing rates, interspike intervals and inhibition levels are all within physiological ranges . The nature of the QRN algorithm, that is, its lack of multiplication, division, exponential, and floating point arithmetic, allows it to be extremely efficient from a computational perspective. 4.1 Modeling Different Levels of Abstraction The qualitative reasoning modeling technique facilitates variable levels of abstraction within the same model . For example, the SQRN model had a very simple soma, which basically amounted to a summing junction, but had a highly detailed, active dendritic spine that simulated the sub-cellular processes involved in cerebellar LTD. This allows the modeler to focus the processing where it is most important and necessary. Passive cable equations in the dendritic tree were not simulated in QRN and SQRN . However, both models did simulate voltage gated calcium channels and calcium activated potassium channels . The importance of these active channels far outweigh the need for modeling passive cable equations and save valuable computer time. Qualitative reasoning does not emphasize precision. The exact measurement of membrane potential to "n" significant digits is not important. What QRN does stress is meaningful changes in the behavior of one or more parameters . The fact that the membrane potential decreases as sodium channels close and potassium channels open is an important detail that needs to be specified . 4.2 Ambiguity A limitation of Kuiper's QSIM (Kuipers, 1986) and qualitative reasoning in general is ambigu-
27 5
between parameters (Weld and de Kleer, 1990). QRN handles this limitation through the use of weights. Weights assign each parameter a relative importance in the system, so that all conflicting influences can be resolved. There are three complementary reasons that we can use such a simple scheme for handling ambiguity : natural homeostatic mechanisms in neurons, the availability of empirical values for these weights, and the relative insensitivity of the simulations to the precise their precise values . First, although physically it is possible for the various influences on neurons to lead to ambiguities in response, neurons have evolved so that they are relatively insensitive to most changes that could theoretically influence their state. This insensitivity is called homeostasis in living systems, and involves a wide variety of meeha s, such as active ion transport, cascading reactions, and the cytoarchitecture itself, all acting to keep the cell within a relatively narrow range of possible states . For example, it is possible that calcium ions will not flow through an open channels (say, due to unphysiologic concentrations) but this possibility can be safely ignored, since such a state is rare (and, if not extremely rare, then fatal!) Even the mechanisms of neural plasticity and learning are often used by organisms to compensate for changes in performance due to age, injury, and so on. Neurons are themselves not very sensitive to many kinds of changes in the state of the system . The weights we do use are based on physiological data . For example, a small section of the dendritic tree has thousands of calcium channels . One way to model this is to create thousands of calcium channel parameters . Our approach was to use a weight to represent the abundance of calcium channels in a compartment. Evidence suggests that there are more calcium channels in the dendrite than in the soma (Llinas et al ., 1992) . Therefore, the weight of calcium channels is greater in the dendrite than the soma . Finally, the behavior of the system is relatively insensitive to the exact values of the weights used . Most of our attempts to optimize the global per formance of the system (See section 2 .1) made no difference to system output . The SQRN model, which has all its weights set to unity, never exhibited anomalous global behavior . This insensitivity to the precise choices of weight values mirrors the homeostatic nature of the neuron itself. For example, stellate inhibition on the dendritic tree keeps the firing level of a Purkinje cell AN ,
within a restricted range (Llinas and Sugimori, 1992) . Basket cell inhibition, which synapses near the soma, has more of an impact on the output of the Purkinje cell than stellate inhibition, which synapses at the distal portion of the dendritic tree (see Figure 3 .13). 4.3 Conclusion The objective of this paper was to introduce QRN as a general purpose modeling tool for computational neuroscience . The QRN algorithm is effi cient and allows for scaling upward to detailed network models (Krichmar 1995). The primitive constraints, listed in the Methods section, can be used as building blocks to create other models of neural behavior with a minimal effort . 5 References Anastasio TJ, Robinson DA (1989) Distributed parallel processing in the vestibulo-ocular reflex . Neural Computation, 1 : 230-241 Bower JM, Beeman D (1994) The book of GENESIS .
Exploring realistic neural modeling with the GEneral NEural SImulation System.. Springer-
Verlag, New York Bush PC, Sejnowski TJ (1991) Simulations of a reconstructed cerebellar Purkinje cell based on simplified channel kinetics . Neural Computation, 3 : 321-332 Chapeau-Blondeau F, Chambet N (1995) Synapse models for neural networks : From ion channel kinetics to multiplicative coefficient wij . Neural Computation, 7 : 713-734 Churchland PS, Sejnowski TJ (1993) The Computational Brain. A Bradford Book, Massachusetts Institute of Technology Press, Cambridge, Massachusetts De Schutter E, Bower JM (1994a) An active membrane model of the cerebellar Purkinje cell 1. Simulation of current clamps in slice. Journal of Neurophysiology, Vol. 71 ., No. 1, pp 375-400 De Schutter E, Bower JM (1994b) An active membrane model of the cerebellar Purkinje cell II . Simulation of synaptic responses . Journal of Neurophysiology, Vol. 7l ., No. 1, pp 401-419 Edgley SA, Lidierth M (1987) The discharges of cerebellar Golgi cells during locomotion in the cat. Journal of Physiology (London), 392 : 315-322 Eilers J, Callewaert G, Armstrong C, Konnerth A (1995) Calcium signaling in a narrow somatic submembrane shell during activity in cerebellar Purkinje neurons . Proceeding of National Academy of Sciences, USA, Vol. 92, pp 10272-10276
Forbus KD (1984) Qualitative Process Theory. Artificial Intelligence 24: 85-168 Forbus KD, (1988) Qualitative Physics : Past, Present, and Future, In: Shrobe H (ed) Exploring Artificial Intelligence . Morgan Kaufmann Publishers, Inc. San Mateo, California, pp 239-296 Forsythe ID, Westbrook GL (1988) Slow excitatory postsynaptic currents mediated by N-methyl-Daspartate receptors on cultured mouse central neurones . Journal of Physiology (London) 396: 515-533 Hines B (1993) NEURON - A program for simulation of nerve equations, In: Eeckman F (ed) Neural systems: Analysis and modeling . Kluwer Academic Publishers . Norwell, Massachusetts, pp 127-136 Hille B (1992) Ionic Channels of Excitable Membranes, 2nd Ed. Sinauer Associates, Inc . Sunderland, Massachusetts Holmes WR, Levy WB (1990) Insights into associative long-term potentiation from computational models of NMDA receptor-mediated calcium in flux and intracellular calcium concentration changes. Journal of Neurophysiology, Vol . 63 : 1148-1168 Krichmar JL (1994) Qualitative reasoning in neural modeling: Hodgkin-Huxley squid axon revisited. In : Dagli CH, Fernandez BR, Ghosh J, Kumara RTS (eds) Intelligent Systems through Artificial Neural Networks, Vol. 4, ASME Press, New York, New York Krichmar JL (1995) A qualitative model of cerebellar plasticity that learns temporal patterns . Society for Neuroscience Abstracts, Vol . 21, Part 2, 363.8 Krichmar JL, Olds, JL & Hunter L (submitted) Qualitative Reasoning as a Modeling Tool for Computational Neuroscience . Proceedings of the National Academy of Sciences USA.
Kuipers, B (1986) Qualitative Simulation . Artificial Intelligence, 29 : 289-388 Lehky S, Sejnowski T (1990) Neural network model of visual cortex for determining surface curvature from images of shaded surfaces . Proceedings of Royal Society of London, B, 240 : 251-278 Linden DJ, Connor JA (1995) Long-term synaptic depression . Annual Review in Neuroscience, 18 : 318-357 Llinas RR (1981) Electrophysiology of the cerebellar networks . In: Handbook of physiology . The nervous system. Motor control. American Physiolo gy Society, Bethesda, MD, Sect . l, Vol . II, pp
831-876 Llinas RR, Nicholson C (1976) Reversal properties of climbing fiber potential in cat Purkinje cells : an example of a distributed synapse. Journal of Neurophysiology, 39 : 311-323 Llinas RR, Sugimori M (1980) Electrophysiological properties of in vitro Purkinje cell . somata in mammalian slices . Journal of Physiology (London), 305: 171-195 Llinas RR, Sugimori M (1992) The electrophysiolagy of the cerebellar Purkinje cell revisited. In : Llinas RR, Sotelo C (eds) The Cerebellum Revisited. Springer-Verlag, New York, New York Mitgaard J (1992) Membrane properties and synaptic responses of Golgi cells and stellate cells in the turtle cerebellum in vitro . Journal of Physiology (London), 457: 329-354 Nelson PG, Pun RYK, Westbrook GL (1986) Synaptic excitation in cultures of mouse spinal cord neurones : receptor pharmacology and behaviour of synaptic currents . Journal of Physiology (London), 372 : 169-190 Rall, W. (1964) Theoretical significance of dendritic trees for neuronal input-output relations . In: Reiss R (ed) Neural Theory and Modeling, Stanford University Press, Stanford, CA, pp 73-97 Rapp M, Yarom Y, Segev I (1992) The impact of parallel fiber background on the cable properties of cerebellar Purkinje cells. Neural Computation, 4: 518-533 Rapp M, Segev 1, Yarom Y (1994) Physiology, morphology and detailed passive models of cerebellar Purkinje cells. Journal of Physiology (London), 471 : 87-99 Ropert N, Miles R, Korn H (1990) Characteristics of miniature inhibitory postsynaptic currents in CAI pyramidal neurones of rat hippocampus . Journal of Physiology (London), 428 :707-722 Sato Y, Miura M, Fushiki H, Kawasaki T (1993) Barbiturate depresses simple spike activity in cerebellar Purkinje cells after climbing fiber input . Journal of Neurophysiology, Vol . 69, No. 4, pp 1082-1090 Segev, 1(1992) Single neurone models : over simple, complex and reduced. TINS, Vol . 15, No. l l, pp 414-421 Stein JF, Glickstein M (1992) Role of the cerebellum in visual guidance of movement . Physiological Reviews, Vol.72, No. 4, pp 967-1017 Weld DS, De Kleer J (1990) Readings in Qualitative Reasoning about Physical Systems. Morgan Kaufmann Publishers Inc ., San Mateo, California