Quality Assessment Metrics for Edge Detection and Edge-aware Filtering: A Tutorial Review Diana Sadykova, and Alex Pappachen James
arXiv:1801.00454v1 [cs.CV] 1 Jan 2018
School of Engineering Nazarbayev University, Astana Email:
[email protected];
[email protected]
Abstract—The quality assessment of edges in an image is an important topic as it helps to benchmark the performance of edge detectors, and edge-aware filters that are used in a wide range of image processing tasks. The most popular image quality metrics such as Mean squared error (MSE), Peak signal-tonoise ratio (PSNR) and Structural similarity (SSIM) metrics for assessing and justifying the quality of edges. However, they do not address the structural and functional accuracy of edges in images with a wide range of natural variabilities. In this review, we provide an overview of all the most relevant performance metrics that can be used to benchmark the quality performance of edges in images. We identify four major groups of metrics and also provide a critical insight into the evaluation protocol and governing equations. Index Terms—Edge preservation, image metrics, edge quality measures, edge detection, sobel filters, mean square error, PSNR, SSIM
I. I NTRODUCTION Edges in the images from the most basic visual cues for the identification and recognition objects. Application of conventional image filters results in blurring of the edges due to inhomogeneity in pixel intensity values. Various edge aware filters have been introduced as a promising solution, including anisotropic diffusion, bilateral filter, domain transform filter, guided filter, wavelet transform based filtering and G-neighbor classification filtering [1]–[5]. It is commonly accepted that efficiency of the filters is graded according to Mean squared error (MSE), Peak signal-to-noise ratio (PSNR) and Structural similarity index (SSIM) metrics [6]. However, these types of assessment orients only on overall image quality and therefore are not completely suitable for understanding the actual quality of edges. In this work, we provide a critical review of most promising edge-oriented metrics suitable for analysis and measurement of edge quality. There are two main groups of image quality assessment for edges: subjective and objective. Subjective evaluation can be represented by mean opinion score (MOS) or an average of human visual assessment. This type of the evaluation is considered to be more exact and accurate [7]. The second approach is applied compared with a set standards and utilization of an original or an ideal image. Objective techniques are divided into three categories: (1) full reference (FR), (2) reduced reference (RR) and (3) no reference (NR) evaluation. The FR evaluation results in a better performance, as the whole source of information is provided, however, this might
lead to vast data transmission. RR comparison can solve this problem, but regions of interests should be carefully selected [8]. The least used method is NR because it is entirely based on information from a distorted image [9]. Commonly used metrics are MSE, PSNR and SSIM. MSE is basically a weighted function of deviations in images, or square difference between compared images [10]. In Eq. 1, M and N stands for image size, while I1 (s, t) and I2 (s, t) for locations. M N 1 XX M SE = (I1 (i, j) − I2 (i, j))2 M N i=1 j=1
(1)
Another measure, which is strongly related to MSE is PSNR, defined by Eq. 2. It indicates the level of losses or signals integrity [11]. P SN R = 10log(
max(I)2 ) M SE
(2)
Although these measures are widely used, experimental results showed, that images with a different level of distortion might result in similar PSNR and MSE values [12]. SSIM is more closely related to the human visual system as it extracts useful information as luminance (l), contrast (c) and structure (s). It can be applied to evaluate structure preservation and noise removal [13].
SSIM = f unction(l(I1 , I2 ), c(I1 , I2 ), s(I1 , I2 ))
(3)
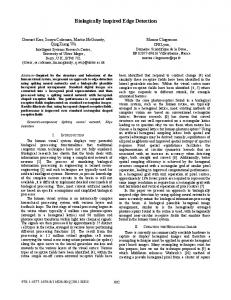
The main limitation of SSIM measure is inability to measure highly blurred images [14] successfully. All the three most common metrics MSE, PSNR, and SSIM, are limited in their use for benchmarking the performance of edge in the images. II. E DGE - AWARE PERFORMANCE METRICS Figure 1 shows the overview of the metrics that can be useful for benchmarking the performance of edge quality of objects in the images after edge detection or after applying an edge-aware filter. Overall, we can group the metrics into four distinct categories, i.e. that based on (a) Sobel filtering, (2) SSIM, (3) MSE and (4) Gaussian kernel functions.
• • • •
•
Merits: The main merits of using the EBIQA metric are: Application of Sobel filter considered to be time efficient, effective and simple. Provides better performance than PSNR and SSIM in FR evaluation. Assessment of edge similarity showed results similar to MOS i.e. had a good response to image degradation. Might be further utilized for RR or NR. Demerits: The need to have large data transmission .
B. Sobel-based reduced reference evaluation
Fig. 1.
Overview of edge based IQA
A. EBIQA: Edge based image quality assessment Edge preservation one of the most important aspect during the human visual assessment. Attar, Shahbahrami, and Rad proposed EBIQA technique that aims to operate on the human perception of the features [15]. The metric consists of the four major steps, where original and distorted images are compared: 1) Edges locations are identified utilizing Sobel edge detector technique in both images. 2) The 16 × 16 pixel window size vectors are formed at each image based on Eq.4 and Eq. 5, where I1 is reference image and I2 is the image under test [16]. I1 = (O, AL, P L, N, V HO)
(4)
I2 = (O, AL, P L, N, V HO)
(5)
Here, each vector uses information about five edge oriented characteristics: • ’O’ stands for edge orientation in the image, which is a total number of edges. • ’AL’ or value of the average length of all edges. • ’PL’ estimates the number of pixels with a similar level of intensity values. • ’N’ responds for sum of pixels, which form edges. • ’VH’ corresponds for sum of pixels, which form edges in either vertically or horizontally located edges. Note that initially in 2011 authors proposed only four edge related features for vector creation, but later in 2016 one more criterion was included for better performance, which is ’VH’ [16]. 3) Finally, we estimate EBIQA by Eq. 6, where average Euclidean distance of proposed vectors is estimated. EBIQA =
M N 1 XXp (I1 − I2 )2 M N i=1 j=1
(6)
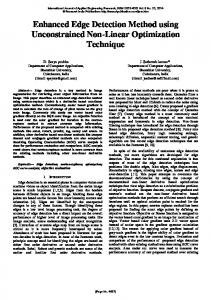
The work which was done by Martini et. al [17] also draws upon the estimation of change in edge-based features. Similar to EBIQA Sobel filtering is applied for edge identification [15]. In this filter, weighted pixel difference equation is applied for 3×3 windows, and then the pixel is considered to be an edge if it is bigger than a given threshold. The overall algorithm for the implementation includes: 1) The image is sub-sampled to have 16×16 blocks. 2) Then a selection of 12 out of all blocks is done using region of interest with centered symmetry as it is illustrated in Fig.2.
Fig. 2.
Example of 12 blocks considered for RR evaluation
3) Sobel filter is applied separately to each of the selected block, rather than to the full image as in the case of EBIQA. 4) Number of edges evaluated by low pass filtering edges by application of thresholds, referred as t1 and t2 . Then the proposed parameter is estimated using Eq. 7, where w1 ,w2 are constant and M × N represent the total number of pixels. I=
MN 1 X w1 t1 + w2 t1,2 M N i=1 MN
(7)
Merits: The main merits of using the Sobel based metric, they are: • Application of Sobel filter is considered to be time efficient, effective and simple. • Provides better performance using RR, than PSNR and MSSIM in FR evaluation. • The implementation of equations requires only simplistic estimations. • This metric can be used for real-time estimations.
Demerits: There are however some limitations of using the Sobel based metric, they are: • Block size for each image should be separately regulated. • Threshold selection can be inappropriate and requires careful processing. • Transmission operation is time-consuming. C. ESSIM: Edge based structural similarity The IQA technique proposed by Chen et al. is the edge oriented version of SSIM metric. Mainly, the structural similarity components in Eq. 3 is substituted by edge similarity component, see Eq. 8 [14]. ESSIM = f unction(l(I1 , I2 ), c(I1 , I2 ), e(I1 , I2 ))
(8)
The following steps do the computation of this metric: 1) Vertical and Horizontal maps are created by the use of Sobel operator. 2) Image is sub-sampled to 16×16 blocks. 3) Histogram of edge direction is created according to the sum of amplitudes with similar (1/8) directions. 4) Using standard deviations of obtained histograms the edge factor is calculated in Eq. 9. e(I1 , I2 ) =
σI1I2 + c3 σI1 σI2 + c3
Merits: • Application of wavelet transform is shown to produce accurate results. • Provides better performance than PSNR and SSIM in FR and RR evaluation. Demerits: • The need to have large transmission data is the main limitation of using this metric. Note, maximum modular similarity requires a higher level of scaling. E. NSER: Non-shift edge based ratio This method is based on zero-crossings and was proposed by Zhang, Mou and Zhang [20], [21]. It makes decisions upon edge maps. It can be noted that this method combines some of the steps of previously mentioned metrics. The main stages for calculation of the metric are: 1) Gaussian kernel is applied to the interesting images on different standard deviation scales to identify edges. 2) Then operation is performed between two images. Ratio of the common edge number located by initial edge number is found using Eq. 10:
(9)
Merits: The main advantages of using the ESSIM metric are: Application of Sobel filter is considered to be time efficient, effective and simple. • Provides better performance than PSNR and SSIM in FR evaluation. • Assessment of edge similarity showed results similar to MOS i.e. had a good response to image degradation. Demerits: The limitations of ESSIM metric are: • Prediction sequence sometimes shows poor output. • Efficiency depends on noise type applied. • Requires careful optimization of parameters. Note, that in 2008 Cui and Allen in their work presented three SSIM measures, based on corner, edge, and symmetry. The ESSIM demonstrated the best performance among all of them [18]. Also, it can be noticed, that first two steps of this metric are similar to the EBIQA, only the mathematical approaches are different when it comes to implementation.
pi = ||I1 ∩ I2 ||/||I1 ||
3) The result of this operation is normalized by log function to improve correlation factor:
•
D. MS-SSIM: Multi scale structural similarity Another approach suggested by Zhai et.al also uses SSIM metric as a foundation [19]. The difference is that the dyadic wavelet transform is used instead of Sobel filtering. The main steps of the metric calculation are: 1) The image is scaled using dyadic wavelet transform in vertical and horizontal directions. 2) Then the edge ’distance’ and ’angle’ are estimated similar to the ESSIM. 3) Modular similarity and maximum modular similarity are estimated.
(10)
N SER(I1 , I2 ) = −
N X
log10 (1 − pi )
(11)
i=1
• •
• • •
Merits: Provides similar performance as MS-SSIM in FR evaluation. The metric is simplistic and easy to implement for realtime applications. Demerits: This metric is not suitable for images having high levels distortion. Efficiency varies from one database to another. Suitable normalization will be required to ensure robustness.
F. GCMSE: Gradient conduction mean square error Lopez-Randulfe et al. in their paper introduced an edgeaware metric based on MSE [12]. In this algorithm weighted sum of gradients (distance pixels) is taken into account. The main steps for calculating the metric are: 1) Directional gradients are estimated in four directions using Eq. 12 and then average value Gp is found. Note that the results are optimized by the coefficient k: G=
(I2 − I1 )2 (I2 − I1 )2 + k 2
2) The GCMSE is estimated based on Eq. 13:
(12)
Pm Pn GCM SE =
x=1
2
y=1 [(I2 (x, y) − I1 (x, y))Gp ] Pm Pn C1 + x=1 y=1 Gp
(13) • •
• • •
Merits: Provides better performance than MSE and SSIM in FR evaluation The measure is straightforward and easy to implement. Demerits: The parameters require careful optimization. Multiple tests on a different set of databases are required to ensure robustness of results. Needs normalization according to the size of the image used. III. C ONCLUSION
In this review paper, we presented the set of image quality metrics that are useful for the assessment of the quality of edges in images. These measures can be used to detect the robustness of edge detectors and edge-aware filters under noisy conditions. We do note that a single measure to assess the quality of edges is not sufficient to ensure the accuracy of the quality assessments and interpretations. Every metric has its limitations and challenges, making it necessary to use a multitude of measures specific to a given application and condition. Further, it has been observed that substantially all six mentioned metrics tend to provide results closer to human visual assessment than traditionally obtained ones using PSNR and SSIM. R EFERENCES [1] Paras Jain and Vipin Tyagi. A survey of edge-preserving image denoising methods. Information Systems Frontiers, 18(1):159–170, 2016. [2] Pietro Perona and Jitendra Malik. Scale-space and edge detection using anisotropic diffusion. IEEE Transactions on pattern analysis and machine intelligence, 12(7):629–639, 1990. [3] Michael Elad. On the origin of the bilateral filter and ways to improve it. IEEE Transactions on image processing, 11(10):1141–1151, 2002. [4] Li Xu, Cewu Lu, Yi Xu, and Jiaya Jia. Image smoothing via l 0 gradient minimization. In ACM Transactions on Graphics (TOG), volume 30, page 174. ACM, 2011. [5] Terrance E Boult, Robert A Melter, Frank Skorina, and Ivan Stojmenovic. G-neighbors. In Optical Tools for Manufacturing and Advanced Automation, pages 96–109. International Society for Optics and Photonics, 1993. [6] Amira Hadj Fredj, Jihene Malek, et al. Fast oriented anisotropic diffusion filter. In Design & Test Symposium (IDT), 2016 11th International, pages 308–312. IEEE, 2016. [7] Fan Zhang and Yuli Xu. Image quality evaluation based on human visual perception. In Control and Decision Conference, 2009. CCDC’09. Chinese, pages 1487–1490. IEEE, 2009. [8] Mathieu Carnec, Patrick Le Callet, and Dominique Barba. An image quality assessment method based on perception of structural information. In Image Processing, 2003. ICIP 2003. Proceedings. 2003 International Conference on, volume 3, pages III–185. IEEE, 2003. [9] Zehua Lan, Yu Li, and Xingang Liu. A novel image quality assessment method based on vision attention. In Computer and Information Technology; Ubiquitous Computing and Communications; Dependable, Autonomic and Secure Computing; Pervasive Intelligence and Computing (CIT/IUCC/DASC/PICOM), 2015 IEEE International Conference on, pages 2123–2129. IEEE, 2015.
[10] Quan Huynh-Thu and Mohammed Ghanbari. Scope of validity of psnr in image/video quality assessment. Electronics letters, 44(13):800–801, 2008. [11] Zhou Wang, Alan C Bovik, Hamid R Sheikh, and Eero P Simoncelli. Image quality assessment: from error visibility to structural similarity. IEEE transactions on image processing, 13(4):600–612, 2004. [12] Javier L´opez-Randulfe, C´esar Veiga, Juan J Rodr´ıguez-Andina, and Jos´e Fari˜na. A quantitative method for selecting denoising filters, based on a new edge-sensitive metric. In Industrial Technology (ICIT), 2017 IEEE International Conference on, pages 974–979. IEEE, 2017. [13] Sameeulla Khan Md and Sumohana S Channappayya. Multiscale-ssim index based stereoscopic image quality assessment. In Communication (NCC), 2016 Twenty Second National Conference on, pages 1–5. IEEE, 2016. [14] Guan-Hao Chen, Chun-Ling Yang, Lai-Man Po, and Sheng-Li Xie. Edge-based structural similarity for image quality assessment. In Acoustics, Speech and Signal Processing, 2006. ICASSP 2006 Proceedings. 2006 IEEE International Conference on, volume 2, pages II–II. IEEE, 2006. [15] Abdolrahman Attar, Reza Moradi Rad, and Asadollah Shahbahrami. Ebiqa: An edge based image quality assessment. In Machine Vision and Image Processing (MVIP), 2011 7th Iranian, pages 1–4. IEEE, 2011. [16] Abdolrahman Attar, Asadollah Shahbahrami, and Reza Moradi Rad. Image quality assessment using edge based features. Multimedia Tools and Applications, 75(12):7407–7422, 2016. [17] Maria G Martini, Chaminda TER Hewage, and Barbara Villarini. Image quality assessment based on edge preservation. Signal Processing: Image Communication, 27(8):875–882, 2012. [18] Li Cui and Alastair R Allen. An image quality metric based on corner, edge and symmetry maps. In BMVC, pages 1–10, 2008. [19] Guangtao Zhai, Wenjun Zhang, Xiaokang Yang, and Yi Xu. Image quality assessment metrics based on multi-scale edge presentation. In Signal Processing Systems Design and Implementation, 2005. IEEE Workshop on, pages 331–336. IEEE, 2005. [20] Min Zhang, Xuanqin Mou, and Lei Zhang. Non-shift edge based ratio (nser): an image quality assessment metric based on early vision features. IEEE Signal Processing Letters, 18(5):315–318, 2011. [21] Xuanqin Mou, Min Zhang, Wufeng Xue, and Lei Zhang. Image quality assessment based on edge. In Digital Photography, page 78760N, 2011.