called MoST (Modelling Support Tool; see further Section 2.2 below) to ... upper right window enables monitoring of the activities performed within the task, ...
QUALITY ASSURANCE SUPPORT TOOL FOR CATCHMENT-BASED MODELLING: A TEST ON THE HBV-NP MODEL FOR EUTROPHICATION ASSESSMENT J. Olsson* , H. Scholten** , B. Arheimer* and L. Andersson*
*
FoUh, Swedish Meteorological and Hydrological Institute (SMHI), 601 76 Norrköping, Sweden Applied Computer Science Group, Wageningen University, Dreijenplein 2, 6703 HB Wageningen, the Netherlands **
ABSTRACT HarmoniQuA is an EU-project aiming at developing a methodological component of an infrastructure for modelling in water management according to the Water Framework Directive. The two major outputs are (1) a harmonised, generic methodology with guidelines for good modelling practice and (2) a web-based toolbox (MoST) for quality assurance support. To test the guidelines and the toolbox, they were applied during scenario analyses of nutrient transport in a pilot catchment in southern Sweden, using the recently developed HBV-NP model. HBV-NP is based on the hydrological HBV model, equipped with routines for N and P transport and transformation. Scenarios included business as usual, sector-specific measures and costeffective solutions. Results indicated that national goal of P reduction may be reached with widespread single measures, but N reduction requires combination of measures. Overall, the MoST tool performed well in providing guidance for the modelling and enabling detailed monitoring of the process. Some deficiencies were however identified which will be considered in the upgrade of MoST to its final version.
KEYWORDS
Catchment modelling; eutrophication; HarmoniQuA; HBV-NP; quality assurance
1. INTRODUCTION Mathematical models have been applied for several decades in solving problems in many domains of water management. With the requirements imposed by the EU Water Framework Directive the trend to base water management decisions to a larger extent on model studies and to use more sophisticated models is likely to be reinforced. At the same time insufficient attention is generally given to documenting the predictive capability of the models. In the last decade a growing need for Quality Assurance (QA) has emerged among professionals in this field (Refsgaard, 2002), and the need for improving the quality of the modelling process has regularly been emphasised by the research community (e.g. Klemes, 1986; Rykiel, 1996). The recommendations made in this respect mostly focus on scientific/technical guidance in how the modeller should carry out the various steps of the modelling work in order to achieve the best and most reliable results. Some modelling guidelines do exist, but these focus on a single domain in contrast to integrated models and furthermore they vary throughout Europe. The resulting models and decisions based on them are often non-transparent, irreproducible, non-auditable and not fully comparable among different countries. To improve the QA situation, the EU-project HarmoniQuA started in 2002. The two major outputs from HarmoniQuA are (1) a harmonised, generic methodology with associated guidelines for good modelling practice and (2) a web-based toolbox to support the model user and the water manager throughout the QA process. It is expected that both of these novel outputs can contribute significantly towards improving the quality of modelling and harmonisation of river basin management practices throughout Europe.
An urgent water-related problem within which catchment-based modelling plays a crucial part is that of eutrophication. Eutrophication of inland and coastal waters is a world-wide environmental problem and serious efforts are needed to reduce emissions and improve the situation (e.g., Ryding and Rast, 1989). The effect of eutrophication is high production of plankton algae, excessive growth of weeds and macroalgae, leading to oxygen deficiency, which in turn may lead to fish kills, reduced biological diversity and bottom death. The prevailing opinion is that the eutrophication problem is caused by high nitrogen (N) and phosphorus (P) loads (e.g., Rosenberg et al., 1990). In Sweden, the first measures against eutrophication were introduced in the 1960s and mainly targeted the point-source emissions of nutrients (phosphorus point sources have been reduced successfully). The important task now is to reduce the discharges from diffuse sources. Although measures have been undertaken to reduce the agricultural leaching during the past two decades (Johnsson and Hoffmann, 1998), their net influence on the large-scale transport from the agricultural sector is quite small (Arheimer and Brandt, 2000). To achieve more efficient reduction of nutrient concentrations in the Swedish fresh-water system, new policies including catchment-based management plans for farmers have been suggested (Swedish Environmental Ministry, 1997). However, catchment-based solutions of nutrient problems demand catchment-based knowledge of nutrient transport processes, and for this purpose the catchment-scale nutrient transport model HBV-NP has been developed at SMHI. It is based on the hydrological HBV model, which has successively been equipped with routines for N and P transport (see further Section 3 below). The objective of the present paper is to provide an overview of the HarmoniQuA project and specifically to demonstrate the functionality of the QA tools by applying them during HBV-NP scenario analyses. The paper includes a general description of the HBV-NP model as well as a summary of the scenario analyses results.
2. HARMONIQUA HarmoniQuA is a 4 year project (2002-2005) spending 2.57 million Euro, of which 1.65 million Euro is financed by the EC (contract EVK1-CT2001-00097). The HarmoniQuA project has 12 partners in 10 European countries. 2.1 Work packages The work in the HarmoniQuA project is divided into four Work Packages (WP). WP1. Development of a scientifically based methodology as a base for specific guidelines for the modelling process. Starting with existing knowledge on modelling methodologies and guidelines (Refsgaard, 2002), in subsequent steps this knowledge is completed and improved as input for the HarmoniQuA Knowledge Base (KB). This methodology has been transformed into guidelines for seven specific domains of water-related modelling. WP2. Organisation of modelling knowledge in a structured KB and development of a supporting software called MoST (Modelling Support Tool; see further Section 2.2 below) to provide functionality. MoST will support modellers and water managers throughout the QA process. The KB has been developed by decomposing the modelling process into an idealised "flow-chart" consisting of five main steps (Purpose and conditions, Conceptualisation, Model set-up, Calibration and validation, Prediction), each containing a number of concrete tasks, each containing a number of even more concrete activities. WP3. Testing of the KB and MoST on a large number of test cases covering a range of regimes and management conditions both for single domain and multi-domains/integrated models (see further Section 2.3 below). WP4. Dissemination of the HarmoniQuA results to users in the academic education sector, the water managers and model users and other interested stakeholders. This will be achieved through producing education material, brochures, posters, web-based information and by organising several workshops targeted at different stakeholders.
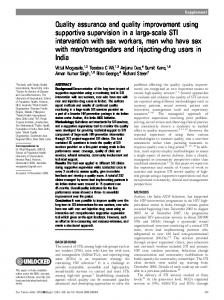
2.2 MoST The HarmoniQuA toolbox MoST for support of model based water management integrates four main functions. 1. Guidance. This component explains what each user (water manager, modeller, auditor, stakeholder, public) should do at each stage of the modelling process. It provides dedicated guidance for types of users, domains, job complexity and application according to the specified profile. Users can browse in three different views (tree view, flowchart view, task view) through the guidelines and use hyperlinks to glossary terms. 2. Monitoring. This functionality includes many features of workflow management systems, not for general business processes, but for all tasks of the modelling process and the associated activities. It keeps track of both what has been done and what has to be done. It functions not only as a checklist, but it records many details of selections, decisions and (intermediate) results in so-called model journals. A set of model journals forms a modelling archive, which allows proper organisation of all files of model studies. 3. Reporting. This feature will enable generating all kind of report styles for different types of audiences, completely controllable by the user by selecting relevant information from the model journals. 4. Advise. In a later stage MoST will be equipped with an advisory component to derive advise from previous model studies, which are stored in a model archive, to provide tailor-made assistance on how to perform a particular type of model study. To make the description of MoST more concrete, the layout of the monitoring view is shown in Figure 1.
Figure 1. MoST monitoring view. The left window shows the idealised modelling flow-chart as a list of tasks and the lower right window gives the detailed guidance information for the selected task. When selecting a task in the left window list, the upper right window enables monitoring of the activities performed within the task, including the time spent
as well as possibilities to attach files or other documents. In the guidance view of MoST, the left and bottom right windows are essentially identical to the monitoring view. The upper right window of the guidance view, however, shows a detailed view of the selected task and surrounding tasks, including loops from "decision tasks" (represented by blue rhombi in the left window of Figure 1) to earlier tasks.
3. TESTING MoST ON HBV-NP Within HarmoniQuA WP3, two rounds of case studies are carried out in order to test the KB and MoST. The aim of this testing is to verify both the technical functionality of the software as well as its applicability, relevance and user-friendliness in an actual modelling situation. Feedback from the team of testers, which covers a range of water-related disciplines, is used to improve the tools and ensure their practicability. At SMHI, the first round of testing was performed on modelling studies involving the hydrological HBV rainfall-runoff model. One case comprised a rather standard short consultancy job, where the HBV model was set up and run for an ungauged catchment, using model parameters obtained from regional calibration. Another more research-oriented case involved evaluating whether rainfall measured by weather radar could improve the accuracy of runoff simulation, as compared with rain gauge data. Finally, MoST was tested during scenario analyses of the recently developed HBV-NP model for nutrient transport, which is described in the following. 3.1 The HBV-NP model The HBV-NP simulates nitrogen (N) and phosphorus (P) transport and transformation at the catchment scale. The main objectives of the model are to estimate transport, retention and source apportionment, to separate human impact from anthropogenic, and to evaluate climate and management scenarios. It is based on the hydrological HBV model (Bergström, 1976; Lindström et al., 1997), which includes routines for snow accumulation and melt, accounting of soil moisture, groundwater and runoff response in a response box, and finally lakes and routing. The HBV model has gradually been equipped with a N submodel (Bergström et al. 1987; Brandt 1990; Arheimer and Brandt, 1998). The P routine has recently been developed within the Swedish Water Management Research Programme, VASTRA (http://www.vastra.org/). The nutrient fractions modelled are dissolved inorganic nitrogen (IN), dissolved organic nitrogen (ON), particulate phosphorus (PP), and soluble reactive phosphorus (SRP). HBV-NP is a dynamic mass-balance model, which is run at a daily time-step, including all sources in the catchment coupled to the water balance d (cV ) = ∑ {cinVin } + S − Φ − cVout dt
where c denotes concentration of nutrient fraction; V water volume of groundwater, river or active part of lake; in inflow (for groundwater: soil leakage from various land uses through micropores and macropores separately for P; for river: generated runoff, surface flow; for lakes/wetlands: upstream rivers and local discharge, precipitation on the surface); out outflow to river, lake or downstream subbasin, evaporation; S atmospheric deposition on water surfaces, emissions from point sources or rural households; and Φ retention (removal or release). Model applications involves dividing the catchment into several coupled sub-catchments for which the calculations are made, and this division governs the spatial distribution of the model results. The model includes a number of free parameters, which are calibrated against observed time-series of river discharge and riverine nutrient concentrations. For large-scale catchment applications, the calibration procedure is made step-wise for surface runoff, tile drains and groundwater, rivers and lakes, with simultaneous consideration to several monitoring sites in a region. Simultaneous calibration of water balance and nutrient concentrations may be performed. Submodels have been independently verified against N measurements in
soils and forests (e.g., Bergström et al., 1987; Brandt, 1990) and in forests and against P measurements in small agricultural catchments (Andersson et al., 2002). In the nutrient submodel, different soil leaching concentrations are applied to water originating from different combinations of land use and soils. The arable land may be further divided into a variety of crops and management practices (e.g. fertiliser used), for which the nutrient leaching is estimated by using fieldscale models such as SOILN (Johnsson et al., 1987) or ICECREAM (Tattari et al., 2001). For P, soil leaching is divided into micropore and macropore flow, each with its typical concentration and fraction of the total flow, with possible seasonal variation. For P, also soil surface erosion and surface runoff is considered, using a GIS-based model component. In addition to the diffuse soil-leaching, nutrient load is also added from point sources, such as rural households, industries, and wastewater treatment plants. Atmospheric deposition is added to lake surfaces, while deposition on land is implicitly included in the soilleaching. The model simulates residence, transformation and transport of N and P in groundwater, rivers, wetlands and lakes. The equations governing the nutrient turnover processes are mainly based on empirical relations between physical parameters and concentration dynamics. In groundwater, production and degradation of organic N is calculated in addition to retention of inorganic N. The model considers that stream bank erosion as well as sedimentation and resuspension processes in the rivers may have an impact on the PP river load and further SRP in rivers is exchanged with sediment. IN may have retention in rivers and ON production or retention depending on season. In a wetland, IN is retained, while total P can have a net retention or production depending on which of the processes sedimentation and uptake that dominates. Only lakes at the outlet of a subbasin or in the main river course have transformation of nutrients. IN and PP have only positive retention (i.e., denitrification and sedimentation), whereas ON and SRP may have positive or negative retention. All lake processes except sedimentation depend on temperature. 3.2 Test set-up and implementation The application of MoST involved the guidance and monitoring functionalities, described in Section 2.2. In the test, MoST was to the extent possible used in parallel with the actual activities, as in a real-world situation, although some activities had to be "reconstructed" owing to the limited time available for the testing. The actual HBV-NP application used in the testing comprised scenario analyses in a pilot catchment located in southern Sweden. The model was used to estimate the accumulated potential for measures when implemented wherever possible and at a maximum level. For all results, the natural background load was removed so that only anthropogenic load was considered, in correspondence with the definition of the Swedish environmental goals. Different scenarios for combatment strategies were defined and the overall integrated effect when combining several measures were analysed for the load to the sea by using the catchment model. Four scenarios were analysed. 1. Business as usual. This scenario is based on the past/present reduction strategy with focus on improved treatment at waste-water treatments plants, sludge separation and infiltration for all rural households, and construction of some agricultural wetlands. 2. Diffuse sources. This scenario includes only diffuse sources: urea and sludge separation with infiltration for all rural households, the most radical adaptation of arable land, construction of buffer zones where such are not present, and constructions of wetlands on 2% of the arable land. 3. Equality. According to the "polluter-pays-principle" it can be argued that the reduction goal should be equally distributed among polluting sectors in the catchment. In this scenario each sector should reduce their load by 20% for P and 30% for N. The cheapest measures were considered first and then the more expensive, until the goal was met within each sector. 4. Cost effectiveness. According to the WFD, measure plans should be based on the most cost-effective combatment strategies. This scenario was constructed to include the cheapest measures with highest potential and, moreover, the measures were located to areas were they were assumed to be most effective.
In practice, using MoST means going through the idealised modelling flow-chart step by step and task by task, and for each of these interpret the available guidance information in terms of the actual project at hand. For scenario analyses with the HBV-NP model, the five steps of the idealised flow-chart essentially correspond to the following activities. 1. Purpose and conditions. This step in MoST is mainly devoted to preparatory activities, tendering and manager-modeller negotiations. The outcome is a so-called model study plan specifying the technical and financial conditions of the modelling job. The step is generally not relevant for research-oriented projects, such as the present scenario analyses, and was therefore not considered in the testing. 2. Conceptualisation. The objective of this step is mainly to construct a conceptual model, in light of the problem to be solved and the available data. In MoST this includes e.g. identifying and describing the relevant processes, surveying and processing available data, and defining the model structure and parameterisation. In the present application, however, an existing model (HBV-NP) was used and there was no need to build a new conceptual model. Thus a large part of this step could be skipped. The step, however, also contains some assessments of data required for the following (e.g., model calibration) which had to be considered in the testing. 3. Model set-up. In this step the selected model is set up for the catchment under study. In our case this meant setting up HBV-NP for the pilot catchment, which includes e.g. defining sub-catchment, their characteristics in terms of altitude, land uses, etc., and how they are coupled. For the nutrient submodel, leakage concentrations for different land uses as well as point source contributions are specified. Relevant stations with observations on rainfall, runoff and nutrient concentrations are identified and the corresponding data retrieved and processed. After the set-up test runs are requested by MoST to verify that the model code executes properly. This step also contains selection of performance criteria. For HBV runoff this is generally R² and volume error, whereas for the nutrients performance is generally judged by visual comparison of concentration levels and dynamics. 4. Calibration and validation. As mentioned above (Section 3.1) the HBV-NP model contains a number of free parameters that require calibration to fit observations. In this step MoST provides guidance on the parameter optimisation process, which in HBV-NP may be carried out using an automatic calibration routine (e.g., Lindström, 1997). In the scenario analyses, calibration of runoff was done automatically whereas the nutrient-related parameters were adjusted manually. The calibrated model should be subjected to validation using an independent data set, and in the present case this was achieved using both independent time periods (runoff) and independent observation stations (runoff and nutrients). For both calibration and validation, MoST contains tasks in which the modeller is requested to assess the "soundness" of the results, not only in terms of numerical values but based on professional judgement and sound reasoning. This is of particular importance in comprehensive model applications such as the present, where input from widely varying sources (e.g., different measurement devices, other models, maps of land use and soil type, local (point source) data bases) interact through complex relationships and transparency easily gets lost. Also an uncertainty analysis is requested in MoST, as is an assessment concerning whether the (calibrated and validated) model fulfils the requirements for the final predictive simulations. For HBV-NP this is achieved by statistical analyses of different parameter combinations. 5. Prediction. The final step in our case corresponds to the actual scenario runs. The different scenarios were implemented by modifications in the HBV-NP model set-up files corresponding to e.g. leakage concentrations and point sources, and subsequent model runs. MoST includes checks for erroneous or unexpected results as well as guidance on description and interpretation of the results. As in the previous step, tasks dealing specifically with the results' soundness and uncertainty are included. Concerning uncertainty of the HBV-NP scenarios, this is assessed e.g. by using different resolutions in the model structure (i.e. different sub-catchment division) and using geographical information from different sources. Concerning the results of the scenario analyses, it turned out that no single measure would make it possible to reach the Swedish goal of 30% N reduction. For P, the 20% reduction goal would be reached with full implementation of constructed wetlands on arable land, wherever technically possible (on 2% of the arable land). As expected, the results from the first scenario indicated that the past/present strategy for nutrient control in Sweden will not reach the N goal, but if all rural households are equipped with improved treatment systems (sludge separation and infiltration) the P goal reduction would be reached. The scenario in
which the reduction goal was equally distributed among polluters resulted in successful achievement of the goal for all sectors but the industrial, for which the N goal was not possible to fulfil. Several scenarios were constructed and explored by modelling in order to find the most cost-effective alternative to reach the nutrient reduction goal. The final scenario only cost around 4.4 million Euro per year, which is about 20% of the other strategies that reached the goal. However, the P reduction in this scenario is much dependent on the estimation of P reduction in wetlands, which is known to vary widely.
4. RESULTS AND CONCLUSIONS The testing of MoST for the HBV-NP scenario analyses overall verified the intended functionality of the software. The guidance information proved generally useful and overall the idealised flow-chart well corresponded to the way the HBV-NP model is generally used. The tool is likely most useful for inexperienced modellers, but may be beneficial also for experienced modellers, e.g. when applying a new model or when facing a new type of modelling problem. The guidance also functions as a checklist, making sure that no necessary step is missed, something that may happen even experienced modellers, especially when being under time pressure. In our view, however, probably the most attractive and useful feature of MoST was the monitoring tool. To be able to systematically document each activity of a project, and thus if required "reconstruct" it afterwards, is extremely valuable not only for the purpose of formal auditing but also for "quality management" by the project responsible. The model journal created by the monitoring tool is very efficient for getting a quick overview of the project. Some aspects of the KB and MoST were found somewhat unsatisfactory. One criticism concerned the high level of detail required also for rather basic and/or routine jobs, involving an existing and well-known model. The need to go through several irrelevant and sometimes overlapping tasks made the application laborious and overly time-consuming. The guidance text was sometimes found unclear and complicated. Concerning the specific HBV-NP application, the flow-chart did not satisfactorily encompass all aspects of scenario construction and evaluation. Essentially, considerations about how to implement scenarios in the model appeared too late in the process. It must however be emphasised that testing was performed using version 1.0 of both KB and software, intended to be modified and upgraded after the response of the testers. This work is ongoing and starting autumn 2004 the new version will be subjected to a second round of testing. We conclude that the Modelling Support Tool MoST developed within the HarmoniQuA EU-project is a potentially powerful aid for quality assurance in water-related, catchment-based modelling. Its guidance functionality is useful to achieve "sound modelling". In particular the possibility to systematically monitor the progress and decisions of modelling projects, in light of the given guidance, is an important step towards improved quality assurance. The first version of the knowledge base contained some weaknesses that will be solved in future versions.
REFERENCES Andersson L., Persson K. and Hellström M. (2002). A nested model approach for phosphorus load simulation in catchments: HBV-P. In: Proc. XXII Nordic Hydrological Conference, Röros, Norway, 47 August, pp. 229-238. Arheimer B. and Brandt M. (1998). Modelling nitrogen transport and retention in the catchments of Southern Sweden. Ambio, 27, 471-480. Arheimer B. and Brandt M. (2000). Watershed modelling of non-point nitrogen losses from arable land to the Swedish coast in 1985 and 1994. Ecol. Eng., 14, 389-404. Bergström S. (1976). Development and application of a conceptual runoff model for Scandinavian catchments, Reports Hydrology and Oceanography, Nr. 7, Swedish Meteorological and Hydrological Institute, Sweden. Bergström S., Brandt M. and Gustafson A. (1987). Simulation of runoff and nitrogen leaching from two fields in Southern Sweden. Hydrol. Sci. J., 32, 191-205.
Brandt M. (1990). Modelling nitrogen transport from a basin of mixed land use. Example from the Lake Ringsjön drainage area, Sweden. Vannet i Norden, 23, 39-57. Johnsson H. and Hoffman M. (1998). Nitrogen leaching and gross load of nitrogen from arable land in Sweden in 1985 and 1994. Ambio, 27, 481-487. Johnsson H., Bergström L. and Jansson P.-E. (1987). Simulated nitrogen dynamics and losses in a layered agricultural soil. Agriculture, Ecosystems and Environment, 18, 333-356. Klemes V. (1986). Operational testing of hydrological simulation models. Hydrol. Sci. J., 31, 13-24. Lindström G. (1997). A simple automatic calibration routine for the HBV Model. Nordic Hydrol., 28, 153168. Lindström G., Johansson B., Persson M., Gardelin M. and Bergström S. (1997). Development and test of the distributed HBV-96 hydrological model. J. Hydrol., 201, 272-288. Refsgaard J. C. (ed.) (2002). State-of-the-art report on quality assurance in modelling related to river basin management, HarmoniQuA Report, D-WP1-1, Copenhagen, Denmark. Rosenberg R., Elmgren R., Fleischer S., Jonsson P., Persson G. and Dahlin H. (1990). Marine eutrophication case studies in Sweden. Ambio, 19, 102-108. Ryding S.-O. and Rast W. (eds.) (1989). The control of eutrophication of lakes and reservoirs, Man and the Biosphere Series, Vol 1., UNESCO and The Parthenon Publishing Group. Rykiel E. R. (1996). Testing ecological models: the meaning of validation. Ecol. Modelling, 90, 229-244. Swedish Environmental Ministry, 1997. Miljösamverkan i vattenvården (Environmental co-operation in water management ), Statens Offentliga Utredningar, Report SOU, Nr. 155, Swedish Environmental Ministry, Stockholm, Sweden. Tattari S., Bärlund I., Rekolainen S., Posch M., Siimes K., Tuhkanen H.-R. and Yli-Halla M. (2001). Modelling sediment yield and phosphorus transport in Finnish clayey soils. Transactions of ASAE, 44, 297-307.