Ŕ periodica polytechnica Electrical Engineering 54/1-2 (2010) 71–78 doi: 10.3311/pp.ee.2010-1-2.07 web: http:// www.pp.bme.hu/ ee c Periodica Polytechnica 2010
Quality-driven optimized resource allocation Ákos Sz˝oke / Orsolya Dobán / András Pataricza
RESEARCH ARTICLE Received 2010-05-25
Abstract The assurance of a good software product quality necessitates a managed software process. Periodic product evaluation (inspection and testing) should be executed during the development process in order to simultaneously guarantee the timeliness and quality aspects of the development workflow. A faithful prediction of the efforts needed forms the basis of a project management (PM) in order to perform a proper human resource allocation to the different development and QA activities. However, even robust resource demand and quality estimation tools, like COCOMO II and COQUALMO do not cover the timeliness point of view sufficiently due to their static nature. Correspondingly, continuous quality monitoring and quality driven supervisory control of the development process became vital aspects in PM. A well-established complementary approach uses the Weibull model to describe the dynamics of the development and QA process by a mathematical model based on the observations gained during the development process. Supervisory PM control has to concentrate development and QA resources to eliminate quality bottlenecks, as different parts (modules) of the product under development may reveal different defect density levels. Nevertheless, traditional heuristic quality management is unable to perform optimal resource allocation in the case of complex target programs. This paper presents a model-based quality-driven optimized resource allocation method. It combines the COQUALMO model as early quality predictor and empirical knowledge formulated by a Weibull model gained by the continuous monitoring of the QA process flow. An exact mathematical optimization technique is used for human resource, like tester allocation. Keywords software process · quality · resource allocation ˝ Ákos Szoke Multilogic Ltd., H-1023 Budapest, Frankel L. str. 45, Hungary e-mail:
[email protected] Orsolya Dobán András Pataricza Department of Measurement and Information Systems, BME, H-1521 Budapest, Magyar tudósok krt. 2, Hungary Quality-driven optimized resource allocation
1 Introduction
The basic definition of quality demands that the target software conforms to the requirements and it is fit to be used from the customer’s point of view. Solution providers face the demand of the efficiency of the design and implementation workflow from all the aspects of timeliness, costs and quality additionally to the conformance to requirements. As quality related problems necessitate additional iterations in the development cycle, continuous monitoring and supervisory control of quality assurance (QA) activities are critical tasks in software project management. As a matter of fact, quality is a very subjective attribute of a SW system. However, “defects are not the only measure of quality, of course; but they are the most visible indicator of quality throughout a project” [6], so it is reasonable to measure quality by the occurrence of defects. Management of QA related costs starts with the allocation of a quality budget [7] at the beginning of the project based on a forecast of the extent of QA related efforts. However, the actual efforts occurring during the progress of the development process frequently differ from the initial predictions. Accordingly controlled, adaptive quality management is needed to avoid cost or temporal penalties originating in additional iterations in the development workflow induced by quality problems. This paper presents a supervisory control policy providing an optimized resource allocation in adaptive way based on the monitoring of the QA process. 2 Background and definitions
SW quality has six views according to ISO/IEC 9126: functionality, reliability, usability, maintainability, efficiency, and portability. Many of quality factors used in formal quality models are considerably subjective [3]. Although, subjective ratings are better than not measuring at all, we focus on a much restrictive, but objective interpretation of quality, namely that of the lack of defects in the sense of conformance to the requirements. The IEEE standard [12] subdivides the notion of defects into the following categories: failure is a program behavior differing from user expectations; fault is an underlying cause that could
2010 54 1-2
71
lead to failures, and error is a missing or incorrect human action that could inject faults into the SW. 2.1 Measuring quality
3 Defect occurrence modeling
An objective PM approach needs a quantitative indicator of the quality in the form of a metrics. The most basic quality metrics is defect density expressing the ratio of defects measured in terms of KSLOC (kilo source lines of code) or pages (in documents): defect density =
number of known defects product size
(1)
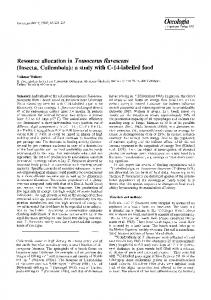
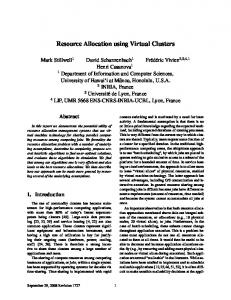
An important derived metrics is the defect profile which predicts the reliability of the product by describing the dynamics of defect removal during development, including document inspections, code inspections, and testing. It represents the efficiency of defect removal of the development corporation in each phase of development. Different modules under development have frequently different defect densities originating in differences in their size, complexity and design personnel properties etc. As the overall quality of the system is dominated by the module of the worst quality, a fine granular PM solution is required to handle these differences. A defect density profile is a vector composed of the defect densities of the individual modules well-visualizable by means of radar charts (Fig. 1): The principle of optimization of the use of QA resources is simply that more testing resources should be allocated to defect prone and/or mission critical modules to bring them to a uniform quality level of the system. In other words, the efforts dedicated to testing and repair should be harmonized with the expected number of defects in the individual modules under a constrained total quality budget. 2.2 Cost of quality
The two main types of software quality costs [8] are: conformance, and nonconformance. The cost of conformance includes prevention (do it right for the first time) costs and appraisal costs (quality improvement activities), while the cost of nonconformance includes all defect removal costs. The ratio of defect removal costs during the different phases of the software lifecycle (design and code inspection, testing, and maintenance) follows typically the 1:10:100 rule. This emphasizes the importance of an optimized use of the quality budget: early defect removal is cheaper [4, 13]. The Constructive Quality Model (COQUALMO) [14] estimates the total number of defects remaining in a software system based on defect introduction (DI) and defect removal (DR) models. The set of factors in COQUALMO are the same as in COCOMO extended by the factors related to the QA process. This model is capable to predict the expected numbers of defects at
72
the end of requirement specification, design and coding phases separately.
Per. Pol. Elec. Eng.
Defect occurrence models can be divided into two major categories [4]: reliability models predict end-product reliability by extrapolating the number of residual defects remaining undetected and uncorrected at the end of the testing process from the observed defect profile, while quality management models continuously monitor the entire workflow from the point of view of quality. Model based defect occurrence prediction can provide the project manager with early warnings on quality related problems; therefore timely actions can be executed to reinforce the QA process. 3.1 Weibull model as a defect occurrence model
While COQUALMO is a proper approach for initial quality prediction and QA related cost allocation, it lacks the potential incorporating results gained from observations during the QA process and especially it is unable to model the dynamics of the testing process. Many studies pointed out [7, 9] that a Weibull model is flexible enough to capture the dynamics of defect manifestations faithfully across a wide range of development situations. The Weibull model λ(t) is formulated as: λ(t) = N αβt α−1 exp (−βt α )
(2)
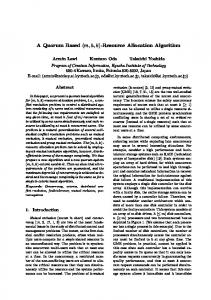
where N represents the total number of events (e.g. defect occurrences), α determines the shape of the model (shape parameter), and β is the scale of the curve (scale parameter). In the practice, the parameters of the Weibull model are estimated by a best fit setting to the series of defect observation date clustered in a histogram-like form according to some user-defined temporal resolution (Fig. 2). The area below the curve representing the entire workflow corresponds to the expected total number of defects introduced, and the area right to the instance of the termination of the QA activities to the predicted number of residual defects remaining undetected prior to issuing the software product. A typical quality management model (Fig. 2a) characterizes the defect manifestation sequence over the entire QA lifecycle. The vertical line indicates the end of the production related QA activities. The area below the curve right to this line corresponds to the number of residual defects. The reliability model in Fig. 2b presents defect manifestations from the beginning of testing. The Weibull formula can be splitted into two major parts having their own interpretation for QA activities. The monotonic increasing αβt α−1 component dominates early phases when inspection and testing starts. The decreasing exp(−βt α ) factor corresponds to the fact that testing has to reveal less and less
Ákos Sz˝oke / Orsolya Dobán / András Pataricza
system is dominated by the module of the worst quality, a fine granular PM solution is required to A. Weibull as a Defect Occurrence handle theseModel differences. A defect densityModel profile is a vector composed of the defect densities of the While COQUALMO is a proper approach for of initial individual modules well-visualizable by means radarquality chartsprediction (Figure 1):and QA related cost allocation, it lacks the potential incorporating results gained from observations during the QA process and especially it is unable to model the dynamics of the testing process. Many studies pointed out [7, 9] that a Weibull model is flexible enough to capture the dynamics of defect manifestations faithfully across a wide range of development situations. The Weibull model λ(t) is formulated as: λ ( t ) = Nαβ t
α −1
α
exp( − β t )
(Eq. 2)
where N represents the total number of events (e.g. defect occurrences), α determines the shape of the model (shape parameter), and β is the scale of the curve (scale parameter). In the practice, the parameters of the Weibull model are estimated by a best fit setting to the series of defect observation date clustered in a histogram-like form according to some user-defined temporal resolution (Figure 2). Fig. 1. Two different defect density profiles Figure 1 Two Different Defect Density Profiles
The principle of optimization of the use of QA resources is simply that more testing resources should be allocated to defect prone and/or mission critical modules to bring them to a uniform quality level of the system. In other words, the efforts dedicated to testing and repair should be harmonized with the expected number of defects in the individual modules under a constrained total quality budget. B. Cost of Quality The two main types of software quality costs [8] are: conformance, and nonconformance. The cost of conformance is include prevention (do it right for the first time) costs and appraisal costs
a) Entire development lifecycle
b) Reliability model
Fig. 2. Defect manifestation modelsa. Entire development lifecycle b. Reliability model
Figure 2 Defect Manifestation Models
failures due to defect removal with the progress of the QA process. The Rayleigh model is a special case of the Weibull model (α = 2), which is used in quality management models. The necessary conditions to use this restricted model [7] are: unimodal staffing profile, life-cycle phases of a similar duration, reasonably complete reporting of defects, use of observable defects only in the statistics, and stable QA processes. Defect manifestation is roughly proportional to the QA efforts (more efforts dedicated to QA shrink the time axis of the Rayleigh distribution and stretch the event rates). This observation will be utilized in the optimization of the QA resource allocation. 4 Case studies
The defect manifestation logs of two real-life projects were post-processed to check the faithfulness of the defect number estimators and correspondingly to test the feasibility of our approach. The first example was an e-business application (document registration system for a large enterprise) serving as a
Quality-driven optimized resource allocation
pilot application for calibrating the defect prediction measures vs. costs. The second one was a safety critical railway control system developed by means of upgrading the reliability of a traditional SCADA application by further tests. This later one was selected as a representative of the evolving class of applications integrating originally low or medium quality SW (like public domain SW) into critical applications after an exhaustive QA process. Subsequently a “what-if” analysis was carried out in order to evaluate the practical importance of using mathematical optimization techniques in the QA related PM. 4.1 Commercial system
The pilot e-business application was developed by an internal team of 12 members supported by a consulting company during a period of 10 months from the project definition to its end. The application was built over a typical three layered architecture composed of a presentation layer (Internet Explorer component embedded in a Visual Basic 6.0 host application), business logic (COM+ components developed in Visual Basic), and data
2010 54 1-2
73
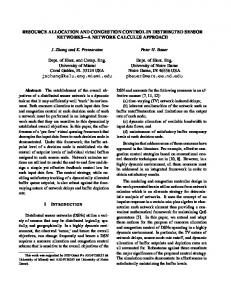
4.2 Safety critical system management layer (stored procedures and functions executed on This pilot application was developed at a company speciala MS SQL 2000 Server database) implemented as three modized in embedded control system design. Their objective was ules. The total size of the application was about 40kSLOC. Our investigation was based on two major sets of data logs to create a new product of a high required safety level (railway collected during the development process at the enterprise: the supervisory control system) based on a product developed origtest result log database (based on Rational ClearQuest) contain- inally for non-critical industrial applications. The company has ing all the defects detected during the development, and the decided on exhaustive re-inspection and re-testing of the existCOCOMO II and COQUALMO factors estimated by the local ing application according to the domain specific standards related to safety critical system development (EN 5012x series) project manager. The first step was the analysis of defect logs according to the eliminating this way a completely new software development three major development phases: requirements capture, design, process. The software consists of five major modules composed of toand implementation indicating a moderately steep increase at the beginning and a slight decrease in the number of defects over the tally more than 60 sub-modules by a project team of 20 persons. The applied software technology used UML based moddifferent phases of development. The next step was a complete COQUALMO analysis check- eling tools extended by data flow models. Versioning- and a ing the faithfulness of the estimation of the total number of change tracking systems were applied during the project, from faults. This emphasized the accuracy of the COQUALMO based which the investigated defect log data were extracted. The size predictions w.r.t. logged real-life data (the first three histograms of the software was a total of 470 kSLOC written mainly in C, in Fig. 3), as the two result set differ only by a linear factor. C++, Perl and Awk. Our aim was the estimation of the correlation between the apThe difference can be significantly decreased after an appropriate calibration of the assignment of COQUALMO factors to the plied QA methods, efforts and the achieved safety level with respect to the logged local process. The fourth histogram thetwo number gged real-life data (the first three histograms inillustrates Figure 3),only as the result set differ only by defect removal data during the re-inspection factor. Theofdifference can be estimated significantly decreased aftersince an appropriate of the and re-testing process. This experiment was a demonstrator of residual defects by COQUALMO, there was calibration ent of COQUALMO factors to the local process. The fourth histogram illustrates the number cases of software reuse, where additional QA activities aim to no available(“?”) project data in this phase. al defects estimated by COQUALMO. increase the reliability of the software. Our first step was to create a COQUALMO based estimator of the number of defects removed during the quality improvement process and to compare it with the data logged during this additional QA phase. Two separate COQUALMO calculations were performed to predict the number of residual defects in the original product and in the enhanced one, respectively. The number of defects detected during re-inspection and re-testing was estimated as their difference (Fig. 7). The majority of the factors influencing the quality (platform, personal, project quality etc.) were identical in these two cases. Fig. 3. Relationships between the Defect Log and the COQUALMO EstiThe difference between the two estimators originates in the difFigure 3 Relationships between the Defect Log and the COQUALMO Estimators mators ferent defect removal methods applied reflected as different COquently the model of the dynamics of the QA process was created by means of fitting a model of the dynamics of (Figure the QA 2a). process QUALMO defect removal factor assignments (Table 1). Only distribution toSubsequently the observedthe defect manifestation log data simple automated wasand created by meansmodel of fitting Weibulla distribution to thewith ob- the COQUALMO the Weibull hadashown good correlation empirical data analysis (syntax-, type-checking in the static QUALMOserved can deliver a prediction on the total number of defects from to the predefined software code), complemented by the usual basic level tests, defect manifestation log data (Fig. 2a). and project factors even prior of the of the project, thusshown it can abegood used aspeer a basic metrics reviews and execution tests was used during the developBoth COQUALMO andstart the Weibull model had lated resource allocation in the project planning phase. However, it can not reflex the tempocorrelation with the empirical data sets. COQUALMO can de- ment of the original software. QA was supported by basic test erties of the defect detection and removal process. The Weibull model delivers extrapolated toolsre-and ISO 9000 compliant test process manageliver a prediction the total number of the defects from the prers of the dynamics of defect on occurrences based on observations. It can coverage be gradually defined productand anddelivers project more factorsand even prior the start of the ment. the QA process advances more logofdata. The additional QA activities producing the improved software project, thus it can be used as a basic metrics in QA related rey critical system product carried out under the strict checking and verificasource allocation in the planning phase.inHowever, it can ilot application was developed at aproject company specialized embedded control systemwere design. tion rules prescribed by the standard by using, for instance: reflex the temporal properties the defect detection re- supervisory jective wasnot to create a new product of a highofrequired safety level and (railway conem) based moval on a product developed originally for non-critical industrial applications. The process. The Weibull model delivers extrapolated estima1 Sophisticated y has decided re-inspection and re-testing of the application accordingautomated analysis tools, including syntax and torsonofexhaustive the dynamics of defect occurrences based onexisting the obseranalyzers, requirements and design consistency omain specific standards related to safety critical system development (EN semantics 5012x series) vations. It can be gradually refined as the QA process advances ng this way a completely new software development process. and traceability checkers, formal verification and validation and delivers more log data. of totally more than 60 sub-modules by a oftware consists of five more majorand modules composed tools etc.; eam of 20 persons. The applied software technology used UML based modeling tools exy data flow models. Versioning- and a change tracking systems were applied thecovering all important aspects according to the 2 Peerduring reviews from which the investigated defect log data were extracted. The size of the software was a 470 kSLOC written mainly in C, C++, Perl and Awk. 74 Per. Pol. Elec. Eng. Ákos Sz˝oke / Orsolya Dobán / András Pataricza im was the estimation of the correlation between the applied QA methods, efforts and the safety level with respect to the logged defect removal data during the re-inspection and rerocess. This experiment was a demonstrator of cases of software reuse, where additional QA
Fig. 4. COQUALMO estimations
Figure 4 COQUALMO estimations
The majority of the factors influencing the quality (platform, personal, project etc) were identical
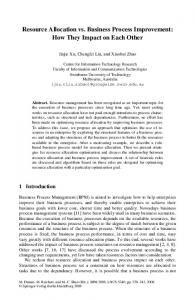
a miscalibration the estimation by adifferent wrong categorization standardized in this scenario; two cases. The difference between the two estimators oforiginates in the defect removal methods applied reflected as different COQUALMO defect removal factor assignments (Fig. 5) of the factors. 3 Execution testing of 100% instruction-coverage (driven by (Table 1). Only simple automated analysis (syntax-, in theimpact staticofsoftware code), We type-checking estimated the maximal the deviation of each Cantata). complemented by the usual basic level tests, peer individual reviews factor and execution tests was used during the by one category up or down onto the cost of the development of the original software. QA was supported by The basic coverage tools andestimates ISO 9000 re-testing. set test of potential neighboring includes Tab. 1. COQUALMO defect removal factor assignments 3 compliant test process management. 2 = 8 for each of the number of defects in the original and The additional QA activities producing software product were relative carriederror out under the 64 Original SW Safety critical the improved improved software. The largest out of these development SW re-testing strict checking and verification rules prescribed by the standardwas by using, instance: combinations by aboutfor 60% clearly indicating the need of a We estimated the maximal impact of the deviation of each individual factor by one categor 1. Sophisticated automated analysis tools, including syntax and semantics requireAutomated analysis Low Very High continuous monitoring of the numberanalyzers, of defects and not to rely down onto the cost of the re-testing. The set of potential neighboring estimates includes 2 ments and design consistency and traceability checkers, formal verification and validation Peer reviews High High only on initial estimates. each of the number of defects in the original and improved software. The largest relative erro Executiontools testingetc.; High Extra High note, that60% relative errorindicating related tothe theneed estimation of the these 64 combinationsPlease was by about clearly of a continuous monito 2. Peer reviews covering all important according to the standardized scenario; the numberaspects of defects and not to rely only on initial estimates. number additional defects may drastically increase, if only a mi3. Execution testing of 100% instruction-coverage (driven by Cantata). Please note, thatnor relative error related the estimation the number additional defec increase in quality istoindented, thus theofinitial and objective COQUALMO estimated the number of residual defects as drastically increase, if only a minor increase in quality is indented, thus the initial and ob number 763 in the original product (traditional QA), and as 263 the are number ofin defects near. of defects are near.
Original SW development
Safety critical SW re-testing
Relative number of residual defects
improved one (strict QA), respectively. detecVery High Automated analysis Accordingly, theLow Sensitivity tion of 500 defectsPeer was predicted The High High reviews for the re-testing phase. 1 High Extra High Execution testing project test log database contained a total of 399 defects detected automated analysis during re-testing, thus the relative error of the prediction was by 0,8 Table 1 COQUALMO defect removal factor assignments about 20%. 0,6 execution testing & COQUALMO estimated the number of residual defects as 763 in the original product (traditional While the results in the current experiment were better than tools 0,4 QA), and as 263 in the improved one (strict QA), respectively. Accordingly, the detection ofpeer500 dereviews expected from the point of view of the accuracy of the estimates 0,2 log database contained a total of 399 defects was predicted for the re-testing phase. The project test with respect to the real log data, its general use requires some fects detected during re-testing, thus the relative error of the 0 prediction was by about 20%. caution. One of the potential dangers in this approach is that very expected low nom from high very extra of view of the While the results in the current experiment were better than the point low high high the difference of two uncertain large with numbers may have a large accuracy of the estimates respect to the real log data, its general use requires some caution. One relativeoferror. Overestimation of theindifference (a large is number Fig. 5. Sensitivity the potential dangers this approach that the difference of analysis two uncertain large numbers may Figure 5 Sensitivity analysis of residual faults) leads to redundant test resource allocation, have a large relative error. Overestimation of the difference (a large number of residual faults) leads better,isifessentially the number of defects the original while underestimation mayresource result in underpowering ofsituation theunderestimation QA is essentially The situation better, if the in number of defects in to be im to redundant test allocation,The while may result in underpowering of the QAsoftware is already known from the logs of the initial QA process, thus only the number of defects processprocess resulting in a largeinnumber residualoffaults under a theunder original software to be improved is already known from the resulting a largeofnumber residual a deadline constraint. target productfaults has to be estimated. In our case, such data were unavailable due to historic deadline constraint. logs offirst the initial QAback process, thus the number of itdefects Uncertainty in COQUALMO has roots. The onedate is that thelong COQUALMO quality (the two roots of the original software as asonly a decade, parts of were developed Uncertainty in COQUALMO has two roots. The first one is in the target product has to be estimated. In our case, such prior to theextrapolation introduction of based the ISO9000 QA system at from the enterprise). Moreover estimator formula itself is only a best fitting on empirical data a large set of data the lack of related logs typical inactual reusingproject. third (including public domain) that thehistorical COQUALMO estimator formula itself data is only a is were unavailable due to party historic reasons (the roots of the software, original as well. pilotquality projects and expert predictions used for the best fitting extrapolation on empirical data from a large software The second based one is the so-called calibration problem, misquantification date as backaaspotential long as a decade, parts of it wereof develVI. Optimized Resource Allocation COQUALMO factors a misjudgment manager resulting in ISO9000 a large deset of historical pilot projects and by expert predictions usedofforthe the project oped already priorpotentially to the introduction of the QA sysDefect manifestation are roughly Moreover proportional QA like project actual viation project. from the real data observed later. tem atrates the enterprise). the to lack of efforts, testing related data staffing. T derlying approximation is that the allocation of more resources (e.g. testing personnel) wor A simple form of sensitivity analysis was performed for the most critical three factors (level of The second one is the so-called calibration problem, as a po- logs is typical in reusing third party (including public domain) parallel results in a rate of defects removal proportional to the amount of resources allocated. analysis, execution testing and peer reviews) in order to assess the impact of a miscalibratential automated misquantification of COQUALMO factors by a misjudgsoftware, as well. The extraction of a Rayleigh model of defect occurrences from the QA logs during the d tion the estimation by a wrong categorization (Figure 5) of the factors. ment of the of project manager potentially resulting in aprocess large dement helps allocating the proper amount of resources by predicting number of the r Optimized resource viation from the real data observed later. defects at the end of 5the development processallocation according to the current resource allocation and development deadline. Defect manifestation rates are roughly proportional to QA efA simple form of sensitivity analysis was performed for the Frequently several modules have to be developed differingapproximation in complexity and size, in imple is that most critical three factors (level of automated analysis, execu- forts, like project staffing. The underlying tion technologies (and/or even in their required reliability levels). Each module may have its the allocation of more resources (e.g. testing personnel) worktion testing and peer reviews) in order to assess the impact defect densityofvalue and the overall quality of the system is dominated by the module of th ing in parallel results in a rate of defects removal proportional to quality. If the estimation of residual defects happens for each module individually, defect prone o be identified. Adaptive quality management may re-allocate QA resources from75non quality Quality-driven optimized resource allocation 2010 54 1-2 modules to defect prone ones in order to reach a homogenously good overall quality (same r defect density) in the system. The process of resource allocation can be further refined by introducing defect and resourc
the amount of resources allocated. The extraction of a Rayleigh model of defect occurrences from the QA logs during the development process helps allocating the proper amount of resources by predicting number of the residual defects at the end of the development process according to the current resource allocation scheme and development deadline. Frequently several modules have to be developed differing in complexity and size, in implementation technologies (and/or even in their required reliability levels). Each module may have its specific defect density value and the overall quality of the system is dominated by the module of the worst quality. If the estimation of residual defects happens for each module individually, defect prone ones can be identified. Adaptive quality management may re-allocate QA resources from non qualitycritical modules to defect prone ones in order to reach a homogenously good overall quality (same residual defect density) in the system. The process of resource allocation can be further refined by introducing defect and resource types into the clustering of the records in the historical defect databases and the subsequent calculations. For instance, defects can be classified according to their severity and source into groups like “minor specification deviation” (e.g. usability defects), “minor programming defect” (e.g. bad input checking) or “major programming/design defect” (e.g. improper result of a computation). Similarly, the removal of each defect type may require the involvement of a different kind of staff (e.g. analyst, designer, and programmer) and time. We have the feeling, that this is the maximal granularity of cost factor allocation which delivers meaningful results in optimization, given the uncertainty of the different estimators. 5.1 Optimization of resource allocation
The availability of a mathematic model describing the QA process facilitates an optimization of the QA process from several aspects. By summing up the ideas described above, this mathematical model is composed of the following factors: • Variables representing the expected number of defects for each individual module (for a given time instance this set consists of three values: the empirical constant for already detected defects and the two estimators of defects detected until the end of the project and residual ones) majorized jointly by the expected total number of defects in the module; • Variables describing the amount of resources for QA activities to be allocated to the individual modules bounded by the amount of resources available (eventually these entities are decomposed into resource type); • Cost factors contain the required amount of resources (e.g. analyst, designer, programmer) to remove defects (cost calculations are based on statistical investigation).
76
Per. Pol. Elec. Eng.
A variety of alternate optimization goals can be formulated by selecting an appropriate objective function. One category aims at quality maximization constrained by the resources available and the cost budget, for instance by (i) minimizing the total number of residual defects in the system (representing a measure for the overall quality in a system composed of tightly integrated modules); or (ii) minimizing the maximal residual defect density over the modules (balanced quality of alternatively used modules). The other category aims at cost minimization constrained by the resources available and the required minimal quality level in the terms of quality indicators formulated in a similar fashion as the objective function above. 5.2 Results of the method
In our pilot experiment the maximization of the number of defects removed from the entire system was selected as objective function in order to balance the different defect densities and therefore maximize the overall quality of the entire system. The amount of resources per type and the QA cost budget were selected as constraints. This formulation led to a simple linear optimization problem producing the following results: 1 Adequate resource allocation was made by incorporating the costs of defect removal (testing + correction) into the factors of the objective function. 2 Optimization balanced the different defect densities of the modules; therefore the defect density profile is roughly a regular polygon (Fig. 6) indicating a homogenous defect density (quality) in the system. 3 Optimization revealed an a priori improper resource allocation in the case of the commercial system: some modules were over-tested. The optimal resource allocation in the whatif experiment would use by 20.5 % fewer resources, as indicated in the logs. This fact can be interpreted as 20.5 % of costs actually spent could have been saved or reallocated to defect removal in the most critical modules in order to decrease later maintenance costs. Naturally, more sophisticated cost functions can be realized, for example, which functions deal with defect severity, priority etc., but our presented solution does not deal with these parameters. 6 Architecture of the resource allocation optimization method
The architecture of the resource allocation optimization method is presented in Fig. 7: Upon starting the project: 1 COCOMO and COQUALMO models are built based upon the product, requirements and the knowledge on the workflow delivering among others an estimate of the number of total and residual defects in each module.
Ákos Sz˝oke / Orsolya Dobán / András Pataricza
Figure 6 Defect Density Profiles: before (left) and after (right) optimization
Naturally, more sophisticated cost functions can be realized, for example, which functions deal with defect severity, priority etc., but our presented solution is not deal with these parameters. VII. Architecture of the Resource Allocation Optimization Method Fig. 6. Defect density profiles: before (left) and after (right) optimization
The architecture of the resource allocation optimization method is presented in Figure 7: Figure 6 Defect Density Profiles: before (left) and after (right) optimization
Naturally, more sophisticated cost functions can be realized, for example, which functions deal with defect severity, priority etc., but our presented solution is not deal with these parameters. VII. Architecture of the Resource Allocation Optimization Method The architecture of the resource allocation optimization method is presented in Figure 7:
Figure 7 Architecture of Method the Resource Fig. 7. Architecture of the Resource Allocation Optimization
Allocation Optimization Method
starting 2 InitialUpon quality budget the andproject: initial resource allocation is per7 Conclusion and future work formed according to an initial Rayleigh model derived from Customers are most likely to buy the first product on the mar1. COCOMO and COQUALMO models are built product, and low the result of the COQUALMO-based estimation. The param- ket thatbased offersupon all thethe features they requirements want, at a reasonably the knowledge onarethe workflow delivering among an estimate of the number of total qualeters of this Rayleigh distribution estimated in such a way, price andothers promising a high end-product and maintenance and residual defects in each module. that the number N of defects is taken as the COQUALMO es- ity. Apart from these expectations, software development orga2. Initial quality budget and initial resource nizations allocation an initial timator, while the shape parameter β describing the dynamhaveistoperformed improve theiraccording project andto in-process activities. Rayleigh model derived from the result of the COQUALMO-based estimation. The ics of defect manifestations is reused from former projects The statistical quality model presented here allows the formulaparameters of this Rayleigh distribution estimated in such model a way,reflecting that thethe number carried out under similar circumstances. The main underly- aretion of a mathematical quality N of of the entire defects is taken as the COQUALMO estimator, while the shape parameter β describing the Architecture the Resource Allocation Optimization Method ing assumption is thatFigure projects7characterized byofsimilar CO- software in a given phase of development. dynamics of defect manifestations is reused from former projects carried out under similar COMO factors share a similar dynamics at an organization. Gradual refinement of the model by using in progress empirical data may compensate the high uncertainty in initial predic3 Upon The project management monitors and analyzes the Rayleigh starting the project: tions of defect numbers and correspondingly resource allocamodel periodically updated from the defect tracking database. tion. This 1. model can provide and early COQUALMO warnings on evolving quality are built based upon the product, requirements and COCOMO models This paradigm combined with exact mathematical optimizaproblems.the knowledge on the workflow delivering among others an estimate of the number of total tion techniques allows optimal resource (re)allocation to get the and residualprioritizes defects and in each module. 4 The project management optimizes the quality highest quality level keeping the given cost and schedule related 2. with Initial quality budget andreallocation initial resource allocation is performed according to an initial budget the help of optimized resource thus constraints. takes corrective actions model (project control). Rayleigh derived from the result of the COQUALMO-based estimation. The
parameters of this Rayleigh distribution areReferences estimated in such a way, that the number N of
This algorithm iterates the steps from 3 to 4 during the project 1 Object Management Group, Software Process Engineering Metamodel defects is taken as the COQUALMO estimator, while the shape parameter β describing the at stated intervals. Specification, OMG, 2002.
dynamics of defect manifestations is reused from former projects carried out under similar
Quality-driven optimized resource allocation
2010 54 1-2
77
2 Paulk M, Curtis B, Chrissis M, Weber C, Capability Maturity Model for Software, Tech. Report 1993 CMU/SEI. 3 Fenton N E, Pfleeger S L, Software Metrics 2nd Edition, PWS Publishing Company, 1997. 4 Kan S H, Metrics and Models in Software Quality Engineering, AddisonWesley, 2002. 5 Luenberger D G, Linear and Nonlinear Programming, Addison-Wesley, 1989. 6 Yourdon E, Software Metrics, Application Development Strategies (newsletter) ( November 1994), 16. 7 Card D N, Managing Software Quality with Defects, Proceedings of the 26th Annual Computer Software and Application Conference (COMPSAC’02), 2002 IEEE Computer Society, DOI 10.1109/CMPSAC.2002.1045048, (to appear in print). 8 Slaughter S A, Harter D E, Krishnan M S, Evaluating the Cost of Software Quality, Communication of the ACM 41 ( August 1998), no. 8, 67-73, DOI 10.1145/280324.280335. 9 Li P L, Shaw M, Herbsleb J, Ray B, Santhanam P, Empirical Evaluation of Defect Projection Models for Widely-deployed Production Software Systems, SIGSOFT 2004/FSE-12, posted on November, 2004, DOI 10.1145/1029894.1029930, (to appear in print). 10 ISO/IEC Standard 9126. Information Technology - Software Quality, Part 1, 1995. 11 Putnam L, Myers W, Measures for Excellence, 1992. Yourdon Press Computing Series. 12 IEEE Standard Glossary of Software Engineering Terminology, IEEE STD 610.12-1990. 13 Remus H, Integrated Software Validation in the View of Inspections/Review, Proceedings of the Symposium on Software Validation, Darmstadt, Germany, Amsterdam: North Holland, 1983, pp. 57–64. 14 Center for Software Engineering, Constructive Cost Model (COCOMO)and Constructive Quality Model (COQUALMO), available at URL: http://sunset.usc.edu. 15 R Development Core Team, R Language Definition, 2004, available at URL:http://www.r-project.org.
78
Per. Pol. Elec. Eng.
Ákos Sz˝oke / Orsolya Dobán / András Pataricza