Proceedings of the Sixth International Conference on Information Quality
Quality Mining A Data Mining Based Method for Data Quality Evaluation Sabrina Vázquez Soler and Daniel Yankelevich Pragma Consultores and Departamento de Computación – FCEyN Universidad de Buenos Aires, Argentina
[email protected],
[email protected] Abstract: The value of information depends directly on the quality of the data used. Decisions are no better than the data on which they are based. How can organizations assess the quality of their information? How can they know if their data are useful? Quality control and management have become competitive needs for most businesses today, and there is a wide experience on the topic of quality. Approaches range from technical, such as statistical process control, to managerial, such as quality circles. An analogous experience basis is needed for data quality. In this paper we present a method for data quality evaluation based on Data Mining. We introduce QuAsAR, a mechanism for the systematic analysis of correctness based on the information itself. In order to evaluate the performance of the method, we apply it to a real case study. This case study helps us to analyze support and confidence intervals and distribution of erroneous data. Keywords: Data Quality, Data Mining, Quality Mining, Quality Control, KDD. Acknowledgements: This research was partially supported by the ANPCyT under ARTE Project grant PIC 11-00000-01856 and UBACyT grant PIC TW72. The authors also want to thank Martin Patrici and Monica Bobrowski for their helpful comments.
1
INTRODUCTION Having the right information at the right time is a key issue in today’s organizations. The value of information directly depends on the quality of the data used. Decisions are no better than the data on which they are based [2]. However, few organizations handle information as a tangible asset. How can companies assess the quality of their information? How can they know if their data are useful? Managers need to have the ability to verify the usefulness and correctness of the information they use, not only for decisions making, but also to allow them to learn more about the business. The information may help in restructuring areas, improving workflow, etc. In general, inaccurate, out-of-date, or incomplete data can have a significant impact not only on the organization that generates them. Errors in credit reporting is one of the most striking examples of the social consequences of poor quality data. For instance, the credit industry not only collects financial data on individuals, but also compiles employment records [1]. On the other hand, organizations are learning that in order to provide quality products or services, they need to implement quality programs. Many corporations have devoted significant time and energy to a variety of quality initiatives such as inter functional teams, reliability engineering, and statistical quality control [2] [19].
162
Proceedings of the Sixth International Conference on Information Quality
Quality control and management have become competitive needs for most businesses today, and there is wide experience on the topic of quality. Approaches range from technical, such as statistical process control, to managerial, such as quality circles. An analogous experience basis is needed for data quality [18] [19]. Usually, it is not easy for organizations to test their data. One of the main factors could be that domain experts - people with knowledge on business domain or on the methodology involved - are not responsible for data analysis. Managers need to count on some mechanism to be able to perform this task and achieve those aims. Providing such a mechanism is the goal of this work [2]. In this paper we present a data quality evaluation method. We introduce a mechanism for systematic analysis of correctness based on the information itself. We also present a case study to analyze the performance of this mechanism. The method we present is based on Data Mining. We use the data intrinsic rules to characterize and evaluate data. There are several reasons why it is better to analyze business patterns through rules, the most important being that the analysis is based on the patterns, which are several orders of magnitude smaller than the data. Besides, domain experts normally associate business knowledge to behavior patterns. This is a common way of characterizing knowledge. Therefore, the knowledge of rules that allows improving information quality can also have different uses. The wrong thing is to consider data quality as good without a previous check, and realizing afterwards that wrong decisions were made. In Section 2 we discuss the basis of our research. In Section 3, we present the QM method. In Section 4, we introduce QuAsAR, a QM technique. Section 5 describes the case study developed and its results.
2 2.1
QUALITY MINING Overview We define Quality Mining (QM) as a method for Data Quality (DQ) [2] [15] evaluation inspired in Data Mining (DM) [1] [9] [11], that is, this method involves every kind of DQ techniques based on DM. The main difference between both methods is the goal they attempt to reach. The aim of DM [1] [11] is to find new knowledge while QM strives for the evaluation of data quality using reliable patterns, which do not necessarily introduce new knowledge. Gathering knowledge from data is directly related to the Knowledge Discovery in Databases process (KDD) [1]. DM represents the new knowledge discovery dimension of this process. Moreover, it assumes that the data is complete, compiled and “cleaned” to start the knowledge discovery phase. On the other hand, QM represents the data quality evaluation dimension. The following chart shows our view of KDD:
163
Proceedings of the Sixth International Conference on Information Quality
KDD process Data Selection
Tasks: - select data - gather data in a centralized database
Data Cleaning
Tasks: - find duplicate records - correct typing errors - etc.
Quality Mining Enrichment
Coding
Tasks: - add extra data (Eg: purchased data)
Tasks: - define data granularity -standardize the item values - make the flat table
Pattern Recognition for Quality Assessment
Analysis
Data Mining Pattern Recognition for finding hidden knowledge
Analysis
This method can be used to validate a group of data before they are used .for decision making. In these cases, managers need correct information. In the case of system migrations, it is possible to use this method to gather integrity rules that may be incorporated as Metadata to the new system, to improve data quality.
2.2 2.2.1
Related Work DataSphere In AT&T [16], a technique called DataSphere has been developed. This technique allows the detection of data glitches, that is changes introduced in data by external causes not related to normal noise. We understand by normal noise uncontrollable measurement errors such as imprecise instruments, subtle variations in measurement conditions (climatic conditions, software degeneration, etc.) and human factors. Otherwise, data glitches are systematic changes caused by mega phenomena such as unintended duplicate records, switched fields, and so on. This technique partitions the attribute space in subsets based on two criteria: distance and direction. It is also possible to use clustering and classification to generate the subsets. Directional information is superimposed on distance using the concept of pyramids. Every layer-pyramid combination represents a class of the DataSphere partition. The data points in each class are summarized by a profile. The glitch detection is very fast since it is based on the profiles, which are several orders of magnitude smaller than the original data set.
2.2.2
Wizrule of WizSoft This application can obtain rules based on data from the definition of three variables: minimum probability – that corresponds to confidence -, minimum accuracy and number of appearances of rules – that corresponds to the support [20]. Pattern recognition algorithm is not given; the documentation describes that statistical methods are used to determine patterns. There are two main differences between this technique and QuAsAR (see below for further reference). The first one is that the concept of minimum probability does not correspond to the definition of confidence ranges that determines the rules. The second reason is the impossibility to analyze separately the concepts of support and confidence [20]. These techniques, DataSphere and Wizrule, are also included in QM framework, although they face data quality problem from different aspects.
164
Proceedings of the Sixth International Conference on Information Quality
3 3.1
QUASAR: A QUALITY MINING TECHNIQUE Introduction The term Data Quality can be best defined as “fitness for use”, revealing the relativity of the concept. Fitness for use means the need to go beyond traditional concerns of data accuracy is necessary [15]. In addition, the domain experts normally associate business knowledge to behavior patterns. This is a common way of characterizing knowledge. For instance, “The Wing B of the X Hospital only deals with hepatic problems, or all the people that work there are dentists”, and so on. If the discovery of rules shows hidden knowledge from data, their use as a mechanism for testing data quality would not be efficient. The characteristic of unknown information makes business experts analysis not easy. Although DM [1] [11] techniques are really adequate for finding hidden knowledge, some experiments have shown that data quality is essential to determine the reliability of the knowledge found [1]. However, having the rules does not ensure the complete solution of data quality problem: consistency does not mean/equal correctness. This method helps to find data inconsistency, it will not be possible to detect an incorrect but consistent datum. However, if it is inconsistent, we can classify it as a potential error.
3.2
Overview This technique is described as a method for data quality testing based on re-engineering [7]. It is called Quality Assessment using Association Rules (QuAsAR) and is based on Association Rules (AR) [1] [9] [11] techniques. An association rule -a rule like χÞIj- is a representation of a relationship between variables. This technique has two main concepts used to search data: confidence and support. Formally, given a rule χÞIj, where χ is a set of several items and Ij is an item not included in χ, we define that: Ø Confidence refers to the percentage of records, which χ holds, within the group of records for which Ij and χ hold. To find hidden information we look for rules with average percentage, because the rules with a higher percentage usually represent known information. Ø Support refers to the percentage of records which χ and Ij all hold. When we look for new knowledge we want to find the rules with higher support. As in the AR techniques used as a basis for this method, it is important to have a concrete idea of what we are looking for. This is shown in the selection of the subset of information to be analyzed and in the determination of the support and confidence. The interested reader is referred to [1] [4]. In short, below are the points where AR and QuAsAR differ: Ø QuAsAR looks for the most and least known rules. Ø The rules do not necessarily represent new knowledge. Ø The process is not focussed on large set of variables, but on data used for decision making.
165
Proceedings of the Sixth International Conference on Information Quality
Ø The confidence level is defined with two intervals: one of confidence, whose superior benchmark is 100%, and another one of mistrust, whose substandard benchmark is 0%. Ø There is no direct relation between support and confidence. We do not look for rules that attain both conditions. Ø We look for rules with low levels of support. The idea is to analyze the data in order to infer the candidate rules and to calculate levels of support and confidence. For instance, the rules that appear in a very small number of records (1%) may be potential entry errors and are candidates to be evaluated. Also the opposite relationship could be observed: rules that appear in a very large number of records may be considered as a business rule. That means that all the records that do not fulfill the rule could be a potential error. We will now describe in more detail the QuAsAR technique. To do that, we will explain how it works with a simple example, which deals with a hospital database. We choose two variables: Illnesses and Doctors. In this particular domain, Illnesses and Doctors are repetitive and all doctors are specialists on a specific area. We suppose that Data Selection, Data Cleaning and Coding phases were already finished and we have a flat table like the following. Acute Dr. Rec. Heppatitis White 1 Yes Yes 2 Yes No 3 Yes No 4 Yes No 5 Yes Yes 6 Yes No 7 Yes No 8 Yes Yes 9 Yes Yes 10 Yes Yes No 11 Yes
3.3
Dr. Doe No No Yes Yes No Yes Yes No No No No
Dr. Dr. Smith Johnson No No Yes No No No No No No No No No No No No No No No No No No Yes
Illnesses variable appears only once, because we chose just one value. On the other hand, in each transaction there is only one doctor. Consequently, for each record in the flat table there is only one occurrence for the Doctors variable. The columns represent the different data; each record shows the value of each transaction. “Yes” is used to indicate the appearance of the data in the transaction and “No” to show its absence.
Confidence and Support Definition We handle confidence and support in a different way than AR does [1] [4]. This is one of the main differences between both techniques. The definition of both intervals is directly related to business domain. Therefore, a brief analysis of the data gathered is required. Confidence [1] [9]: If the domain variables are repetitive, like Illnesses and Doctors in the hospital database, it is possible to find that an antecedent appears several times with the same consequent. The confidence interval should be defined with a value near the upper benchmark, to obtain rules that are practically certain. On the other hand, it is necessary to consider a larger interval for confidence, to look for the less certain rules. The benchmark of the mistrust interval can be defined as the minimum value expected for any two possible variable values. Confidence may be delimited with a confidence interval like (100; 95] and mistrust interval like [1;0). This definition supposes that if an antecedent appears 95 % of the time with a particular consequent, then the remaining 5% deserves to be evaluated. Accordingly, those rules with a confidence below 1% are potential errors. Although it is possible to define larger intervals, this would reduce the probability of finding errors.
166
Proceedings of the Sixth International Conference on Information Quality
Support [1] [9]: support allows the detection of data inconsistency analyzing the number of records where both antecedent and consequent are present. The rules with an average percentage of occurrences have less probability to be potential errors. Support is focused on the lower benchmark. For example, if a certain rule, with 100 % of confidence, appears in only 2 of one million records, it represents a potential error. When defining support, the most important issue is the determination of the minimum number of expected occurrences for any value, that is, an estimation of the minimum frequency of occurrences of a variable value; if this parameter is unknown, it is possible to define a benchmark like 1/1000 occurrences, whereas if a datum appears in more occasions it will not be considered as “irregular”. In this case, the support is set to ((1/1000)/ # quantity of records) * 100. In short, it is possible to “juggle” with different intervals in order to adjust the search. This depends on the business domain and on the set of rules looked for. In the example described, Illnesses and Doctors are repetitive. As a result, the confidence relationship between the antecedent and the consequent- is established within the intervals (100, 90] and [10, 0). The support was set as 10 %, which represents a threshold 1 record. 3.3.1
Pattern Recognition Once the data are gathered and cleaned, and support and confidence are defined, the next step is pattern recognition. At this point, with the flat table constructed, we can apply any AR algorithm. In this case, we will use a QM adapted version of the Dupla Matricial [16] algorithm. To continue with the example, we will explain a high-level version of the algorithm used. The fist step is the calculation of the matrix of occurrences, which includes the number of times that any combination of two variable values appears on a record. The right table represents the matrix of occurrences.
A A B C D E
B 11
C 5 5
D 4 0 4
E 1 0 0 1
Once the matrix of occurrences is defined, we calculate the values of support and confidence for each rule. AB BA AC CA AD DA AE EA
Support Confidence 45 50 45 100 36 40 36 100 9 10 9 100 9 10 9 100
The table on the left shows support and confidence values for each pair of values. The next step is selection of candidate rules. The selected rules are the following: Ø AD, DA, AE y EA because they have less than 10 % support. Ø AD y AE because the confidence is in the mistrust interval.
This means that: Ø Dr. Smith looks after 10% of the ACUTE HEPATITIS, with 9 % support. Ø Dr. Johnson looks after 10% of the ACUTE HEPATITIS, with 9 % support. Ø 100% of the illnesses attended by Dr. Smith are ACUTE HEPATITIS, with 9 % support. Ø 100% of the illnesses attended by Dr. Johnson are ACUTE HEPATITIS, with 9 % support.
167
1 0 0 0 1
Proceedings of the Sixth International Conference on Information Quality
3.3.2
Analysis The most subjective task of the QuAsAR technique is the analysis of the rules generated as a result of the process previously described. This subjectivity is directly related to the different qualitative value that a specific piece of data might have for different users. At this point, it is necessary to work in association with people that have the specific knowledge of the business involved. This does not prevent some rules from being validated using another source. For instance, geographic data could be checked using maps or other sources of geographic data such as satellite images. Some variables must be analyzed in detail. These variables correspond to values that appear by default on the input-screen of the application used to capture data. In the example, the input-screen always suggests the same doctor by default, then this doctor will probably appear related to other illnesses rather than to his/her own specialization. If Metadata information is provided, this information can be used in order to check for data constraints, inconsistency in data types, and so on. All those constraints should be present in the analyzed data. To sum up, some of the issues to be considered during the analysis of the rules gathered are: Ø To work with business experts to analyze rules Ø To analyze the Metadata of information system – if data come from a specific application Ø To check default values in input-screens Ø To determine the existence of other information systems, standards, laws or other elements that allow analysis automation Ø To divide rules by subject areas, to simplify business experts work To finish the former example, we were able to detect that Dr. Smith was a cardiologist and that Dr. Johnson was gynecologist. Neither of them were related to cases of acute hepatitis, thus the four rules found were wrong. The other rules did not show any error.
3.4
Tools: Rules Finder This is an integrity control tool based on data re-engineering [7]. The application was developed for this research. Its development was incremental and aimed to cover the needs generated during the case study. This application allows automatic generation and filling of flat table and the calculation of support and confidence. Also a QM adapted version of the Dupla Matricial [16] algorithm was implemented.
4 4.1
CASE STUDY Introduction In order to evaluate method performance, we use it in a real case study. This case study also helps us to validate the assumptions made during the method definition: Support and confidence should be
168
Proceedings of the Sixth International Conference on Information Quality
analyzed independently and confidence analysis should address both confidence and mistrust intervals. Data for test is owned by an oil and gas company. We selected a database from an information system that stores data from operations performed in oil wells. We chose a set of data that belongs to a specific geographic area, approximately 50,000 records. The information system was chosen because data entry application did not perform any kind of validation or integrity checking. In addition, there was no documentation of the application and the Metadata. Also, it was not possible to recover foreign keys, even though there was a high-level description of the physical data model. These factors indicated that the database was error-prone. Besides, we developed the Rules Finder application in order to create the flat table and calculate the candidate rules based on a given support and confidence.
4.2
Definitions The goal was the analysis of stored data for wells, drilling operations, and companies contracted to perform them. This information is used for performance analysis of both companies and equipment involved. This information represents the core of the data stored in the application, thus any error in these data directly impacts in the quality of the rest of system information. Data Selection, Cleaning, Coding and Support and Confidence definition were performed with domain experts.
4.3
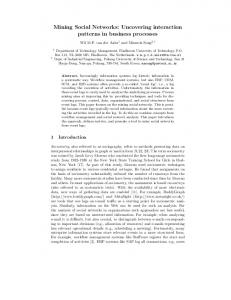
Results The result of this case study showed that more than 30% of the rules found were data errors. This outcome was better than we expected. From the point of view of domain experts, it was recognized as an important and productive task. There was a previous attempt to analyze data quality without a systematic method, which substantially complicated the task. We present the results for support and confidence intervals. Each interval was analyzed separately. From rules based on confidence intervals, it was possible to detect that 30% of them were errors. Although this number is high, it may be related to the fact that the application from which data came has no validation mechanisms. In addition, no integrity checks had been made before. The chart on the right shows results distribution according to confidence interval. The rules are classified in two groups, the first one corresponds to rules that represent errors; the second one, named “Unknown”, groups the correct and undetermined rules.
Result Distribution 15 # of Rules
10 5 0
The number of rules in this interval was not 95 96 97 98 99 Unknown significant, however we were able to detect several Confidence interval [95, 100) Errors errors. This is a confirmation of our original assumption about the confidence interval: the analysis should not only be confined to those rules whose confidence is near the upper benchmark. Also, we did not find errors related to default values of data entry menus.
169
Proceedings of the Sixth International Conference on Information Quality
Result Distribution (II) 500 400 300 # of Rules 200 100 0 0 Unknown Errors
0.2
0.4
0.6
The results of mistrust interval were distributed as expected. The number of errors grows up while confidence decreases. More than 50 % of them appear in the (0, 0.1) interval. Going back to the definition of confidence, this means that in more than 99.9 % of records the antecedents were related to other consequent. That is the reason why the analysis of the mistrust interval is very
0.8
Mistrust interval (0,1]
important. The support analysis showed that more than 35% of rules found corresponded to data errors. Although this number is high, it was expected because Result Distribution (III) application did not perform any validations. 1500
The number of errors increased while the support decreased. Also, when the quantity of occurrences grows, the probability of finding an error decreases. One of the most common errors found was the appearance of “irregular” values that did not correspond to any feasible value. The interested reader is referred to [17].
4.4
# of Rules
1000 500 0 0.01 0.03 0.06 0.08
Unknownr Errors
Support
Performance When the method was defined two important assumptions were made. First, Support and Confidence should be analyzed separately, because we assume that it was possible to find more classes of errors. The other assumption was the redefinition of confidence. We propose a two-interval approach, one of confidence and another of mistrust. Each interval focuses the search in a different way, “certain” versus “ irregular”. In our case study the most Global Result efficient was the second one (0, 1]. Moreover, 52 % of the errors were found on it and 37 % on 2500 the other one [95, 100]. 2000 If support and confidence were analyzed together the result would be less significant. The right chart shows the global result distribution based on rules confidence. Although most errors were found on confidence intervals, some errors were also found in between.
100% 80% 60% 40% 20% 0% 0
20
40
60
80
1500 1000 500 0
Unknown Errors
0
20
40
60
80
100
% Confidence
The chart on the left shows the comparison between support and confidence analyzed individually and together. With our assumption we found 108% more errors, than analyzing the intervals separately. The interested reader is referred to [17].
Results Comparison
% of rules
# of Rules
100
Unknown: added S or C% Confidence Errors: added S or C Unknown: both S and C Errors: both S and C
170
Proceedings of the Sixth International Conference on Information Quality
5
CONCLUSION AND FURTHER WORK We have developed a method to help organizations to verify data quality in a given context. Furthermore, this method has proved to be quite useful in evaluating data quality in general. This research also demonstrates that DM based techniques are useful in DQ. Like all the quality control mechanisms, QM does not resolve the problem completely. It should be used in combination with other existing techniques in order to achieve the desired results. More theoretical work remains to be done in this area. From the QuAsAR standpoint, further work should focus on expanding confidence and support intervals. It is expected that the method can be extended and improved as it is applied to a wider variety of cases. Also, it is likely to find a relationship between these intervals and quality dimensions [13]. This would help to make a deeper analysis of the information, stressing it on specific dimensions. Another possible extension of this technique is the definition of a mechanism to keep the rules updated without reprocessing or recalculating them. This may be developed using Active Data Mining techniques [12]. This may be useful in changing domains, where the rules generated could become outdated after a short period of time. It is also possible to develop a preventive quality control technique [7]. For instance, making reports that show data not complying with rules, or adding automatic checks that prevent erroneous data from being entered; or implementing any external application that validates information and allows to correct invalid data, and so on. The knowledge of rules to improve information can also have different uses. The mistake is to consider data quality as good without a previous check and realizing afterwards that wrong decisions were made.
6
REFERENCES [1] [2]
Adriaans P. and Zantinge D., Data Mining, Addison-Wesley, First Edition, 1996 Bobrowski M., Marré M., Yankelevich D., A Software Engineering View of Data Quality, European Quality Week, 1998 [3] Dasu T., Johnson T, Hunting of the Snark – Finding Data Glitches using Data Mining Methods, In Proceeding of the 1999 Conference of Information Quality, Cambridge, Massachusetts, 1999 [4] Kamal A., Stefanos M. and Ramakrishnan S., Partial Classification using Association Rules, American Association for Artificial Intelligence, 1997 [5] Kismet Analytic Corporation, Data Quality Methods, White Paper, 1996 [6] Little, R.J.A. and Rubin, D.B. Statistical Analysis with Missing Data, 1987 [7] Melgratti H., Yankelevich D., Tools for Data Quality, Technical Report, 1999 [8] Meyer P., Introductory Probability and Statistical Applications, Addison-Wesley, Spanish Revised Edition, 1992 [9] Rakesh A., Tomas I. and Arun S., Mining Association Rules between Sets of Items in Large Databases, In Proceeding of the ACM SIGMOD Conference on Management of Data, Washington D.C., May 1993 [10] Rakesh A., Ramakrishnan S., Mining Generalized Association Rules, In Proc. of
171
Proceedings of the Sixth International Conference on Information Quality
the Very Large Dababase Conference, Zurich, Switzerland, 1995 [11] Rakesh A., Data Mining, In Proceeding of the Very Large Database Conference, Buenos Aires, Argentina, 1998 [12] Rakesh A., Psaila G., Active Data Mining, In Proceeding of the KDD Conference, Portland, Oregon, 1995 [13] Redman T., Data Quality for the Information Age, Artech House, 1996 [14] Strong D., Lee Y., Wang Y., Data Quality in Context, Communications of the ACM, Vol. 40 No. 5, May 1997 [15] Tayi G., Ballou D., Examining Data Quality, Communications of the ACM, Vol. 41No. 2, February 1998 [16] Vázquez Soler S., Wilkinson H., Mining Association Rules, Technical Report, 1997 [17] Vázquez Soler S., Data Mining para evaluación de Calidad de Datos, Undergraduate thesis UBA, 2000 [18] Wang F., Total Data Quality Management, Communications of the ACM, Vol. 41No. 2, February 1998 [19] Wang R., Kon H., Towards Total Data Quality Management, MIT Working Paper Series, 1992 [20] Wizsoft, Wizrules for Windows’95 User’s Guide, Version 3, 1997
172