Quality of Experience in Distributed Interactive Multimedia Environments: Toward a Theoretical Framework Wanmin Wu† Ahsan Arefin† Raoul Rivas† Department of Computer Science University of Illinois at Urbana-Champaign †
{wwu23,marefin2,trivas,klara, rsheppard2}@illinois.edu
ABSTRACT The past decades have witnessed a rapid growth of Distributed Interactive Multimedia Environments (DIMEs). Despite their intensity of user-involved interaction, the existing evaluation frameworks remain very much system-centric. As a step toward the human-centric paradigm, we present a conceptual framework of Quality of Experience (QoE) in DIMEs, to model, measure, and understand user experience and its relationship with the traditional Quality of Service (QoS) metrics. A multi-displinary approach is taken to build up the framework based on the theoretical results from various fields including psychology, cognitive sciences, sociology, and information technology. We introduce a mapping methodology to quantify the correlations between QoS and QoE, and describe our controlled and uncontrolled studies as illustrating examples. The results present the first deep study to model the multi-facet QoE construct, map the QoS-QoE relationship, and capture the human-centric quality modalities in the context of DIMEs.
Categories and Subject Descriptors H.5.3 [Group and Organization Interfaces]: Computersupported cooperative work; H.1.2 [Information Systems]: Models and Principles—human factors
General Terms Experimentation, Human Factors, Measurement, Performance
Keywords Distributed interactive multimedia environments, QoS, QoE
1.
INTRODUCTION
Few multimedia applications do not interact with users. In particular, Distributed Interactive Multimedia Environments (DIMEs), with applications in video-conferencing [14], 3D tele-immersion (3DTI) [32], and multi-player gaming [19],
Permission to make digital or hard copies of all or part of this work for personal or classroom use is granted without fee provided that copies are not made or distributed for profit or commercial advantage and that copies bear this notice and the full citation on the first page. To copy otherwise, to republish, to post on servers or to redistribute to lists, requires prior specific permission and/or a fee. MM’09, October 19–24, 2009, Beijing, China. Copyright 2009 ACM 978-1-60558-608-3/09/10 ...$5.00.
‡
Klara Nahrstedt† Renata M. Sheppard† Zhenyu Yang‡
School of Computing and Information Sciences Florida International University
[email protected]
are among those with the greatest level of interaction. Users there not only interact with the computing environment, but also with other peers through various communication channels. Regarded as the next-generation “killer apps” over the Internet, DIMEs are gaining tremendous attention from industries and research communities. As Cisco puts it, we are entering the era of “Medianet” [35]. Despite the extensity and intensity of user-involved interaction in these multimedia applications, human-centric computing (HCC) approaches have not been introduced to the field until recently [28]. HCC represents a set of principles and strategies that bear “the human focus from the beginning to the end” [28]. As our design and implementation paradigms shift to the human-centered domain, however, the evaluation methodologies in multimedia still remain very much system-centric. Mostly, Quality of Service (QoS) metrics have been the de facto standards to demonstrate usefulness of DIME technologies. Empirical findings have shown us that systems excelling in QoS can completely fail for user adoption due to the gap between system- and human-centric evaluations [16]. However, there has been little understanding about the user-centered measure - Quality of Experience (QoE) - in the multimedia communities [2, 26, 29, 37, 48]. Researchers have made attempts to add subjective questions in the DIME performance assessments [4, 14]. However, the existing ad hoc methodologies only leave us with a bewildering welter of “quality” metrics that are application-specific and not practically generalizable. So what is QoE? How can we model it? What are the relationships between QoS and QoE? How do we measure their qualities and relationships? These unanswered research questions became the motivation for our work. Guided by the theories in psychology, cognitive science, sociology, and information technology, we model QoE as a multi-dimensional construct of user perceptions and behaviors. As shown in Figure 1, the relationship between QoS and QoE is formed as a causal chain of “environmental influences –> cognitive perceptions –> behavioral consequences [36]”, where QoS metrics represent the environmental factors that influence QoE1 . We describe a methodology for correlation mapping between the constructs in the quality framework. 1 There is also a feedback loop from QoE to QoS (as shown by the dashed arrow in Figure 1), where the requirements and responses of users may drive the configuration of desired QoS. However, in this work we mainly focus on the QoS –> QoE mapping, as the understanding of this relationship may significantly advance the field.
the model is generally extensible to multi-party collaboration in a larger scale.
User Influences
QoE Cognitive Perceptions
Behavioral Consequences
Holistic Virtual Environment
Environmental Influences
User(s)
QoS
INPUT
INPUT
OUTPUT
OUTPUT
Local Environment
User(s)
Local Environment Dynamic Multimedia Data Flow
Figure 1: Causal Chain in the Quality Framework of QoS and QoE
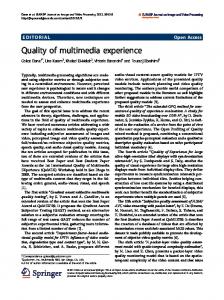
Figure 2: Communication Model of DIMEs Based on the characteristics of DIMEs, we build up a taxonomy of dimensions for both QoS and QoE in the framework, along with a classification of the metrics that are commonly used in practice such as Peak Signal Noise Ratio (PSNR) and response time. Finally, we explore the methodology of QoS-QoE mapping (correlation) by applying the framework to our empirical studies of a 3DTI system. The results from a two-week controlled study and a one-year uncontrolled field study are presented. In summary, our contributions in this paper include the following. We first provide a clear definition of QoE and its conceptual model in DIMEs. Instead of thinking QoE as an extension or subset of QoS [26, 29], we propose to consider the two constructs as distinct components on a causal chain. Last but not least, we present a methodology to compute the mappings from QoS to QoE, which can offer useful insights for DIME designers and practitioners. The results present the first deep study to model the multi-facet QoE construct, map the QoS-QoE relationship, and capture the human-centric quality modalities in the context of DIMEs. In the remainder of the paper, we begin by reviewing the existing DIMEs in the literature, and discuss their characteristics (Section 2). We then provide a definition of QoE and overview the framework (Section 3). Using theories to guide the selection of variables, we next present the construction of our conceptual quality framework (Section 4). The mapping methodology is then described, exemplified with our empirical studies in a particular DIME (Section 5). The paper concludes by correlating our findings toward implications for theory and practice (Section 6).
2. 2.1
DISTRIBUTED INTERACTIVE MULTIMEDIA ENVIRONMENTS Communication Model
Interactivity is the key characteristics in DIMEs. Users not only interact with the computing environment, but also with other users through various communication channels. Figure 2 presents the conceptual interaction model of DIMEs (adapted from [47]). Each user’s local environment consists of both input and output components. Input components use sensing devices (e.g, cameras, microphones, mouse, keyboard) to capture user’s actions in real time, whereas output components present the aggregated local and remote user states. Examples of output devices are displays and haptic interfaces. Although only two local environments are shown,
The holistic virtual environment, which merges local and remote user states, creates the virtual reality experience and provides a shared cyber-space for mediated interaction. By Steuer’s definitions, virtual reality is a generic concept, finding its appearance in various situations such as having phone conversation and reading a letter from a distant friend [47]. In this work, we are mainly concerned with DIMEs which use multi-modality media (e.g., video, audio, and graphics) to connect geographically distributed users into a joint interactive space for collaboration.
2.2
Practical Examples
Perhaps the most commonly known DIMEs are the 2D video-based systems. Representative examples include industrial products such as Cisco Telepresence [10], WebEx [51], HP Halo room [24], and Polycom Telepresence [42], as well as research prototypes such as Virtual Auditorium [9], Exertion Interfaces [38], and MyView [55]. These systems have been used for video-conferencing, remote lecturing, and entertainment. Emerging are 3D tele-immersive (3DTI) systems that rely on real-time multi-view 3D video to create the holistic virtual environment (e.g., HP Coliseum [5], TEEVE [54]). Since the 3D representations of remote users are immersed into a virtual space, such systems allow interaction of body movement, as demonstrated in a range of activities such as dancing [45] and Tai-Chi learning [4]. Graphical backgrounds and virtual objects can also be integrated into the virtual environment, which is not possible with 2D video-based systems. Researchers have described, for instance, that two remote users can interactively manipulate a floating jello-like object by using 3DTI systems [33]. Other than the video-based systems, graphical gaming environments have been around for years. Recently, large-scale gaming applications, also known as Massively Multiplayer Online Role-Playing Games (MMORPGs), are gaining increasing popularity. The scale of these games can be huge, e.g., arguably the most popular MMORPG - World of Warcraft - has 11.5 millions subscribers as of 2009 [8] and over 1 million simultaneous players in China alone [52]. How to achieve consistency efficiently has been an intense topic of research [7, 11, 34].
3.
QUALITY FRAMEWORK OVERVIEW
In this section, we provide the definitions of QoS and QoE, describe their conceptual relationships, and give an overview of the theoretical framework being built.
User Level
Application Level
System Level
Network Level
Quality of Experience Video frame rate, response time, PSNR
Burst density, gap density (RTP related)
Packet loss, delay, bandwidth, video bit rate
Application QoS
is a classification of the common metrics being used. Finally, we survey the existing DIMEs and compare them within our quality framework (Section 4.3). Figure 4 presents our integrated quality framework.
System QoS
4.1
Network QoS
As Figure 1 shows, the QoE model and its representative dimensions include both the cognitive perceptions (Section 4.1.1) and behavioral consequences (Section 4.1.2) of users.
Figure 3: QoE and QoS in the Protocol Stack
4.1.1
QoE Construct
Cognitive Perceptions
We consider three main dimensions of cognitive perceptions: psychological flow, perceived technology acceptance, QoS refers to a set of measures for tuning or quantifyand telepresence. These dimensions characterize user’s three ing the performance of applications, systems, and networks. roles in DIMEs: executant of tasks, user of technology, and Figure 3 illustrates the QoS factors in the protocol stack and participant in group telecommunication. Likert scale has their conceptual relations with QoE. In particular, the apbeen most commonly used to evaluate the cognitive percepplication QoS metrics, strongly influenced by the underlying tions of users. system and network QoS, are those possibly perceptible by Flow . For the role of task executant, flow can measure users, thereby directly correlated with QoE. “the holistic sensation that people feel when they act with While QoS is well defined, the meaning of QoE is betotal involvement”, which is the main intrinsic motivation ing argued. For instance, the standardization group ITU-T for people to perform activities that provide no discernible suggests that QoE should be represented by Mean Opinion extrinsic rewards [12]. When in the flow state, people focus Score (MOS), a Likert-scale rank for subjective testing of their full attention on the task at hand; they perceive a sense voice/video quality [1]. Beauregard et al. formulated QoE of control and great enjoyment. The intense experiential inas “the degree to which a system meets the target user’s tacit volvement is a natural moment-to-moment flow of mind, and and explicit expectations for experience” [6]. Some other inis found universal in human activities such as reading, chess formal definitions are “subjective measure of a customer’s playing, and rock climbing [13]. Flow was originally charexperiences with a vendor”, “user perceived performance”, acterized via eight components, including clear goals, feedand “the degree of satisfaction of users”. back, challenge/skill balance, concentration, sense of conIn the various formal and informal definitions, QoE has trol, loss of self consciousness, distorted sense of time, and been framed as a subjective measure. According to psyintrinsic enjoyment. Although these are valuable compochology theories [36], environmental stimuli greatly influence nents, the flow concept was too broadly defined, failing to one’s cognitive perceptions, and in turn shape behavioral incapture some specific characteristics of the technological ententions and outcomes. If we treat technological systems as vironments. Subsequent research on computer-mediated inthe “environments”, their influences, quantified by QoS metteraction has adapted its list of metrics [21, 23, 31]. Based on rics, may lead to subjective and objective responses of users, our empirical findings in previous research [45, 53], we idenboth of which we consider part of the “user experience”. Our tify three metrics that are significantly relevant to DIMEs: definition for QoE thus follows. concentration, intrinsic enjoyment, and sense of control. Perceived Technology Acceptance. The flow metrics Definition: QoE is a multi-dimensional conconvey the psychological experience of users without construct of perceptions and behaviors of a user, which sidering the technological environments. We use the Techrepresents his/her emotional, cognitive, and benology Acceptance Model (TAM) [15] to further account for havioral responses, both subjective and objective, user’s perceptions/attitudes toward the technology in the while using a system. role of a technology user. The perceived usefulness and perceived ease of use are the two belief variables of TAM. The Figure 1 illustrates the general relationship between QoS former represents “the degree to which a person believes and QoE. Notice that QoE is not only influenced by the that using a particular system would enhance his/her pertechnological environment, but also by the human factors formance”, whereas the latter defines “the degree to which a that strongly embed user’s experiences and cultural backperson believes that using a particular system would be free grounds2 . of effort”. The flow metric “sense of control” and the TAM’s belief variable “perceived ease of use” are strongly related, 4. USER EXPERIENCE MODELING and are thus combined into one. According to the theory of In this section, we present the quality framework in DIMEs reasoned action [17], beliefs about the consequences of peralong with its theoretical foundations. The research methodforming the behavior largely shape one’s behavioral intenology is to consider user’s multiple roles for the modeling of tions and consequences. By treating DIMEs as IT systems, QoE dimensions (Section 4.1), and heuristically find application- we can apply TAM and examine how the two belief metrics level QoS metrics that can have significant impact on userpredict user adoption of technology. level QoE (Section 4.2). Accompanying the modeling of QoS Telepresence. Users in DIMEs are also participants in 2 remote telecommunication. Telepresence characterizes user’s In this work we mainly focus on the technological influperceptual “sense of being” or “sense of presence” in the ences, and leave the investigation of the cultural and expeholistic communication environment rather than in the real riential influences to future work.
QoS
QoE
Speed Range
Concentration
Interactivity
Flow
Mapping
Breadth
Enjoyment
Vividness
User
Depth
Temporal
Performance Gains
Telepresence
Sense of Being
Objective
Exploratory Behaviors
Technology Acceptance
Spatial
Perceived Usefulness
Technology Adoption
Perceived Ease of Use
Environmental Influences
Subjective
Objective
Influences Consistency
Subjective
Cognitive Perceptions
Intention to Use
Actual Usage
Behavioral Consequences
Figure 4: Quality Framework in DIMEs world. Users have reported their telepresence experience in various ways, e.g., “I’m noticing a different awareness, somewhat like an out of body experience”, “I feel like our body exists in the 3D virtual environment, rather than the real world” [45], “My immediate surroundings became less important and/or noticeable - as if I almost forgot them”, “I felt like I came back to the ‘real world’ after a journey.” In fact, the difference between virtual reality and other media was defined as a difference in the level of presence [47]. So the metric is a significant indicator of user experience in DIMEs.
4.1.2
Behavioral Consequences
Behavioral consequences are the results of cognitive perceptions (Figure 1). They can be subjective or objective. Subjective consequences refer to one’s perspectives and desires, which are only available in the subject’s consciousness. Objective consequences, in contrast, refer to one’s actual conducts, actions, and performances, which can generally be observed and quantified. We analyze three dimensions of behavioral consequences: performance gains, technology adoption, and exploratory behaviors. Performance Gains. Performance gains represent the amount of increase in user’s performance on certain tasks, which can be measured subjectively and objectively. The metrics of this dimension depend on the actual application environments and task requirements. Researchers usually design controlled studies to quantify performance gains in well-specified tasks, where the widely used metrics are the ratio of successful attempts and completion time [44]. It is hypothesized that cognitive experience is positively correlated with performance gains. Technology Adoption. Intention to use (subjective) and actual usage (objective) are the two variables for technology adoption. They are directly related with user’s perceptual ‘technology acceptance’ (Section 4.1.1). For technological systems, intention to use is regarded as the major subjective metric in user experience evaluation [25, 27, 31, 41]. An advantage of this metric is its relative ease of assessment. Its objective counterpart - actual system usage - is an important indicator for the extent of technology adoption. Nevertheless, researchers need to observe users over time to quantify this metric (e.g., six months of field study [49]), which can be challenging in controlled studies. According to the theory of planned behavior [3], behavioral intention is a strong
predictor of actual behaviors. Thus, “intention to use” often becomes the substitute in actual evaluations [27]. Exploratory Behaviors. Exploratory behaviors represent user’s spontaneous exploration of the technology with no particular preset plans or goals. It has been shown that cognitive perceptions are positively correlated with the yield of exploratory behaviors [21]. Exploratory behaviors can be measured subjectively and objectively. The metrics here are application-specific as those for performance gains. As a simple example, in evaluating web-based services, researchers would ask users to rate for statements like “I often click on a link just out of curiosity” and ”Surfing the web to see what’s new is a waste of time” (reverse-scaled) [40]. The actual amount of exploratory behaviors can be measured objectively by observing users in uncontrolled studies. Figure 4 outlines the QoE construct, its dimensions and metrics that we have identified and modeled in terms of their inter-relationships.
4.2
QoS Construct
In environmental psychology, the term “environment” is broadly defined to include natural, built, cultural, social, and informational settings [22]. In DIMEs, the technological environment serves as the primary context, bringing the most direct and significant impact on QoE. A variety of QoS metrics have been used to quantify the performance of systems. However, QoS lacks a conceptual framework of classification. We study the application-level QoS metrics that can directly influence QoE (Figure 3), and provide a taxonomy of such metrics in DIMEs. Jonathan Steuer [47] proposed two dimensions of telepresence: vividness and interactivity, both of which we find essential for creating compelling user experience in DIMEs. In the quality framework, we label “telepresence” as the cognitive perception, and its two dimensions as the environmental influences (refer to Figure 1). Vividness means “representational richness of a mediated environment” [47] which is modeled by the amount of sensory information simultaneously presented to the users. It has two dimensions: breadth and depth, where breadth refers to the number of sensory channels, while depth refers to the resolution in each of these perceptual channels. Vividness breadth can translate to a number of metrics in DIMEs, including the presence of media channel (e.g., visual, auditory, haptic, textual, graphical), and end device sensing range
Telepresence
QoE Metric Local Operation
Vividness
Interactivity
Consistency Need Propagate?
Breadth
Depth Speed Range Mapping Temporal
Spatial
Y
QoS Metrics
Buffered
Global CS Delayed CS N
Partial CS
Execute
Propagate to Remote Sites
Figure 5: Dimensions of Telepresence (adapted from [47])
Wait until All Ready
Y
Absolute CS
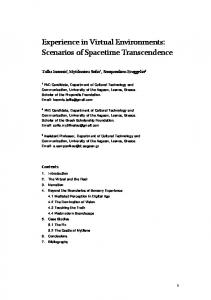
(e.g., camera, microphone). Vividness depth corresponds to metrics such as peak signal to noise ratio (PSNR), image/audio resolution, 3D depth resolution, haptic feedback accuracy, visual tracking precision, video frame loss, and audio amplification factor. Interactivity represents “the extent to which users can participate in modifying the form and content of a mediated environment in real time” [47]. There are three factors that express interactivity: speed, range, and mapping. Speed refers to the rate at which user input can be assimilated to the environment. This metric is directly related to end-to-end delay, one of the most critical QoS metrics in DIMEs [50]. Other metrics include reaction/response time, image freeze time, jitter, video frame rate (capturing, rendering), audio nominal rate, and graphics update rate. Interactivity range represents the scale of control options for users to change the mediated environment. A typical example in DIMEs is the ability to change viewpoint in a holistic 3D environment. Other commonly used metrics are interface flexibility, customization degree, number of control options, number of accessible parameters. Finally, interactivity mapping measures the capability of the DIMEs to map user control to actual changes in the mediated environment, i.e., how natural and intuitive the user interface is, which is generally applicable to all human-computer interactions. Consistency. An essential concern for DIMEs is not addressed in Steuer’s telepresence model: consistency. The consistency requirement has been formally modeled in the human communication theory [46], where the term is coined as mutual manifestness. Therein, the communicative principle states that facts in the communication environment should be mutually conveyed to the participating agents; otherwise, the difference of perceived contexts will lead to misunderstanding and confusion. In the traditional face-to-face settings, the actual environment is naturally consistent to everyone physically present. When it comes to virtual reality, however, consistency has to be explicitly achieved by proper design and implementation of the mediation systems. There are two dimensions of consistency in DIMEs: spatial and temporal. Spatial consistency refers to the topological scale of state synchronization, i.e., a site may know a subset (partial consistency) or total set (global consistency) of states in the system (as illustrated in Figure 6). In large-scale systems, it is often not practical or necessary to achieve global spatial consistency. So a player in MMORPGs only gets updates from those players in proximity though many others can be in the same session. The commonly used metrics for spatial consistency include coverage, completeness, and consensus. Temporal consistency refers to the degree of time synchronization of all states in the DIME systems, which is hypoth-
Temporal Consistency
Spatial Consistency
Figure 6: Temporal and Spatial Consistency (CS) Models in DIMEs
esized to impose a more significant impact on user QoE than its spatial counterpart. In DIMEs, the local states are exchanged over networks to create the shared communicative context for everyone, which inevitably incurs inconsistencies due to the existence of propagation delays, lossy links, etc. Researchers have proposed conceptual models to characterize temporal consistency in distributed environments. Figure 6 illustrates the absolute consistency and delayed consistency models for DIMEs [43], where the former ensures that all operations execute at the same time across the system and the latter trades the degree of consistency for response time by allowing local operations to instantaneously take effect. The corresponding QoS metrics for temporal consistency include phase difference, dropping ratio (due to synchronization), uniformity of flow, drift distance, and continuity. In summary, we identify three important dimensions of QoS that are tightly connected to DIMEs: context vividness, interactivity, and consistency, as shown in Figure 4. How the DIME is designed on these QoS dimensions directly shapes the user experience.
4.3
Comparison
In this section, we fit the existing work on DIME evaluation into the quality framework, and examine how the constructs cover the cases in reality. In total, there are three components in the causal chain framework: (1) environmental influences, which include variables: Interactivity Speed (IS), Interactivity Range (IR), Interactivity Mapping (IM), Vividness Breadth (VB), Vividness Depth (VD), Temporal Consistency (TC), and Spatial Consistency (SC), (2) cognitive perceptions, which include variables: Flow Concentration (FC), Flow Enjoyment (FE), Telepresence (TP), Perceived Usefulness (PU), and Perceived Ease of Use (PEU), and (3) behavioral consequences, which include variables: Performance Gains (PG), Exploratory Behaviors (EB), and Technology Adoption (TA). Table 1 summarizes the fitting results. We observe that most of the existing studies have considered a small subset of these measures (max ratio = 6/16, min = 1/16). IR and TA are among the least used ones, due to their difficulty of evaluation and quantification in reality. SC is also rarely evaluated as it is less discernible by users compared to TC.
Table 1: Existing DIMEs and the factors considered in their evaluations. Environmental Influences Cognitive. Perceptions Behav. Consq. IS IR IM VB VD TC SC FC FE TP PU PEU PG EB TA √ √ √ √ √ [4, 32] √ √ √ √ [7] √ √ √ [9] √ √ √ √ √ √ [14] √ √ √ √ √ [18] √ [19] √ √ √ √ √ √ [25] √ [30] √ √ √ √ [38] √ √ √ √ [44] √ √ [54]
5.
EMPIRICAL MAPPING BETWEEN QOE AND QOS
In this section, we present an empirical mapping methodology to correlate QoS metrics with QoE. We also describe two empirical studies conducted in a 3DTI DIME system as simple, practical examples.
5.1
Mapping Methodology
We understand the conceptual causal relationship from QoS and QoE, but how are the individual metrics related? It is important to assess the mapping relations in a finer granularity to provide more useful design implications. In the QoS research, analytical frameworks have been developed to mathematically compute the correlations between QoS metrics. For example, Nahrstedt et al. [39] presented a QoS broker model, in which equations were developed to translate application QoS requirements to network QoS requirements, e.g., from sample loss rate to packet loss rate and from sample rate to traffic interarrival time. When we study the QoS-QoE mapping, however, such analytical methodology can hardly apply because of the gap between the subjective QoE metrics and objective QoS metrics. As a result, methodology of empirical studies is developed. We describe the three steps of the empirical methodology as follows. 1. Specify the metrics in each dimension of the QoS and QoE model. The selection of QoS metrics is applicationspecific, thus it is important for DIME designers to characterize and examine the application environment. The QoE metrics are much more general, and those captured in the framework (Figure 4) can be directly adopted. 2. Collect measurements of these metrics by conducting empirical experiments. For QoS metrics, a quantitative evaluation of the application performance is needed. For QoE metrics, the subjective metrics such as concentration and enjoyment can be measured by collecting questionnaire responses using Likert scale, whereas the objective metrics such as the actual system usage and performance gains can be quantified by logging and calculating experimental outcomes. The QoS metrics can be tuned in the system to acquire different user responses under different circumstances. Furthermore, experiential experiments may be needed to observe exploratory behaviors of users. This may require
the researchers to conduct field studies to record user behaviors while they use the applications. 3. Compute the correlations between measured pairs of QoS and QoE metrics, analyze measurements, and bind the resultant correlation values with their statistical significance. This step helps us understand which factors in QoS contribute to which factors in QoE and how large the individual contribution becomes. The QoS/QoE correlations and contribution factors can provide significant implications for application designers and guide them to make more educated decisions in the parameter tradeoffs according to QoE requirements of the users. Subjectivity v.s. Objectivity. Cognitive scientists distinguish the actual physical environments from the cognitive environment [46], because an individual’s total cognition is a function of her physical environment and her cognitive abilities. This indicates that subjective and objective measurements on the same metrics can lead to different results. Let us consider the subjective and objective metrics for interactivity. Subjective results can be obtained by having the users rank the noticeability or disruptiveness of delay as they perceive on a Likert scale. Objective measurements can be performed on the system to find out the actual latency in the unit of time. These results can differ greatly due to the user’s visual perception ability. In the context of DIMEs, the cognitive abilities of users generally translate to the perceptive thresholds on different dimensions of sensory information (e.g., auditory, visual, haptic). The gap between one’s cognitive environment and the physical environment should be taken into account in the evaluation of DIMEs (a good example can be found at [20]). Next we present our empirical studies to illustrate the application of the methodology in practice.
5.2 5.2.1
Task-Specific Experiments Experimental Setup
We recruited sixteen users to participate in four sets of task-specific experiments. Since the activities involved intense physical movement (e.g., rope jumping), college students (both undergraduate and graduate) were recruited, with nine female and seven male. We set up two separated 3DTI testbeds in the lab to simulate distributed environments. Each testbed contained a plasma display and two
Testbed 1
Testbed 2
Display of 3D Virtual Space
Audio/Video Streaming
Figure 7: Experimental Setup 3D camera clusters that were placed in a vertical axis to capture full human body. The 3D representations of users from two testbeds were merged into a joint virtual environment in real time for interaction. Figure 7 illustrates the setup. As a simple example of the empirical methodology (Section 5.1), we identified metrics, collected data, and computed the correlations. The metrics listed in Figure 4 were used except ‘exploratory behaviors’ and ‘technology adoption’ which are hardly observed in the controlled studies. As a demonstrating example, we translated ‘interactivity’ to the QoS metric end-to-end delay, and ‘vividness breadth’ to the richness of communication channels (audio, video). The other used metrics are self-exploratory. Both objective and subjective data were collected. For subjective measurements, a post-test questionnaire was filled up by each participant to answer descriptive questions on each metric. A Likert scale of seven points (1: strongly disagree, 7: strongly agree) was used for all questions. For objective measurements, we recorded the performance of users, where the ratio of successful attempts and completion time were mainly used as the metrics for ‘performance gains’. With the collected data, we performed correlation tests between pairs of the QoS and QoE metrics, along with a statistical assessment of significance.
5.2.2
Experiment 1
This experiment was to study the impact of QoS metrics ‘interactivity’ and ‘consistency’ on QoE metric ‘performance gains’. We simulated the geographically distributed setup by artificially introducing one-way communication delays from Testbed2 to Testbed1 (remote delay) as well as inside the Testbed1 (local delay). Delays were set according to the real-world values we measured among the Internet2 nodes across the country. Figure 8(a) shows a small sample of measured delays (in ms) with respect to the geographical distances. We found that a majority of nodes had around 10ms, 30ms, and 70ms of one-way propagation delay between them, which became the values we used over the existent end-to-end delay (from capturing of a frame to rendering of it) of about 50ms in the system. To stress the system on interactivity and consistency, we chose the task of rope jumping. Specifically, one participant rotated a real rope in Testbed2, the other in Testbed1 tried to jump over it virtually by watching the display. With an increase of delay, displays might become inconsistent for the participants, with Testbed1 having the most delayed views. It was also expected that this would cause the participants to miss the jump over the rope as seen in the display of Testbed2. Nonetheless, to minimize the learning effect of users we randomized the injected delays for all experiments. Also, the
users were not told the actual delay values until they finished the experiments and the questionnaires. We gathered the number of successful jumps observed by the users in each testbed with varying artificial delay. The results are shown in Figure 8(b) and they represent the empirical mapping from the QoS metrics ‘interactivity (speed)’ and ‘consistency’ to the QoE metric ‘performance gains’. As expected, the user performance, measured as the ratio of successful jumps, generally degraded with the increase of delays, as observed in both testbeds. The drop was about 50% from the delay of 80ms to 120ms. The correlation of the gathered data (refer to the right y axis) indicates the subjective consistency between the two testbeds. As shown in Figure 8(b), a high level of consistency existed up to 80ms delay (i.e., 30ms artificial) and reduced sharply when the delay reached 120ms (i.e., 70ms artificial delay which was measured between West Coast and East Coast in the U.S.). Figure 8(c) shows the correlation between the subjective responses of users (on the notability and perceived disruptiveness of the delay) and the objective delay metric. When the end-to-end delay was below 80ms, it was hardly noticeable by the users. However, when increased to 120ms, it not only became perceptible, but also disruptive or distracting.
5.2.3
Experiment 2
The second experiment was to evaluate the impact of visual context quality on user experience. The parameter being varied was the spatial congestion of the virtual space, which mapped to the number of people in the virtual space. The task was a simple charades game between pairs of participants in two testbeds. The participant in Testbed2 tried to guess the actions performed by the participant in Testbed1 without any conversations between them. The only communication channel was the joint visual virtual space. We limited the time of each guess to 30 seconds and recorded the timing of each successful guess. The experiment was done with 2, 3, and 4 users in the virtual space, which emulated the scenarios of distributed collaboration of 2, 3, 4 sites. As shown in Figure 8(d), the user performance became little affected (percentage of successful attempts) by the crowd in the virtual user space. The percentage of successful attempts decreased less than 10% when we increased the number of users in the virtual space from 2 to 4. With the reasonable congestion in the virtual space (as the scale of collaboration grows), users could still perform fairly well without being too distracted.
5.2.4
Experiment 3
We designed the third experiment mainly to understand the effect of communication channel richness as an example of vividness breadth. The task was a drawing game. The participant in Testbed1 was given certain drawings of simple and complex shapes and signs. The participant in Testbed2 had to draw them correctly within 30 seconds each. There were three ways of communication tested: audio only, visual only, and audio-visual. The hypothesis was that increased context richness should lead to increased QoE. We recorded the performance of participants, with the result shown in Figure 8(e). The average completion time to draw decreased significantly in the audio-visual setup. Also the number of successful attempts increased sharply in this case compared to the use of audio only. We also asked for
0.7
80 16 70 14 60 12
50
3 Number of users in virtual space
0.6
0.5
0.5
0.4
0.4
50
60 70 80 90 100 110 One way communication delay (ms)
4
Average completion time Percentage of successful attempt
40
(d) Vivid. Depth v.s. Perf. Gains
16 90 14
80
12
10 70 8
audio
visual Communication methods
5
4
4
3
3
2
2
1
1 50
100
6
5
0.3 120
60 80 120 One way delay (ms)
(c) Obj. v.s. Sbj. Interactivity
audio-visual
7 6 Rank on Likert scale
0.6
7
noticeability perceived disruptiveness
Perceived Disruptiveness
0.7
Noticeability
0.8
18 Average completion time (sec)
90
2
6
Percentage of successful attempt
100
Average completion time Percentage of successful attempt
18
10
7
0.9
(b) Interactivity v.s. Perf. Gains
Percentage of successful attempt
Average completion time (sec)
20
1
0.8
0.3
(a) Delay Map
Testbed 1 Testbed 2 Correlattion
Correlation of performance (between Testbed1 and Testbed2)
Performance (successful attemp / total attemp)
1 0.9
5 4 3 2 1
concentration
enjoyment
telepresence
usefulness
ease of use
QoE metrics
(e) Vivid. Breadth v.s. Perf. Gains
(f) QoE Rankings (min-avg-max)
Figure 8: Experimental Results user’s rank to the question “It is important for me to have both audio and visual cues when interacting with a remote partner”, and the average rank was 5.125 (positive) with a standard deviation of 1.78. Other than the above experiments, participants were asked to perform different 3D interactions such as cyber-handshake, cyber-hug, and cyber-fight just to experience the system more. The other important QoE metric measurements are plotted in Figure 8(f), with the minimum, average, and maximum values shown. We observe that individual perceptions on the same environment were very different (e.g., the maximal difference is 6 on a 7-point scale), which indicates the importance of user customization in DIMEs.
5.2.5
Correlation Findings
We computed correlations between the measured QoS and subjective QoE metrics using the consolidated data of the three experiments, and performed a two-tail t-test on the correlation findings. Table 2 presents the results on statistical significance. The correlation graph is presented in Figure 9 showing only the links with strong significance (p < 0.005). The correlation value is labeled on each link. There are several interesting observations. First, the measured correlations between interactivity and the presented metrics appear not strong. This is mainly due to the fact that we averaged the subjective responses for interactivity where the delay was not much noticeable in three of four cases. When the delay exceeds the perceptive threshold, we expect that users would lose sense of control (which corresponds to perceived ease of use), become distracted (less concentration), and feel lower degree of telepresence. Fur-
ther quantitative studies on large interactivity delays need to be performed to confirm the hypotheses. Second, the connection between vividness and several QoE metrics (concentration, perceived usefulness, and perceived ease of use) are among the strongest. The main reason is that the real-time 3D reconstruction algorithms in 3DTI systems are still challenging, so imperfections of images were present, including holes, flickering image, and spikes. This turned out to be the factors that affect uers’s QoE most in the system. Third, we compare the results for objectively measured consistency (labeled ‘Consistency-Obj’) and subjectively rated consistency (labeled ‘Consistency-Sbj’). The correlations results are very different, where only Consistency-Sbj has a strong correlation with ‘Concentration’. Relating to the results shown in Figure 6, we find this connection very reasonable because perceived inconsistency led to focus distraction. The disagreement between the subjective and objective results is reminiscent of the theory that there is a gap between the actual environment and the cognitive environment (Section 4.2).
5.3
Experiential Experiments
Exploratory behaviors can hardly be measured in controlled studies with well-specified tasks. We present some of the results obtained in a field study with about twenty professional artists for over a year. There were no defined tasks, nor did we measure perceptions or performances. The main goal was to observe and record their exploration within the system. The creativity of the artists led to a lot of interesting behaviors that surprised us. While the engineers were ea-
Concentration −5.64/ ∼ 0 −6.88/ ∼ 0 −6.46/ ∼ 0 −3.76/ ∼ 0
Interactivity Vividness Consistency-Obj Consistency-Sbj
Table 2: Data Enjoyment −0.66/0.52 −3.08/0.004 −1.21/0.23 −0.35/0.73
Analysis (t-value/p-value) Teleprescence Perceived Ease of Use −1.59/0.12 0.81/0.42 −3.66/0.001 −1.96/0.06 −2.10/0.041 0.31/0.76 −1.10/0.28 0.71/0.49
ger to improve on various QoS metrics (e.g., image quality, time synchronization, end-to-end delay), the artists desired retaining the imperfections of the system, with which they could make innovative improvisations (so called “glitch art”). As an example, due to a parameter configuration error the images of persons once became extremely ‘spiky’ with a lot of long triangular facets, but the artists requested the engineers to hold debugging, and went into the scenes, acting as if they had superpowers (e.g., with the effects of stretching arms) as seen in animation films. There was another time when the images of the upper and lower cameras became out of sync due to a software bug. While the engineers were trying to figure out the problem, one of the artists made an improvisation piece with her legs always moving seconds after the torso. Due to the space limit, we cannot enumerate all exploratory behaviors that were observed, but they all raised interesting questions, enhancing our understanding about the measurements of user experience and its relationship with system performances.
6.
CONCLUSION
In conclusion, this paper is a significant step toward a general theoretical framework of QoE for multimedia applications. We construct a quality framework in the context of DIMEs with conceptual models of quality metrics for QoS and QoE. A methodology is presented to identify mappings between the two constructs, accompanied with empirical study examples. We foresee many opportunities to apply the quality framework and mapping methodologies in the design and evaluation of DIMEs. Application practitioners can systematically find out the weighted contributions between quality metrics,
QoS
QoE Concentration 0.09
Interactivity
0.39 0.12 -0.16
Enjoyment
0.41
Vividness
-0.02
Telepresence
-0.13 Consistency-Obj -0.06
0.58 0.53
Consistency-Sbj
0.14
Perceived Usefulness
Perceived Ease of Use
Figure 9: Correlations among Constructs
Perceived Usefulness −2.90/0.007 −4.71/ ∼ 0 −3.46/0.001 −2.05/0.05
thereby gaining a better understanding about the design choices on different QoS parameters. The presented framework also provides a conceptual basis for QoE specification where users can convey and evaluate their requirements. Our future plans include exploring the relationship from QoE to QoS in service composition and adaption, and conducting more extensive user experiments to exhaustedly quantify the metric correlations in DIMEs.
7.
ACKNOWLEDGEMENT
We thank our collaborators Gregorij Kurillo, Ruzena Bajcsy, and Peter Bajcsy for their great support. We also thank the anonymous reviewers for their valuable comments. The research is funded by National Science Foundation (NSF). Any opinions, findings, and conclusions or recommendations expressed in this material are those of the author(s) and do not necessarily reflect the views of the NSF.
8.
REFERENCES
[1] Subjective audiovisual quality assessment methods for multimedia applications, 1998. ITU-T Rec. P.911. [2] Quality of experience: A strategic competitive advantage of microsoft unified communications. In Whitepapers, Microsoft Inc., 2007. [3] I. Ajzen. The theory of planned behavior. Organizational behavior and human decision process, 50(2):179–211, 1991. [4] J. N. Bailenson et al. The effect of interactivity on learning physical actions in virtual reality. Media Psychology, 11:354–376, 2008. [5] H. H. Baker et al. Understanding performance in coliseum, an immersive videoconferencing system. ACM TOMCCAP, 1(2):190–210, 2005. [6] R. Beauregard et al. User experience quality: A conceptual framework. In LNCS’07, 2007. [7] A. Bharambe et al. Colyseus: a distributed architecture for online multiplayer games. In Proc. of NSDI’06, pages 155–168, 2006. [8] Blizzard Entertainment, Inc. http://bit.ly/8w7ul. Accessed June 2009. [9] M. Chen. Design of a virtual auditorium. In Proc. of ACM MM’01, pages 19–28, 2001. [10] Cisco TelePresence. http://cisco.com/telepresence/. [11] E. Cronin et al. An efficient synchronization mechanism for mirrored game architectures. In Proc. of NetGames’02, pages 67–73, 2002. [12] M. Csikszentmihalyi. Flow: The Psychology of Optimal Experience. Harper and Row, 1990. [13] M. Csikszentmihalyi. Finding Flow: The Psychology of Optimal Experience. Basic Books, 1997.
[14] R. Cutler et al. Distributed meetings: a meeting capture and broadcasting system. In Proc. of ACM MM’02, pages 503–512, 2002. [15] F. D. Davis. Perceived usefulness, ease of use, and usage of information technology: a replication. MIS Quarterly, 13(3):319–340, 1989. [16] F. D. Davis et al. User acceptance of computer technology: A comparison of two theoretical models. Management Science, 35(8):982–1003, 1989. [17] M. Fishbein et al. Belief, Attitude, Intention, and Behavior: An Introduction to Theory and Research. Addison-Wesley, 1975. [18] S. R. Fussell et al. Effects of head-mounted and scene-oriented video systems on remote collaboration on physical tasks. In Proc. of ACM CHI’03, pages 513–520, 2003. [19] L. Gautier et al. Design and evaluation of MiMaze, a multi-player game on the internet. In Proc. of IEEE Multimedia Systems Conference, pages 233–236, 1998. [20] E. D. Gelasca et al. On Evaluating Video Object Segmentation Quality: A Perceptually Driven Objective Metric. IEEE Journal of Selected Topics in Signal Processing, 3(2):319-335, 2009. [21] J. A. Ghani et al. Task characteristics and the experience of optimal flow in human-computer interaction. The Journal of Psychology, 1994. [22] R. Gifford. Environmental psychology. Encyclopedia of Human Behavior, 1999. [23] D. L. Hoffman et al. Marketing in hypermedia computer-mediated environments: Conceptual foundations. The Journal of Marketing, 60(3), 1996. [24] HP Halo. http://hp.com/halo/. [25] C. Hsu et al. Why do people play on-line games? An extended TAM with social influences and flow experience. Information Management, 41(7):853–868, 2004. [26] Y. Ito et al. Quantitative assessment of user-level QoS and its mappings. 2005. [27] C. M. Jackson et al. Toward an understanding of the behavioral intention to use an information system. Decision Sciences, 28(2):357–389, 2007. [28] A. Jaimes et al. Human-centered computing: a multimedia perspective. In Proc. of ACM MM’06, pages 855–864, 2006. [29] R. Jain. Quality of experience. In IEEE Multimedia, volume 11, pages 95–96, 2004. [30] N. Kelshikar et al. Real-time terascale implementation of tele-immersion. In Proc. of ICCS’03, 2003. [31] M. Koufaris. Applying the technology acceptance model and flow theory to online consumer behavior. Information Systems Research, 13(2):205–223, 2002. [32] G. Kurillo et al. A framework for collaborative real-time 3D teleimmersion in a geographically distributed environment. In Proc. of IEEE ISM’08, 2008. [33] G. Kurillo et al. Immersive 3D environment for remote collaboration and training of physical activities. In Proc. of IEEE VR’08, 2008. [34] Y.-J. Lin et al. Sync-MS: Synchronized messaging service for real-time multi-player distributed games. In Proc. of IEEE ICNP’02, pages 155–164, 2002.
[35] Medianet. http://www.cisco.com/web/solutions/medianet. Accessed March 2009. [36] A. Mehrabian et al. An approach to environmental psychology. MIT Press, 1980. [37] S. Moebs. A learner is a learner, is a user, is a customer - qos based, experience-aware adaptation. In Proc. of ACM MM’08, pages 259–268, 2008. [38] F. Mueller et al. Exertion interfaces: sports over a distance for social bonding and fun. In Proc. of ACM CHI’03, pages 561–568, 2003. [39] K. Nahrstedt et al. The QoS broker. IEEE Multimedia Magazine, 2(1):53–67, 1994. [40] T. P. Novak et al. Measuring the customer experience in online environments: A structural modeling approach. In Marketing Science, 2000. [41] H. Nysveen et al. Intentions to use mobile services: Antecedents and cross-service comparisons. Journal of the Academy of Marketing Science, 33(3):330–346, 205. [42] Polycom Telepresence. http://www.polycom.com/telepresence. [43] X. Qin. Delayed consistency model for distributed interactive systems with real-time continuous media. Journal of Software, 13(6), 2002. [44] A. Ranjan et al. An exploratory analysis of partner action and camera control in a video-mediated collaborative task. In Proc. of ACM CSCW’06, pages 403–412, 2006. [45] R. M. Sheppard et al. Advancing interactive collaborative mediums through tele-immersive dance (ted): a symbiotic creativity and design environment for art and computer science. In ACM MM’08, Interactive Arts Program, 2008. [46] D. Sperber et al. Relevance: Communication and Cognition. Wiley-Blackwell; 2 edition, 1996. [47] J. Steuer. Defining virtual reality: dimensions determining telepresence. Journal of Communication, 42:73–93, 1992. [48] S. Tasaka et al. The effectiveness of a qoe-based video output scheme for audio-video ip transmission. In Proc. of ACM MM’08, 2008. [49] V. Venkatesh, M. G. Morris, G. B. Davis, and F. D. Davis. User acceptance of information technology: Toward a unified view. MIS Quarterly, 27, 2003. [50] A. Vogel et al. Distributed multimedia and QoS: A survey. Proc. of IEEE Multimedia, 2(2):10–19, 1995. [51] WebEx. http://www.webex.com/. [52] Wired News. http://bit.ly/dciz2. Accessed June 2009. [53] Z. Yang, B. Yu, R. Diankov, W. Wu, and R. Bajcsy. Collaborative dancing in tele-immersive environment. In ACM MM’06, 2006. [54] Z. Yang et al. Viewcast: View dissemination and management for multi-party 3D tele-immersive environments. In Proc. of ACM MM’07, pages 882–891, 2007. [55] B. Yu. MyView: Customizable Automatic Visual Space Management for Multi-STream Environment. PhD thesis, University of Illinois at Urbana-Champaign, 2006.