Nov 10, 2006 - In SPECT, simultaneous 99mTc/123I acquisitions allow comparison of the .... of Tc-99m/I-123 uptake ratios, a loss of both dopamine receptors ...
INSTITUTE OF PHYSICS PUBLISHING Phys. Med. Biol. 51 (2006) 6157–6171
PHYSICS IN MEDICINE AND BIOLOGY
doi:10.1088/0031-9155/51/23/015
Quantification in simultaneous 99mTc/123I brain SPECT using generalized spectral factor analysis: a Monte Carlo study Sebastien Hapdey1, Marine Soret2 and Irene Buvat3 1 2 3
Centre Henri Becquerel—Rouen University Hospital and QuantIF Laboratory, Rouen, France Hˆopital Inter-Arm´ees Val de Grˆace, Paris, France INSERM U678, Piti´e-Salp´etri`ere Hospital, Paris, France
Received 2 June 2006, in final form 13 October 2006 Published 10 November 2006 Online at stacks.iop.org/PMB/51/6157 Abstract In SPECT, simultaneous 99mTc/123I acquisitions allow comparison of the distribution of two radiotracers in the same physiological state, without any image misregistration, but images can be severely distorted due to cross-talk between the two isotopes. We propose a generalized spectral factor analysis (GSFA) method for solving the cross-talk issue in simultaneous 99mTc/123I SPECT. In GSFA, the energy spectrum of the photons in any pixel is expressed as a linear combination of five common spectra: 99mTc and 123I photopeaks and three scatter spectra. These basis spectra are estimated from a factor analysis of all spectra using physical priors (e.g. Klein–Nishina distributions). GSFA was evaluated on 99mTc/123I Monte Carlo simulated data and compared to images obtained using recommended spectral windows (WIN) and to the gold standard (GS) images (scatter-free, cross-talk-free and noise-free). Using GSFA, activity concentration differed by less than 9% compared to GS values against differences from −23% to 110% with WIN in the 123I and 99mTc images respectively. Using GSFA, simultaneous 99mTc/123I imaging can yield images of similar quantitative accuracy as when using sequential and scatterfree 99mTc/123I imaging in brain SPECT. (Some figures in this article are in colour only in the electronic version)
1. Introduction In brain SPECT, because different diseases can yield similar abnormal tracer distributions, a comprehensive characterization of brain pathology requires additional functional or anatomical investigation (Catafau 2001, Tatsch et al 1991, Walker et al 1997). Dual-isotope imaging has been shown to provide complementary functional information that can help increase the 0031-9155/06/236157+15$30.00 © 2006 IOP Publishing Ltd Printed in the UK
6157
6158
S Hapdey et al
specificity of the diagnosis (Dresel et al 1999, Ichise et al 1999, Yang et al 2004) or that can modify the therapeutic management (Ballard et al 1998, Dresel et al 1998, McKeith et al 1992, Pilowsky et al 1992, Walker et al 1997). With the development of new 99mTc-labelled ligands, dual-isotope 99mTc/123I brain SPECT should provide new insights into the diseases affecting the dopaminergic system (Yang et al 2004). Such applications would clearly benefit from accurate activity quantification to derive physiological indices, such as binding potential, that might help establish early and specific diagnosis (Ichise et al 1993, Soret et al 2003, Tatsch et al 1997). Dual-isotope imaging can be performed either sequentially or simultaneously. In addition to reducing the acquisition time, the major advantage of the latter approach is to provide images of the two tracer distributions in an identical physiological state without any misregistration issue (Devous et al 1992, O’leary et al 1993). However, the associated drawback is the problem of cross-talk, caused by the detection of photons emitted by a radioisotope in the energy window dedicated to the detection of the photons coming from the other isotope. In 99m Tc/123I SPECT, cross-talk is especially severe due to the close emission energies of the two isotopes (140 and 159 keV respectively), which causes both an overlap of the 99mTc and 123 I photopeaks and 123I photons downscattering in the 99mTc energy window. Cross-talk introduces qualitative artefacts and quantitative biases which depend on the 99mTc/123I activity ratios. It is admitted that the images are not trustworthy without cross-talk correction (Links 1996). Several methods have been reported to deal with cross-talk. The most common approach consists in acquiring data in appropriate spectral windows (Ivanovic et al 1994): the 99mTc window is usually centred over the 99mTc photopeak whereas the 123I window is offset towards high energies (Devous et al 1992, Hindi´e et al 1998). It has been shown that using such windows yields large biases in activity concentration estimates compared to activity concentration estimates that would be obtained without cross-talk (Buvat et al 1999, El Fakhri et al 2000). Other approaches use additional spectral windows to estimate the cross-talk components before subtracting them (Brinkmann et al 1999). However, the quantitative accuracy of such approaches has not been thoroughly investigated. A spectral factor analysis (SFA) approach (Buvat et al 1999) has already been proposed to deal with cross-talk in dual-isotope imaging. This approach yielded promising results for quantification of activity ratios. Further investigations by this group, however, demonstrated substantial biases in absolute quantification, i.e. quantification of activity concentration, due to the difficulty in separating unscattered photons from photons scattered with a small angle. In brain SPECT, a neural network (NN) approach has also been described by other groups (El Fakhri et al 1999, Matsunaga and Ogawa 1999) and compared to the SFA approach (El Fakhri et al 2000). In this latter paper, the quantitative accuracy of the NN approach was found to be similar to that obtained using SFA. In this work, however, activity measurements were performed on images not corrected for attenuation, while attenuation accounts for biases in absolute quantification greater than 60% in brain SPECT (Buvat et al 2000b). A more recent paper (El Fakhri et al 2002) showed encouraging results of the NN method on simulations and real phantom acquisitions, although error variability was large. The purpose of this study was to investigate the quantitative accuracy of 99mTc/123I brain SPECT using Monte Carlo simulations when correcting for cross-talk using a generalized SFA approach (GSFA). GSFA overcomes the limits of SFA in terms of absolute quantification by including new priors based on the Klein–Nishina (KN) relationships.
Quantification in simultaneous 99mTc/123I SPECT using GSFA
(a)
(b)
6159
(c)
Figure 1. Simulated 99mTc (a) and 123I (b) activity distributions used to generate the four data sets. Localization of the ROIs used for activity and activity ratio measurements (c). 99mTc/123I
activity concentration ratios in the different compartments for the three data
Data set
Putamen
Caudate nuclei
Cortex
Cerebellum
Insula
Background
Tc-I Tc-I+ Tc+-I
1.66 0.83 3.32
0.80 0.40 1.60
0.83 0.42 1.66
0.73 0.37 1.46
0.80 0.40 1.60
1.00 0.50 2.00
Table 1. sets.
2. Material and methods 2.1. Phantom and simulations To assess the quantitative accuracy of cross-talk corrections in simultaneous 99mTc/123I brain SPECT, 99mTc/123I brain SPECT scans were simulated using the anthropomorphic numerical Zubal head phantom (Zubal et al 1994). One hundred and twenty segmented brain slices were considered and different activity levels were set in six compartments: putamen, caudate nuclei, cortex, cerebellum, insula and all other brain regions labelled as background. The activity levels in the different brain compartments were derived from human and primate neuroreceptor imaging studies involving 99mTc and 123I labelled agents (Dresel et al 1999, Kung et al 1996, Tatsch et al 1991, Verhoeff et al 1993). In order to create a wide range of Tc-99m/I-123 uptake ratios, a loss of both dopamine receptors and dopamine transporters with respect to normal uptake was simulated. Two simulations (Tc-1 and Tc-2) corresponding to the same 99mTc activity distribution and count rate (figure 1) and two simulations (I-1 and I-2) corresponding to the same I-123 activity distribution and count rate (figure 1) were performed. These four simulations were subsequently combined to generate three 99mTc/123I, corresponding to different 99mTc/123I uptake ratios in the different structures, as follows: Tc-I: (Tc-1 + Tc-2) + (I-1 + I-2); Tc-I+ : Tc-1 + (I-1 + I-2); Tc+ -I: (Tc-1 + Tc-2) + I-1. Such data set combinations yielded a range of 99mTc/123I activity ratios from 0.37 to 3.32 in the different compartments of the three resulting data sets as listed in table 1. For each simulation (Tc-1, Tc-2, I-1 and I-2), 3 × 10⁹ photons were tracked. This yielded about 210 million photons detected in the 99mTc 20% energy window (126–154 keV) in the Tc-I data set, 146 million in the Tc-I+ data set and 168 million in the Tc+-I data set. In the 123I
6160
S Hapdey et al
20% energy window (145–178 keV), about 168 million photons were detected in the Tc-I data set, 158 million in the Tc-I+ data set and 94 million in the Tc+-I data set. These unrealistically high numbers of detected events were considered to first assess the validity of the proposed GSFA approach in a nearly noise-free situation. Then, a fourth data set identical to the Tc-I data set but scaled down (with appropriate addition of Poisson noise to the projections) to clinical count rate was considered. The resulting Tc-Iclin data set had about 33 million photons detected in the 99mTc 20% energy window and about 28 million photons detected in the 123I 20% energy window. These count rates were chosen to correspond to a typical clinical situation in our institution (1.11 GBq; 32 steps of 60 s/step). All Monte Carlo simulations were performed using SimSET (Harrison et al 1993) using a model of a Helix gamma camera (Elscint) previously validated in our lab. The effects of parallel collimator geometric response, scatter, attenuation and intrinsic detector response were accounted for in the Monte Carlo simulations. To simulate attenuation, attenuation coefficients corresponding to air, water, blood, bone, brain, muscle, connective tissue and fat were used. The energy response function of the camera was supposed to follow a Gaussian law with the full width at half maximum (FWHM) given by FWHME = R ∗ (E0 )1/2 ∗ (E)1/2
(1)
where FWHME represents the energy resolution at energy E, R = 9.8% and E0 = 140 keV. 128 projections were simulated along a 360◦ circular orbit (radius of rotation = 15 cm) in a 128 × 128 matrix (pixel size = 2.2 mm). Simulations were combined to obtain the four 99m Tc/123I data sets previously described. A series of 16 spectral images from 102 to 178 keV (4.75 keV sampling) was obtained for each projection so that various cross-talk compensation schemes could be applied. 2.2. Cross-talk corrections 2.2.1. Generalized spectral factor analysis (GSFA). In GSFA, the energy spectrum of the photons detected in any pixel of the projections is modelled as a linear combination of K = 5 ‘basis’ spectra to be estimated, namely the 99mTc photopeak pTc, the 123I photopeak pI and three scatter spectra [sk]k = 1,3. This assumption is mathematically expressed as Xi (e) = aTc (i)pTc (e) + aI (i)pI (e) + as1 (i)s1 (e) + as2 (i)s2 (e) + as3 (i)s3 (e) + εi (e)
(2)
where Xi (e) is the number of photons detected in pixel i (i = 1, N; N = 128 ) of a projection in the energy window e (e = 1, P; P = 16 energy windows) and εi(e) represents noise or modelling error. The set of the aTc(i) coefficients associated with the 99mTc photopeak pTc gives the 99mTc scatter-free and cross-talk-free projections. Similarly, the set of aI(i) coefficients associated with the 123I photopeak pI gives the scatter-free and cross-talk-free 123I projections. Solving the model consists in estimating the basis spectra pTc, pI and [sk]k = 1,3 and associated projections. To do so, first, a correspondence analysis of all spectra Xi is performed and yields the orthogonal basis of a Q-dimensional study subspace containing the relevant information underlying all measured spectra (Benali et al 1993). A second step consists in identifying the basis spectra and associated images in the Q-dimensional study subspace given some priors (Benali et al 1994). While in conventional SFA, Q is assumed to be identical to the number K of basis spectra to be estimated (here K = 5), in GSFA, Q can be any value such as K � Q � P (Buvat et al 2000a). Therefore, the five basis spectra of equation (2) can be estimated in a subspace of any dimension Q. Three types of priors were used: (1) the basis spectra and associated coefficients should all be non-negative; (2) 99mTc and 123I photopeaks should be close to Gaussian functions with a mean of 140 keV and FWHM of 9.8% for 99mTc 3
Quantification in simultaneous 99mTc/123I SPECT using GSFA
6161
and with a mean of 159 keV and FWHM of 9.2% (from equation (1)) for 123I; (3) two of the three scatter spectra should roughly represent the 99mTc and 123I first-order scatter spectra, and thus be close to energy distributions derived from the convolution of the Klein–Nishina energy distribution (Klein and Nishina 1929) by the Gaussian gamma camera energy response function with an FWHM varying with energy (equation (1)). An iterative procedure is used to determine the basis spectra and associated coefficients that best meet the priors in a least-squares sense, while keeping εi (equation (2)) of the same magnitude as the Poisson noise present in the SPECT projections (Buvat et al 1998). Unless stated otherwise, GSFA was performed using K = 5 basis spectra and a study subspace of dimension Q = 16 and the three priors previously described. The robustness of GSFA was also assessed with respect to (1) the Q value, which was varied from 5 to 16; (2) the Klein–Nishina priors, which were turned off and on; (3) the energy resolution of the gamma camera, which was supposed to be only imperfectly known; (4) the energy calibration of the gamma camera (correspondence between the energy channel and the corresponding energy range), which was supposed not to be properly known. GSFA was performed using the developer edition of the Pixies software (Apteryx, France)4 . 2.2.2. Conventional energy windows. Projections corresponding to spectral windows WIN recommended for 99mTc/123I imaging (Hindi´e et al 1998) were also created: 99mTc projections corresponding to a 14% centred window (130.5–149.5 keV) were considered while the 123I projections were obtained using an off-peak 15% window (154–178 keV). 2.2.3. Gold standard. Projections including 99mTc unscattered photons only and 123I unscattered photons only were used as a cross-talk-free, scatter-free and noise-free gold standard and are denoted as GS in the following. 2.3. Reconstruction schemes For each isotope, the GS, WIN and GSFA projections were reconstructed using the OSEM algorithm (eight subsets, five iterations) (Hudson and Larkin 1994). Before reconstruction, depth-dependent collimator response was compensated for using the frequency–distance principle (Xia et al 1995). Attenuation was modelled in OSEM using the exact attenuation map used for the simulations. 2.4. Data analysis Count values in the reconstructed 99mTc and 123I images were measured in 3D regions of interest (ROIs) corresponding to the putamen, caudate nuclei, cortex, cerebellum and background (figure 1). These ROIs were manually drawn on the activity images used for the simulations, well inside the actual contour of the physiological compartment in order to reduce the partial volume effect. To assess accuracy in absolute quantification, ROI values obtained from GSFA and WIN reconstructed images were compared with the values obtained from the images reconstructed from GS projections and a per cent difference was deduced: Per cent difference in activity estimate = 4
Apteryx Pixies home page [internet].
measured activity − GS activity × 100. GS activity
(3)
6162
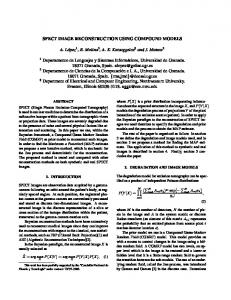
S Hapdey et al I-123 window 154 − 178 keV
Tc-99m window 130.5 − 149.5 keV
counts 50000 40000 30000 20000 10000 0 102
energy 121
140
178
159
Figure 2. Photopeaks (solid lines) and scattered spectrum including scatter from the two isotopes (dashed line), summed over all pixels and all projections for the Tc-I data set. The location of the photopeak windows is also shown. Table 2. Contributions of primary and scattered photons in the 99mTc and 123I photopeak windows for each data set and percentage of primary 99mTc (respectively 123I) photons outside the 99mTc (respectively 123I) photopeak window. Tc-I+ data set
Tc-I data set 99mTc
window
99mTc
Primary 63.0% Scatter 99mTc 11.7% Primary 123I 3.2% Scatter 123I 22.1% Primary photons 5.46% outside photopeak window
123I
window