Available online at www.sciencedirect.com
ScienceDirect Procedia Engineering 192 (2017) 195 – 200
TRANSCOM 2017: International scientific conference on sustainable, modern and safe transport
Quantification of aggregate surface texture based on three dimensional microscope measurement Zuzana Florkováa*, Michal Jamborb a Research centre,University of Zilina, Univerzitna 8215/1,Zilina SK-010 26, Slovak Republic Departement of materials engennering, University of Zilina Univerzitna 8215/1,Zilina SK-010 26, Slovak Republic
b
Abstract At the present time, the usage of optical microscopy allows extension of aggregate surface texture detection methods. Threedimensional data outputs of the aggregate particles can be obtained by these methods and provide additional opportunities in the field of texture evaluation. In this paper, the new approach for quantification of aggregate particle texture is described. Aggregate particles with different texture were scanned by the stereomicroscope and the data files with three-dimensional information were exported. The MicroSYS program was developed to determine new three-dimensional texture evaluating parameter. The Z-plane volume difference characteristic represents aggregate surface texture as a percentage difference between two volumes (aggregate volume and wrapping volume). ©2017 2017The TheAuthors. Authors. Published by Elsevier Ltd. is an open access article under the CC BY-NC-ND license © Published by Elsevier Ltd. This (http://creativecommons.org/licenses/by-nc-nd/4.0/). Peer-review under responsibility of the scientific committee of TRANSCOM 2017: International scientific conference on Peer-review responsibility of the scientific committee of TRANSCOM 2017: International scientific conference on sustainable, sustainable,under modern and safe transport. modern and safe transport Keywords:optical microscopy; aggregate; texture; three-dimensional
1. Introduction Road pavement texture is significant surface characteristics and is mainly affecting pavement friction. In term of road skid resistance is pavement texture categorized (by range of wavelengths) into two categories: macrotexture and microtexture. The effect of macro and micro texture on the pavement skid resistance is closely presented in [1].
* Corresponding author. Tel.: +421 41 513 7632 E-mail address:
[email protected]
1877-7058 © 2017 The Authors. Published by Elsevier Ltd. This is an open access article under the CC BY-NC-ND license
(http://creativecommons.org/licenses/by-nc-nd/4.0/). Peer-review under responsibility of the scientific committee of TRANSCOM 2017: International scientific conference on sustainable, modern and safe transport
doi:10.1016/j.proeng.2017.06.034
196
Zuzana Florková and Michal Jambor / Procedia Engineering 192 (2017) 195 – 200
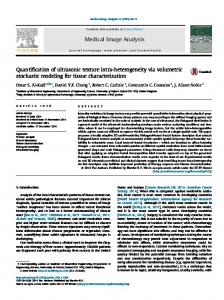
The macrotexture is defined by wavelengths in range 0.5 to 50 mm and is represented by the morphological arrangement of aggregate’s grains on pavement surface. Microtexture is defined by wavelengths less than 0.5 mm and its importance consist in providing basic level of friction between tire rubber and the pavement surface. This scale of texture is represented by properties of particular aggregates used in pavement and is specifically defined as a configuration of particular peaks on the aggregate surface [2]. Consequently, the aggregates as a core material of asphalt pavement by their properties (mineralogy, petrology and especially surface texture) predetermine the microexture level of pavement surface. A wide range of measurement methods have been developed for quantifying of aggregate surface texture and a lot of different approaches have been developed for its evaluation. However, taking into account their wavelength (micron scale), the possibility to accurate quantification is still problematic. Currently, digital image analysis methods (various complex systems, laser scanner, photogrammetry method or microscopes) are the most extended in this field. These methods generally consist of the image acquisition, the image processing and consequent image evaluation by a numerous parameters. Complex digital image analysis systems use cameras or video to create the three dimensional view of particle [36]. The main disadvantage of these systems is that they allow texture evaluation of particles only by two dimensional parameters, which are mostly based on the shape of aggregate particle. Commonly used texture parameters are described in [8-10]. In general, disadvantage of the two dimensional parameters based on digital image analysis is that these parameters allow to capture only larger peaks on the surface of aggregates particles. As a result of this fact, only the upper part of aggregate texture range is included into the evaluation [7]. The laser scanning device, described in [11-12], uses laser sensors to scan a particle and to generate the three dimensional digital scan file. This method has the same disadvantage as in the case of the above described methods. The entire evaluation is carried out by the two dimensional parameters. The capture of the entire aggregate texture scale values is also problematic, because the laser scanning resolution is only 0.1 mm [7]. Information included in the evaluation of aggregate surface texture on the basis of volumetric parameters could be found rarely. In [13] is presented the photogrammetry method. The principle of this method is in obtaining the coordinates of the aggregate surface from the photography and their subsequent transformation in the three dimensional model. This method enables to include into evaluation only top parts of aggregate particles by texture volumetric parameter Vmp (Peak Material Volume) based on the material ratio curve (Abbott-Firestone curve). It has been a motion for the research with the main object to quantify the texture of aggregate particle using the volumetric parameter by the three dimensional aggregate surface obtained by optical microscopy. 2. Generation of three dimensional aggregate surface model by the optical microscope scanning Optical microscope NIKON AZ 100 was used to scan aggregate particles with different surface texture. The principle of the three dimensional view acquirement by microscope is scanning of aggregate particle by cameras at different Z-axis planes on the microscope stage, which is vertically moved in micro steps by Z-Focus control. Then, the appropriate imaging software by Extended Depth of Focus (EDF) module allows images that have been captured in a different Z-axis to be combined (the so called focus stacking), creating a single all-in-focus image (Fig.1 (a)). (a)
(b)
Fig. 1. (a) Resultant all-in focused image; (b) Virtual 3D view of investigated aggregate particle.
Zuzana Florková and Michal Jambor / Procedia Engineering 192 (2017) 195 – 200
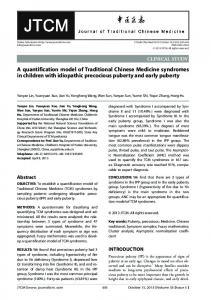
Once the all-in-focus image has been created, it can be viewed and rotated as a virtual 3D image (Fig.1 (b)), as well as displayed as a stereovision image. This view can be exported into the wrml (Virtual Reality Modelling Language) format. This makes possible to view and process the image of the aggregate in three dimension also apart from the original microscope software (Nis Elements D) in different software programs (e.g. in the working background of Matlab program). Then, a program can be used for the following evaluation. Wrml format is a standard file format for representing 3D information and in this case is represented by matrix form of regular placed height points of scanned particle. The mathematic matrix dimensions are 200 points in the x-axis direction and 150 points in the y-axis direction. The accuracy of obtained output depends on the size of scanning area, thus on the required magnification. 3. Determination of three dimensional texture evaluating parameter The new evaluation method was developed in the working background of Matlab program for the purpose of quantification aggregate surface texture. This method uses a three-dimensional model in wrml format, obtained by microscope measurement. The basic principle of this method is in determination of volume between particular peaks on the aggregate surface. In principle, it is a volume between ”real” and convex surface of aggregate particle (Fig. 2). Then, this volume characterizes surface texture of aggregate. The ”real” aggregate surface is expressed in the analytical form and for the aim of evaluation is substituted by a wrapping plane. The wrapping plane is a convex approximation of the analytical function representing the aggregate surface and basically defines the shape of investigated aggregate without peaks. This approximation process uses thin plate spline radial base function. It is an iterative process in which the area of interest on investigated aggregate particle is divided into small local areas. The main selection condition is concave definition of the analytical function in these areas. Subsequently, the concave parts of analytical function of aggregate surface are chosen, replaced and the values of wrapping function are calculated for all selected local concave areas and connected into the final approximation function. The stiffness of thin plate spline function is tuned by the equality of wrapping and analytical function at the boundaries of the local concave areas. Then, the specified function by described process represents a wrapping plane of aggregate surface (Fig. 2). In the following step the volumetric difference between the two planes (aggregate surface and wrapping plane) is calculated. The particular volumes are calculated from the defined comparative plane.
Fig. 2. Three dimensional model of aggregate particle surface with wrapping plane.
Utility of this evaluation method was tested on aggregate particles with different level of texture. Particular aggregates were scanned by the stereomicroscope and the data files with three-dimensional information were exported into the computing program and the procedures described above were used to calculated volumetric differences. The result of experimental measurements and subsequent analysis confirmed that the value of volumetric difference relates to number of concave local areas. It relates also to vertical interval within these areas. Smaller value of volumetric difference means lower suitable texture and reversely. This implies that the higher value of volumetric difference characterizes angular aggregate with more peaks on the surface in comparison to rounded and polished aggregate. For the purpose of achievement of relevant results, it is necessary to determine value of volumetric difference as a percentage difference because of different volumes of individual grains of aggregates.
197
198
Zuzana Florková and Michal Jambor / Procedia Engineering 192 (2017) 195 – 200
As a result of mentioned above parameter Zvd (Z - plane volume difference) was developed. It is a new aggregate three dimensional texture evaluating parameter, which characterizes aggregate texture value by percentage difference of two calculated volumes. First volume is calculated as the volume of the aggregate particle and the second volume is calculated as the volume under the wrapping plane (volume of wrap). For an explanation, data in Table 1 shows comparison of volume differences determined on the aggregate particles with different level of texture where the resultant aggregate texture characteristics is represented by parameter Zvd. Table 1. Comparison of volume differences determined on the aggregate particles with different level of texture. Volume of aggregate particle (μm3)
Volume of wrap (μm3)
Volumetric difference (μm3)
Percentage difference of volumes = 3D parameter Zvd (%)
18794054.16
19234719.46
440665.30
2.34
38099472.47
40155676.31
2056203.84
5.40
33800559.00
37140251.03
3339692.03
9.88
27487836.27
30643440.92
3155604.65
11.48
4. MicroSYS program The new program MicoSYS was developed in the working background of Matlab, which allows quantification of aggregate surface texture based on procedures presented in this paper. Working background of MicroSYS (Fig. 3) program allows height adjustment of the cutting plane in the z-axis direction. It allows evaluation of aggregate texture of only a selected part of aggregate particle. Rotation of cutting plane and stiffness adjustment is also possible in the x and y-axis directions. Options enable to switch between several displays and also their different combinations. It is possible to view the texture as point cloud, wrapping plane display option, cutting plane display option and aggregate surface (mesh) display option. Zoom, rotation and move tools are also available.
Zuzana Florková and Michal Jambor / Procedia Engineering 192 (2017) 195 – 200
Fig. 3. Working background of MicroSYS program.
5. Conclusion A method for quantification and consequent evaluation of aggregate surface texture based on three-dimensional outputs, obtained by microscopy scanning, was presented in this paper. The new three dimensional evaluating parameter Zvd (Z – plane volume difference) and the appropriate calculating program MicroSYS were developed. In comparison to other used detections methods, this approach provides a new quantification possibilities by using the volumes and surfaces and it allows evaluation of aggregate surface texture in more realistic way. The advantage of this method is also that investigated aggregate can be scanned by the microscope in different focusing levels. It enables the capturing of the entire scale of aggregate texture wavelengths and it provides better representativeness of results and high accuracy. It appears that presented results of this research show a potential applicability in current field of aggregate texture quantification and can be used for more complex evaluation of pavement texture. However, to confirm efficiency of presented method, further tests have to be conducted. In future research is planned to carry out a large number of measurements on two aggregate fractions using the aggregate particles with different petrography point of view (ranged from soft to hard) in order to obtain a sufficiently representative aggregate texture value and the subsequent analysis of results. Acknowledgements This research was supported by European project Research Centre of the University of Žilina – Second Phase: ITMS 26220220183 References [1] J.W. Hall et al., Guide for Pavement Friction, NCHRP Web-Only Document 108, February 2009, ISBN 978-0309-42974-0. Available at: https://www.nap.edu/catalog/23038/guide-for-pavement-friction. [2] CEN, EN ISO 13473-5, Characterization of pavement texture by use of surface profiles, Part 5: Determination of megatexture, 2009 Brussels: CEN. [3] M. Sinecen, M. Makinaci, M, A. Topal, Aggregate classification by using 3D image analysis technique, Gazi University Journal of Science, 2011, Vol. 24, No. 4, 773-780. [4] C. Rao, Development of 3-D Image Analysis Techniques to Determine Shape and Size Properties of Coarse Aggregate, Ph.D. Dissertation, Department of Civil Engineering, University of Illinois at Urbana-Champaign, Urbana, IL, 2001. [5] E. Masad et al., Test Methods for Characterizing Aggregate Shape, Texture, and Angularity, Final report – appendixes, National Cooperative Highway Research Program, Appendixes to NCHRP Report 555, 2005. [6] E. Masad, J.W. Button, Unified Imaging Approach for Measuring Aggregate Angularity and Texture, Computer-Aided Civil and Infrastructure Engineering, Vol. 15, 2000, pp.273–280.
199
200
Zuzana Florková and Michal Jambor / Procedia Engineering 192 (2017) 195 – 200 [7] Z. Florková, Usage of 3-D based methods for the detection of aggregate microtexture, Communications scientific letters of the University of Žilina. ISSN 1335-4205. Vol. 17, No. 4, 2015, pp. 70-74. [8] S. Tafesse et al., Evaluation of image analysis methods used for quantification of particle angularity, Sedimentology, Volume 60, Issue 4, June 2013, pp.1100–1110. [9] T. Al-Rousan et al., Evaluation of image analysis techniques for quantifying aggregate shape characteristics, Article in Construction and Building Materials, May 2007, Vol. 21, No. 5, pp. 978-990. [10] Z. Florková, Mikrotextúra hrubého kameniva pre asfaltové zmesi. (Microtexture of coarse aggregate for asphalts). [Diploma thesis]. University of Žilina, Žilina 2012 (in Slovak). [11] J.K Anochie-Boateng et al., Evaluation of 3D laser device for characterizing shape and surface properties of aggregates used in pavements, Paper presented at the 29th Southern Africa Transportation Conference, Pretoria, August 2010. [12] J.K Anochie-Boateng, J.J Komba, G.M. Mvelase, Three-dimensional laser scanning technique to quantify aggregate and ballast shape properties, Construction and Building Materials, Vol. 43, 2013, pp. 389–398. [13] G. Mcquaid et al., Use of Close Range Photogrammetry to Assess the Micro-texture of Asphalt Surfacing Aggregate, Intern. J. of Pavements Conference, Sao Paulo, 2013.