... was analysed by a novel computer program, COMSTAT, which comprises ten features for .... into each flow channel with a small syringe. After inoculation,.
Microbiology (2000), 146, 2395–2407
Printed in Great Britain
Quantification of biofilm structures by the novel computer program COMSTAT Arne Heydorn,1 Alex Toftgaard Nielsen,1 Morten Hentzer,1 Claus Sternberg,1 Michael Givskov,1 Bjarne Kjær Ersbøll2 and Søren Molin1 Author for correspondence : Søren Molin. Tel : j45 45 25 25 13. Fax : j45 45 88 73 28. e-mail : imsm!pop.dtu.dk
1
Molecular Microbial Ecology Group, Department of Microbiology, Technical University of Denmark, DK-2800 Lyngby, Denmark
2
Department of Mathematical Modelling, The Technical University of Denmark, DK-2800 Lyngby, Denmark
The structural organization of four microbial communities was analysed by a novel computer program, COMSTAT, which comprises ten features for quantifying three-dimensional biofilm image stacks. Monospecies biofilms of each of the four bacteria, Pseudomonas putida, P. aureofaciens, P. fluorescens and P. aeruginosa, tagged with the green fluorescent protein (GFP) were grown in flow chambers with a defined minimal medium as substrate. Analysis by the COMSTAT program of four variables describing biofilm structure – mean thickness, roughness, substratum coverage and surface to volume ratio – showed that the four Pseudomonas strains represent different modes of biofilm growth. P. putida had a unique developmental pattern starting with single cells on the substratum growing into micro-colonies, which were eventually succeeded by long filaments and elongated cell clusters. P. aeruginosa colonized the entire substratum, and formed flat, uniform biofilms. P. aureofaciens resembled P. aeruginosa, but had a stronger tendency to form micro-colonies. Finally, the biofilm structures of P. fluorescens had a phenotype intermediate between those of P. putida and P. aureofaciens. Analysis of biofilms of P. aureofaciens growing on 0�03 mM, 0�1 mM or 0�5 mM citrate minimal media showed that mean biofilm thickness increased with increasing citrate concentration. Moreover, biofilm roughness increased with lower citrate concentrations, whereas surface to volume ratio increased with higher citrate concentrations.
Keywords : Pseudomonas, biofilm structure, image analysis, quantification,
INTRODUCTION
In most natural, clinical and industrial settings, bacteria often grow attached to surfaces in communities known as biofilms. Biofilm-associated organisms are able to adapt to environmental changes by altering their gene expression and general physiology (Davies et al., 1993 ; Davies & Geesey, 1995 ; O’Toole & Kolter, 1998 ; Pratt & Kolter, 1998 ; Prigent-Combaret et al., 1999), including increased resistance to antibiotics (Anwar et al., 1992 ; Brooun et al., 2000 ; Costerton et al., 1999). One of the ways in which microbial communities adjust to environmental changes is by changing the structural organization of the biofilm (Dalton et al., 1994 ; Woolfaardt et al., 1994 ; Van Loosdrecht et al., 1995 ; Møller et al., 1997 ; Nielsen et al., 2000). However, .................................................................................................................................................
Abbreviations : CSLM, confocal scanning laser microscopy ; GFP, green fluorescent protein. 0002-4186 # 2000 SGM
the underlying mechanisms for the initiation of biofilm formation and development of structural organization are only just beginning to be discovered. Attempts to describe biofilm structures quantitatively include analyses of thickness variability in Pseudomonas aeruginosa (Stewart et al., 1993), mean thickness and roughness of monoculture and binary biofilms of P. aeruginosa and Klebsiella pneumoniae (Murga et al., 1995), fractal dimension of activated-sludge biofilms (Hermanowicz et al., 1995), and density, porosity, specific surface area and mean pore radius of heterotrophic wastewater biofilms (Zhang & Bishop, 1994). Korber and co-workers determined the minimum area size that should be investigated in order to obtain representative data of P. fluorescens biofilms (Korber et al., 1992, 1993). Lewandowski et al. (1999) defined four variables (textural entropy, area porosity, fractal dimension and maximum diffusion distance) for analysing two-dimensional biofilm images. All four variables were 2395
A. H E Y D O R N a n d O T H E R S
shown to reach a steady state as the biofilm thickness reached steady state. Kuehn et al. (1998) quantified three-dimensional biofilm images using automated image acquisition. The quantification of structures included determinations of bio-volumes and areas of microbial colonization showing differences between monoculture biofilms of P. fluorescens and Escherichia coli EC12. Many studies of biofilms have been performed with pseudomonads as model organisms, reflecting the fact that this family of bacteria play central roles in many different contexts such as nosocomial infections, degradation of pollutants, biological control of pests, and plant growth promotion. Moreover, many Pseudomonas spp. easily form biofilms in laboratory model systems such as flow cells (Palmer, 1999) and the Robbins device system (Kharazmi et al., 1999). Much of the literature on biofilm formation of Pseudomonas spp. comprises qualitative descriptions of biofilm formation of a single Pseudomonas species or mixtures of different species in a given model system (Stewart et al., 1993 ; Korber et al., 1994 ; Møller et al., 1996, 1998 ; Xu et al., 1998). Since the design of biofilm model systems and experimental conditions vary considerably between different laboratories, a comparative study of biofilm formation of different Pseudomonas species cannot be based on the literature. It has been suggested that one of the main factors determining biofilm development is the availability of nutrients in the medium flow and that biofilm heterogeneity is inversely related to the nutrient concentration. Experimental evidence for these hypotheses mainly comes from qualitative descriptions (Van Loosdrecht et al., 1995) and from mathematical models of biofilm development and structure (Wimpenny & Colasanti, 1997 ; Picioreanu et al., 1998a, b). In this communication we describe a novel computer program, , for quantifying biofilm structures. incorporates ten features for quantitative characterization of three-dimensional biofilm images. A comparative analysis of formation and development of monospecies biofilms of Pseudomonas putida, P. aureofaciens, P. fluorescens and P. aeruginosa was performed under standardized conditions. A quantitative analysis of the effect of the nutrient concentration on biofilm structure of P. aureofaciens under standardized conditions was also performed. METHODS Bacterial strains and plasmids. The strains used were P. putida
KT2442 (de Lorenzo et al., 1993), P. aureofaciens ATCC 13985, P. fluorescens SBW25 (Thompson et al., 1995) and P. aeruginosa PAO1 (Holloway, 1955). A PA / / -gfp-T0-T1 " !% !$ transposon cassette was inserted into the chromosome of each of the four Pseudomonas spp. using pUTkn (for P. putida, P. aureofaciens, P. fluorescens) or pUTtc (for P. aeruginosa) as delivery plasmids (de Lorenzo et al., 1990) with the cassette cloned in the NotI sites. These insertions produced stable green fluorescent phenotypes compatible with fluorescence microscopy. The PA / / promoter, derived from the lac " !% !$ (Lanzer & Bujard, 1988) acts as a promoter of E. coli DZ291 2396
.................................................................................................................................................
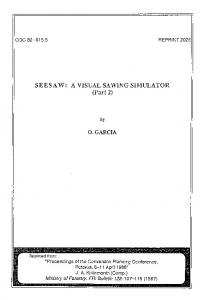
Fig. 1. Phylogenetic affiliation based on 16S rDNA sequences of the four Pseudomonas strains investigated (highlighted) among a number of bacteria belonging to the γ subclass of the Proteobacteria. The calculation of the phylogenetic tree was based on the neighbour-joining method. The tree was rooted with the sequence of Acinetobacter calcoaceticus as an outgroup. The scale bar corresponds to 0n01 substitutions per nucleotide position.
constitutive promoter in Pseudomonas spp. due to the absence of lac repressor activity (Andersen et al., 1998). By tri-parental mating between E. coli CC118(λpir) containing the pUT delivery plasmids, E. coli HB101(RK600) acting as a conjugation helper strain, and each of the Pseudomonas strains, the PA / / -gfp-T0-T1 cassette was inserted at random " !%in!$the chromosomes of the four strains. The selected positions GFP-tagged strains showed no sign of phenotypic changes compared to the parental strains, when tested in liquid medium or flow-chamber biofilms. The doubling times (during exponential-phase growth) of the four GFP-tagged clones growing in citrate minimal medium at 30 mC with vigorous shaking were : P. putida, 51 min ; P. aureofaciens, 81 min ; P. fluorescens, 65 min ; and P. aeruginosa, 89 min. Phylogenetic analysis. Complete sequences of 16S rDNA from representative bacteria belonging to the γ subclass of the Proteobacteria were retrieved from GenBank and the TIGR database (The Institute for Genomics Research, Rockville, MD, USA). The sequences were aligned with the sequence alignment editor in the program (provided by Oliver Strunk and Wolfgang Ludwig, Technical University of Munich, Munich, Germany), and a phylogenetic tree (Fig. 1) was constructed in using the neighbour-joining method of Saitou & Nei (1987). Flow-chamber experiments. Biofilms were grown at 30 mC in three-channel flow cells (Christensen et al., 1999) with individual channel dimensions of 1i4i40 mm, supplied with modified FAB medium supplemented with sodium citrate. The modified FAB medium contained the following components : sodium citrate (0n03 mM, 0n1 mM or 0n5 mM), (NH ) SO (2 g l−"), Na HPO ;2H O (6 g l−"), KH PO (3 g % # %(3 g l−"), MgCl # (93%mg l#−"), CaCl (11 mg# l−"%) and l−"), NaCl # l−"). The trace # metals solution trace metals solution (1 ml contained CaSO ;2H O (200 mg l−"), FeSO ;7H O (200 mg # mg l−"), CuSO ;5H% O (20 # mg l−"), l−"), MnSO ;H %O (20 % O# (10 mg l−"), ZnSO ;7H %O #(20 mg l−"), CoSO ;7H % ;H # O (10 mg l−"), H BO (5 mg % l−"#). The flow system NaMoO % # $ $
Quantification of biofilm structures by was assembled and prepared as described by Christensen et al. (1999). The substratum consisted of a microscope glass cover slip (Knittel 24i50 mm st1 ; Knittel Gla$ ser). Cultures for inoculation of the flow channels were prepared in the following way. A single colony from a plate was used to inoculate test tubes containing modified FAB medium supplemented with 20 mM sodum citrate and grown at 30 mC for 16 h. Cultures were diluted to an OD of 0n1 in 0n9 % NaCl '!! culture was injected and used for inoculation ; 350 µl of diluted into each flow channel with a small syringe. After inoculation, flow channels were left at 30 mC for 1 h. Medium flow was then started at a constant rate of 3 ml h−" using a Watson Marlow 205S peristaltic pump. Mean flow velocity in the flow cells is 0n2 mm s−", corresponding to laminar flow with a Reynolds number of 0n02. Bacterial growth upstream of the flow channels was removed daily in order to avoid the influence of upstream biomass on the flow-chamber biofilms. This was done by cutting off a short piece of tubing just before the flow chamber under sterile conditions and then reattaching the tubing to the flow chamber. Image acquisition. For the analysis of the four Pseudomonas strains, two independent biofilm experiments were performed. In both rounds, each strain was grown in two separate channels, and from each channel seven image stacks were acquired at different time points (24, 48, 96, 168 and 240 h after inoculation). Thus 28 image stacks were analysed for each strain at each time point. For analysis of P. aureofaciens growing with three citrate concentrations, two independent biofilm experiments were performed. In every round, each growth condition was used in two separate channels. In each channel, seven image stacks were acquired at different time points (24, 48, 96, 168 and 240 h after inoculation), again producing 28 image stacks. In all experiments, images were acquired from random positions in the upper part of the flow channel, at a distance of 5–10 mm from the inlet. Images were acquired at 1n0 to 2n0 µm intervals down through the biofilm, and therefore the number of images in each stack varied according to the thickness of the biofilm. All microscopic observations and image acquisitions were performed by confocal scanning laser microscopy (CSLM) (TCS4D microscope ; Leica Lasertechnik). Images were obtained with a 40i\0n75 air objective. Image scanning was carried out with the 488 nm laser line from an Ar\Kr laser. Simulated fluorescence projections, and sections through the biofilms, were generated using the software package (Bitplane AG) running on a Silicon Graphics Indigo2 workstation. Development and implementation of COMSTAT. The program was written as a script in 5.1 (The MathWorks), equipped with the Image Processing Toolbox. The program is menu-controlled, user-friendly, and requires no prior knowledge in programming or image analysis. Prior to quantification, each image stack is thresholded and may be connected-volume filtered (see below). Optionally, the preprocessed image stacks can be saved during execution of the program, and used later to check the input images for the quantification steps. Image information and quantification results are saved in a report file. The image information in the report file includes the name of each image stack, the number of images in the stack, threshold value, filtering method, (pixel size)x, (pixel size)y and (pixel size)z (distance between two consecutive images in the stack). There are several advantages associated with the use of . Most importantly, has a wide variety of functions for handling, analysing and displaying images. Secondly, runs on both PC and UNIX platforms, making broadly available. Moreover, the program codes for each individual image analysis
tool in are placed in separate functions. These functions are called from the core program, and each function returns the result of a specific image analysis task. This programming practice makes clear and easy to understand, and both the core program and the image analysis functions are easily modified according to the specific wishes of individual users. is available free of charge from the homepage at http :\\www.im.dtu.dk\comstat. Image processing by COMSTAT. In , thresholding of the image stacks is performed by applying a fixed threshold value (determined by the user). Thresholding an image stack results in a three-dimensional matrix with a value of ONE in positions where the pixel values in the original image are above or equal to the threshold value, and ZERO where the pixel values are below the threshold value. The value ONE represents positions containing biomass, while ZERO represents the background. Methods for automatic threshold selection for sizing individual fluorochrome-stained bacteria have been published (Sieracki et al., 1989), but these methods are not applicable to CSLM biofilm images. So far, no methods for automatic threshold selection in CSLM images have been reported. Our experience is that in cases where only one operator acquires all image stacks, a fixed threshold value works well for all image stacks. The reason is probably that when adjusting the voltage over the photomultiplier and the offset on the CSLM, the operator automatically adjusts the background to approximately the same grey-level value every time. The background grey-level pixel value would therefore be expected to vary between operators, and this is in fact what is observed. For this reason, only one operator should perform all experiment rounds. Following thresholding, a segmentation process called connected-volume filtration removes biomass pixels which are not in some way connected to the substratum. This is an efficient way of removing noise from the images. Using the layer of biomass at the substratum as starting point, the algorithm moves down the stack of images, determining which pixels are connected to the pixels in the layer below. Remaining unconnected pixel segments are set to ZERO. Morphological transforms for image enhancement such as Top Hat or median filters (Russ, 1994) were deliberately avoided. These methods remove noise by operating on local neighbourhoods in the images. However, a severe side-effect is the simultaneous removal of small details in the images. Small details are especially important for the calculation of the Minkowsky sausage fractal dimension, and for the calculation of the surface area of the biofilm.
RESULTS Confocal microscopy of Pseudomonas spp. biofilms
Fig. 2 shows spatial biomass distributions of P. putida, P. aureofaciens, P. fluorescens and P. aeruginosa in 7-dold biofilms, as they appear by visual inspection of CSLM images. Although the four images are clearly different, it is impossible to obtain detailed and accurate descriptions of how different the four biofilms are, based on visual inspection only. Moreover, each of the four images was generated from a single stack of images covering an area of 62 500 µm# (250i250 µm). Korber et al. (1993) estimated that a minimum area of at least 100 000 µm# should be investigated in order to obtain representative data of P. fluorescens biofilms. Thus, visual inspection of individual CSLM image stacks is neither sufficient nor objective enough for analysing and 2397
A. H E Y D O R N a n d O T H E R S
(a)
(b)
(c)
(d)
.................................................................................................................................................................................................................................................................................................................
Fig. 2. Spatial distribution of 7-d-old flow-chamber-grown biofilms of P. putida (a), P. aureofaciens (b), P. fluorescens (c) and P. aeruginosa (d) expressing GFP. The larger central plots are simulated fluorescence projections, in which long shadows indicate large, high micro-colonies. Shown in the right and lower frames are vertical sections through the biofilms collected at the positions indicated by the white triangles. The scale bars (representing 20 µm) shown in the central plots are also valid for the right and lower frames.
Image analysis program for quantification of structural elements in biofilms
few parameters as possible. Examples of analyses which could advantageously be made by include : (1) analysis of temporal structure development in singlespecies or community biofilms ; (2) comparison of biofilm structures from different organisms or communities under steady-state conditions ; (3) determination of the impact of specific mutations on biofilm structure ; (4) analysis of the influence of different carbon sources or carbon source concentrations on temporal structure development in single-species or community biofilms ; (5) analysis of the influence of antibiotic treatment on the biofilm structure.
Purpose of the measurements. The purpose of the analysis
Experimental reproducibility. Biofilm experiments must be
must be well defined and based on investigations of as
reproducible within reasonable limits. By identifying
comparing structural features of biofilms. We therefore developed a computer program () for quickly and easily analysing large amounts of three-dimensional biofilm image data. works by analysing stacks of images acquired by CSLM, and calculates a number of variables characterizing the three-dimensional structures. Some of the key issues to be considered in the process of quantifying biofilm structures are presented in the following sections.
2398
Quantification of biofilm structures by
and controlling the main factors influencing biofilm formation, such as flow rate, temperature, nutrient composition and the history of the cultures used for inoculation, experimental reproducibility can be improved significantly. However, the development of bacterial biofilms is to a certain extent a stochastic process, and independent rounds of biofilm experiments therefore never result in exact structural copies, even if the experimental conditions are kept constant. A statistical analysis of experimental reproducibility of biofilm experiments is presented in the accompanying paper (Heydorn et al., 2000). In the present study, reproducibility was addressed by analysing data from two separate rounds of biofilm experiments. In each round, each of the four Pseudomonas strains was grown in two different flow channels. Selection of variables. In principle, an infinite number of variables can be used to describe the shape of threedimensional objects. However, some variables (e.g. biovolume and surface to volume ratio) are easier to interpret in biological and physical terms than others (e.g. fractal dimension). This does not mean that variables for which it is difficult to assign a biological meaning are always less significant ; they may simply contain a more complex pattern of information. comprises ten image analysis features (discussed below) for quantification of biofilm structures : (1) Biovolume, (2) Area occupied by bacteria in each layer, (3) Thickness distribution and mean thickness, (4) Identification and area distribution of micro-colonies at the substratum, (5) Volumes of micro-colonies identified at the substratum, (6) Fractal dimension (by Minkowsky sausage), (7) Fractal dimension (by the cross-correlation function), (8) Roughness coefficient, (9) Distribution of diffusion distances, average and maximum diffusion distance, (10) Surface to volume ratio. A few of the features in only calculate a single variable characterizing an image stack, whereas most of the features calculate several variables and\or distributions characterizing an image stack. In the present study, only single-valued variables were considered.
Although it is theoretically possible to use all of the variables calculated by , in most cases a few suffice. The number of selected variables corresponds to the dimensionality of the variable vector used to describe the three-dimensional structure, and to make a subsequent multivariate analysis robust it is important to use a reasonably small number of variables (for details see Hughs, 1968). There are several different statistical methods for selecting variables. All of these methods work by selecting variables which provide the best separation of groups (e.g. strains) known to be different (Fukunaga, 1972). However, this is not a good criterion, when it is not known whether two groups really are different with respect to biofilm structure. Serious problems with the interpretation of the experimental results may occur if variable selection is performed on groups known to show no difference in behaviour. In most cases it makes sense to simply select the variables
on the basis of their biological and physical interpretations in relation to the purpose of the experiments. The data volume to be analysed depends on the number of image stacks acquired and on the number of variables selected. In many cases, the data can be presented by suitable plots such as : (1) each variable against time in order to study temporal patterns ; (2) two variables against each other, e.g. in order to discriminate between different communities at fixed time points ; (3) each variable as a function of changing external conditions, such as different nutrient concentrations or different antibiotic concentrations. If the data are assumed to be normally distributed, parametric analysis of variance techniques can be used to quantify the results. The simplest method is the t-test, which can be used for single-variable tests, whereas Hotelling’s T# test can be used for two- or multi-variable tests (Morrison, 1990). A univariate or multivariate analysis of variance would be more complicated and would include factors describing variance coming from each round, each channel, each strain, each time point, etc. Multivariate statistical analysis is usually quite complex, and has not been included in the present analyses.
Analysis of results.
Features calculated by COMSTAT
In the following sections, the image analysis features in are described. Bio-volume. The bio-volume is defined as the number of biomass pixels in all images of a stack multiplied by the voxel size [(pixel size)xi(pixel size)yi(pixel size)z] and divided by the substratum area of the image stack. The resulting value is biomass volume divided by substratum area (µm$\µm#). Bio-volume represents the overall volume of the biofilm, and also provides an estimate of the biomass in the biofilm. Area occupied by bacteria in each layer. This is the fraction of the area occupied by biomass in each image of a stack. The substratum coverage is the area coverage in the first image of the stack, i.e. at the substratum. Substratum coverage reflects how efficiently the substratum is colonized by bacteria of the population. Thickness distribution and mean thickness. This function locates the highest point (µm) above each (x,y) pixel in the bottom layer containing biomass. Hence, thickness is defined as the maximum thickness over a given location, ignoring pores and voids inside the biofilm. The thickness distribution can be used to calculate a range of variables, including biofilm roughness (see below) and mean biofilm thickness. Mean biofilm thickness provides a measure of the spatial size of the biofilm and is the most common variable used in biofilm literature, probably because of its simple interpretation and the fact that it can be measured without the use of CSLM and image analysis software (though not as precisely). Identification and area distribution of micro-colonies at the substratum. This function locates micro-colonies at the
2399
A. H E Y D O R N a n d O T H E R S
substratum, i.e. in the first image of the stack. Individual micro-colonies are identified by 8-connected component labelling (Russ, 1994). Only micro-colonies larger than a certain area size (determined by the user) are identified. The function calculates the total number of identified micro-colonies, the area size of each micro-colony (µm#) and the mean micro-colony area (µm#). The number and area sizes of micro-colonies at the substratum provide valuable information about the organization of the biofilm community. Future versions of will include tools for investigating the shape and spatial distribution of micro-colonies at the substratum, e.g. for analysing whether micro-colonies are in a clustered, random or self-avoiding arrangement (Russ, 1994). Volumes of micro-colonies identified at the substratum.
This function calculates the volume (µm$) of each of the micro-colonies identified above and the mean microcolony volume (µm$). The volume of each individual micro-colony is calculated by using the image of a single micro-colony at the substratum as starting point, moving down the stack of images, identifying and counting all biomass pixels connected to the substratum layer of this micro-colony. The distribution of microcolony volumes may be interesting in many respects, e.g. to investigate how micro-colony volumes vary under changing environmental conditions, or to establish whether there exists an ‘ optimal micro-colony volume ’, so that micro-colony growth ceases when a certain micro-colony size is reached. calculates the fractal dimension of the image stacks by two different methods (using the Minkowsky sausage method or the crosscorrelation function method). The calculations are performed essentially as described previously (Hermanowicz et al., 1995 ; Lewandowski et al., 1999).
Fractal dimension.
This version of a dimensionless roughness coefficient was suggested by Murga et al. (1995). It is calculated from the thickness distribution of the biofilm (discussed above) and is defined as
Roughness coefficient.
1 N Q LfikL_ f Q � L_ f N i= " in which Lfi is the ith individual thickness measurement, overlined Lf is the mean thickness, and N is the number of thickness measurements. Biofilm roughness provides a measure of how much the thickness of the biofilm varies, and is an indicator of biofilm heterogeneity. R� l a
Distribution of diffusion distances, average and maximum diffusion distance. The diffusion distance for a pixel
containing biomass is the shortest distance from that pixel to a pixel not containing biomass. The average diffusion distance is the average of diffusion distances among all biomass pixels, whereas the maximum diffusion distance is the maximum of diffusion distances among all biomass pixels. Average and maximum diffusion distances have been suggested as measures of the distances over which nutrients and other substrate components have to diffuse from the voids to the 2400
bacteria within micro-colonies (Lewandowski et al., 1999 ; Yang et al., 2000). However, the variables have so far only been defined for two-dimensional images, limiting their applicability for three-dimensional biofilm images. calculates the total distribution of three-dimensional diffusion distances by calculating the brightness histogram of a three-dimensional Euclidian distance map (3D-EDM). In a 3D-EDM the value of each pixel is the Euclidian distance to the nearest background pixel. The 3D-EDM is calculated by repeatedly applying a 3D filter (for details see Russ, 1994). In order to get a real 3D-EDM with distances in µm, the 3D filter must take the different pixel sizes in the x-, yand z-directions into account. A brightness histogram of the 3D-EDM directly provides the distribution of diffusion distances, and thereby the average and maximum diffusion distances. In , the borders outside the stacks of images are all defined as biomass except for the top border, which is defined as background. For the purpose of determining distances over which the substrate has to diffuse into the biofilm, these border conditions are the most appropriate. The distribution of three-dimensional diffusion distances in biofilms can be used for detailed studies on diffusion in biofilms. Average and maximum diffusion distances can be used as simple variables characterizing the ‘ diffusion state ’ of the biofilm. The surface of the biofilm is defined by the collection of pixels having at least one background pixel as neighbour. Also in this case, the borders around the image stacks are all defined as biomass except for the top border, which is defined as background. In this way, only surfaces exposed to the nutrient flow are included in the surface area calculation. In the actual calculation of surface area, each pixel is considered a box (voxel) with the dimensions (pixel size)xi(pixel size)yi(pixel size)z. The surface area is the area summation of all biomass voxel surfaces exposed to the background. The surface to volume ratio is the surface area divided by the bio-volume. The surface to volume ratio reflects what fraction of the biofilm is in fact exposed to the nutrient flow, and thus may indicate how the biofilm adapts to the environment. For example, it could be speculated that in environments of low nutrient concentration, the surface to volume ratio would increase in order to optimize access to the limited supply of nutrients.
Surface to volume ratio.
Biofilm structures developed by four Pseudomonas strains
In the present study, mean thickness, roughness, substratum coverage and surface to volume ratio were chosen to characterize the biofilm structures developed by each of four Pseudomonas spp. These variables were selected because they are fairly easy to interpret in biological and physical terms. Mean thickness indicates the spatial dimensions of the biofilm, roughness represents a measure of biofilm heterogeneity, substratum coverage reflects how efficiently the strain colonizes the
Quantification of biofilm structures by Table 1. Mean thickness, roughness, substratum coverage and surface to volume ratio of biofilms of P. putida, P. aureofaciens, P. fluorescens and P. aeruginosa .....................................................................................................................................................................................................................................
Values are means of data from 28 image stacks (seven image stacks from two channels in two independent experiment rounds). The standard deviation is calculated as the square root of the mean of the variances of each of the four groups (two channelsitwo experiment rounds). This corresponds to the residual standard deviation in an analysis of variance model. Day
P. putida
P. aureofaciens
P. fluorescens
P. aeruginosa
Mean thickness (µm)
1 2 4 7 10
0n27p 0n08 0n78p0n50 3n03p0n72 4n36p1n97 7n46p4n60
2n33p0n26 2n41p0n20 3n75p0n46 5n17p1n93 7n06p2n22
0n66p0n12 1n37p0n14 3n21p0n49 5n61p1n02 8n47p2n32
3n43p0n24 2n49p0n38 4n96p0n48 4n52p0n50 5n65p0n61
Roughness coefficient
1 2 4 7 10
1n82p 0n04 1n66p0n20 0n83p0n10 1n02p0n16 0n73p0n23
0n47p0n08 0n45p0n06 0n46p 0n04 0n67p0n10 0n66p0n10
1n24p0n14 0n85p0n07 0n90p0n09 0n71p0n08 0n72p0n12
0n15p0n05 0n35p0n07 0n21p0n02 0n23p0n04 0n25p0n03
Substratum coverage
1 2 4 7 10
0n08p0n02 0n10p0n10 0n64p0n06 0n52p0n11 0n71p0n12
0n94p0n02 0n94p0n02 0n97p0n01 0n89p0n02 0n85p0n04
0n57p0n03 0n55p0n02 0n81p0n03 0n80p 0n04 0n73p0n05
1n00p0n00 1n00p0n00 1n00p0n00 1n00p0n00 0n98p0n02
Surface to volume ratio (µm# µm−$)
1 2 4 7 10
1n25p0n09 1n42p0n19 0n68p0n05 0n86p0n09 0n70p0n12
0n57p0n04 0n52p0n04 0n47p0n02 0n59p0n07 0n79p0n10
1n27p0n05 1n52p0n05 0n67p0n04 0n75p0n06 1n09p0n13
0n46p0n04 0n62p0n07 0n48p0n03 0n42p0n03 0n58p0n09
substratum, and surface to volume ratio tells how large a portion of the biofilm is exposed to the nutrient flow. These four variables were calculated by for biofilms developed by the four Pseudomonas strains after acquiring images as described in Methods. The results are summarized in Table 1. The listed values were determined as means of 28 image stacks (seven image stacks from two channels in two independent experiment rounds). Biofilm structures of P. aeruginosa, P. aureofaciens and P. fluorescens. The biofilm structures of P. aeruginosa were
clearly different from those of the other three strains studied (Table 1). First of all, P. aeruginosa colonized the entire substratum very rapidly (substratum coverage of 98–100 % on all days). Only P. aureofaciens had a similar phenotype. Furthermore, P. aeruginosa had the lowest roughness coefficients at all time points and fairly low surface to volume ratios. Evidently, P. aeruginosa formed a flat and uniform biofilm compared to the other three strains (Fig. 2). The biofilm structures of P. aureofaciens resembled those of P. aeruginosa. However, P. aureofaciens had a stronger tendency to form micro-colonies than P. aeruginosa (Fig. 2), which was indicated by higher roughness coefficients, and by the substratum coverage not reaching 100 % at any time point.
The biofilms of P. fluorescens developed substratum coverage values lower than those for P. aureofaciens and P. aeruginosa, whereas the roughness coefficients were higher. The surface to volume ratios in P. fluorescens biofilms were clearly different from those in P. aureofaciens and P. aeruginosa biofilms. P. fluorescens showed a slight tendency to form elongated cell clusters and filaments (Fig. 2). Biofilm structure of P. putida. The pattern of biofilm formation for P. putida as observed in the flow cells was quite distinct. Initially, P. putida cells attached individually, and after 1–2 d micro-colonies began to form. In a study of another strain, P. putida OUS82, evidence has been provided that colony formation occurs by growth of individual cells attached to the substratum and not by motility-driven cell aggregation (T. Tolker-Nielsen, personal communication). After 3–4 d, long filaments and elongated cell clusters, extending from the smaller micro-colonies at the substratum, began to develop. Finally, after 5–10 d, large parts of the biofilm consisted of long filaments and attached cell clusters rising up to 300 µm from the surface. At this point the biofilm structure was quite loose and constantly moving as a consequence of the medium flow. The results in Table 1 only partly reflect this developmental pattern. At days 1 and 2, the mean thickness and the substratum coverage were quite low,
2401
A. H E Y D O R N a n d O T H E R S
Table 2. Mean thickness, roughness, substratum coverage and surface to volume ratio of biofilms of P. aureofaciens grown with 0n03 mM, 0n1 mM or 0n5 mM citrate .....................................................................................................................................................................................................................................
Values are means of data from 28 image stacks (seven image stacks from two channels in two independent experiment rounds). The standard deviation is calculated as the square root of the mean of the variances of each of the four groups (two channelsitwo experiment rounds). This corresponds to the residual standard deviation in an analysis of variance model. Day
0n03 mM citrate
0n1 mM citrate
0n5 mM citrate
Mean thickness (µm)
1 2 4 7 10
1n88p0n27 3n34p0n40 2n46p0n24 3n62p0n45 5n81p2n16
2n73p0n40 2n95p0n64 3n84p0n87 4n92p1n65 5n80p1n93
2n73p0n19 3n63p0n76 18n55p5n68 20n40p5n42 24n65p7n51
Roughness coefficient
1 2 4 7 10
0n73p0n06 0n54p0n05 0n62p0n05 0n56p0n07 0n57p0n07
0n52p0n09 0n30p0n07 0n65p0n12 0n68p0n15 0n70p0n12
0n33p0n04 0n36p0n09 0n37p0n12 0n37p0n09 0n47p0n12
Substratum coverage
1 2 4 7 10
0n73p0n03 0n85p0n02 0n80p0n03 0n86p0n03 0n86p0n03
0n89p0n03 0n99p0n02 0n90p0n05 0n89p0n06 0n86p0n05
0n95p0n02 0n98 p0n02 0n96p0n02 0n90p0n05 0n90p0n04
Surface to volume ratio (µm# µm−$)
1 2 4 7 10
0n88p0n05 0n65p0n03 0n82p0n04 0n84p0n04 0n62p 0n04
0n69p0n06 0n47p0n03 0n58p0n06 0n67p0n08 0n67p0n08
0n65p0n03 0n53p0n05 0n93p0n13 1n34p0n17 1n45p0n20
and the surface to volume ratio was quite high. This corresponds to single cells and small cell clusters attached to the substratum. Single cells and small cell clusters naturally have a higher surface to volume ratio than larger micro-colonies. At day 4, some microcolonies had developed at the substratum, which was reflected in higher substratum coverage, lower surface to volume ratio and higher mean thickness of the biofilm. At days 7 and 10 the biofilm had turned into the filamentous form as described. However, this is not reflected properly by the quantitative data in Table 1. One problem is that good-quality images can only be acquired by confocal microscopy to a certain maximum depth, which is determined by several factors including the density of the biofilm, the intensity of the laser light, the sensitivity of the photomultipliers and the numerical aperture of the objective (for details see Caldwell et al., 1992). This problem could be reduced by using twophoton excitation microscopy, which is characterized by significantly deeper sample penetration (Vroom et al., 1999). In the present study, images of good quality could be acquired to a depth of approximately 70 µm in the P. putida biofilms. Another problem is that the connected volume filtration (see Methods), which removes noise from the images prior to quantification, may, under certain conditions, also remove biomass pixels. If for instance a filament is very thin, it may not be connected 2402
to the image in the layer below due to the distance between image stacks in the z-direction (normally 1n5–2n0 µm). A filament which is not connected to the layer of biomass at the substratum is removed by the connected-volume filtration. This may explain the unexpected low on the mean thickness for the P. putida biofilms on days 7 and 10. The general problem indicated by the biofilm behaviour of P. putida is that some strains growing under particular conditions may not be compatible with this kind of quantitative analysis. In such cases, it would be essential either to substitute the chosen strain with another (preferably the same species), or to modify the biofilm conditions (substrate, substratum, flow type or rate, etc.). It is therefore important to perform tests of the compatibility with the program, including a reproducibility analysis based on statistical significance, and most likely it is important that ‘ normal ’ biofilm features such as microcolonies, extracellular polymers, robustness, and recurrent patterns appear in repeated runs. Biofilm structure of P. aureofaciens grown with 0n03 mM, 0n1 mM or 0n5 mM citrate
Values of mean thickness, roughness, substratum coverage and surface to volume ratio of P. aureofaciens biofilms grown with 0n03 mM, 0n1 mM or 0n5 mM citrate
Quantification of biofilm structures by
as carbon source are summarized in Table 2. These values are means of data from 28 image stacks (seven image stacks from two channels in two independent experiment rounds). There were clear differences between the biofilms. At days 1 and 2 all the biofilms had similar mean thickness. However, after day 2, the mean thickness of the 0n5 mM biofilms continued to increase rapidly (up to approximately 25 µm), whereas the 0n03 mM and 0n1 mM biofilms remained fairly thin (up to 5–6 µm). Consequently, the increased concentration of citrate allowed the 0n5 mM biofilms to continue growing for longer and to a higher mean thickness than the 0n03 mM and 0n1 mM biofilms. The roughness estimates also showed considerable differences between the biofilms. The 0n03 mM and 0n1 mM biofilms had significantly higher roughness coefficients than the 0n5 mM citrate biofilms at all time points. Furthermore, there was a tendency for the higher citrate concentrations to show higher substratum coverage. Finally, the surface to volume ratio seemed to increase with increasing mean thickness for the 0n5 mM biofilms. This indicates that even when biofilms become thicker, the surface area of the biofilm (which is exposed to the nutrient flow) may actually increase. DISCUSSION
The four pseudomonads investigated play important roles in environmental and medical contexts. P. putida is often connected with removal of chemical pollutants (Ramos et al., 1994), and as a microbial inoculant in agricultural applications (Ramos et al., 1991 ; Molina et al., 1998). P. aureofaciens is an efficient rhizosphere colonizer, and certain strains produce phenazine antibiotics, which inhibit Gaeumannomyces graminis var. tritici, the causative agent of take-all disease (Mazzola et al., 1995 ; Wood et al., 1997). P. fluorescens is also known as an excellent rhizosphere colonizer, and some strains can be used as effective bio-control agents against Rhizoctonia solani and other soil-borne plant pathogens (Mavrodi et al., 1998 ; Rainey, 1999). P. aeruginosa has been studied extensively due to its properties as an opportunistic pathogen causing infections of burn tissue and colonization of indwelling catheters. Moreover, infection by P. aeruginosa is the main cause of mortality in cystic fibrosis patients (Tu$ mmler & Kiewitz, 1999). The significant activities of these organisms have resulted in a rapidly growing interest in their physiology and molecular biology, including their performance in biofilm settings, and we therefore thought it relevant and useful to perform the analysis on these particular species. Biofilm structures of four Pseudomonas species
Under the experimental conditions used in the present study, steady states of the biofilms were not reached even after 10 d ; in fact the biofilms continued to grow until the entire flow channels were occupied by biomass. However, with higher flow rates, mean biofilm thickness has previously been shown to reach a steady state (Van
Loosdrecht et al., 1995 ; Davies et al., 1998 ; Lewandowski et al., 1999). Steady-state biofilms represent one type of reference point in relation to quantification of biofilms. Under steady-state conditions the variables calculated by should be constant and invariant between repeated experiments, and hence represent the particular biofilm community by a fixed set of values. We believe that the steady-state condition understood as a real equilibrium cannot be reached in such a heterogeneous system as a biofilm (neither monospecies nor multispecies). Rather, the term steady-state should only be applied in relation to measurable variables such as those calculated by . measurements of biofilm development as a function of time are another type of biofilm representation, which we have preferred to apply here. (Introduction of the time dimension and its mathematical implications will be treated elsewhere.) Based on the results presented here, it is first of all concluded that the four Pseudomonas strains are characterized by different modes of biofilm growth. P. putida has a unique developmental pattern starting with single cells on the substratum growing into micro-colonies, which are eventually taken over by long filaments and elongated cell clusters. P. aeruginosa colonizes the entire substratum, and forms flat, uniform biofilms. P. aureofaciens resembles P. aeruginosa, but has a stronger tendency to form micro-colonies. Finally, the biofilm structures of P. fluorescens had a phenotype intermediate between those of P. putida and P. aureofaciens. Davies et al. (1998) reported that flow-chamber-grown biofilms of P. aeruginosa were characterized by microcolonies separated by water channels, and that the depth of the biofilms was approximately 100 µm. Stewart et al. (1993) quantified biofilms of P. aeruginosa grown in a continuous-flow annular biofilm reactor on a glucose minimal medium, and described the biofilms as rough, with a thickness between 13 and 60 µm. However, in a similar experimental set-up, Murga et al. (1995) described monospecies biofilms of P. aeruginosa as thin and nearly uniformly thick with a roughness coefficient (Ra*) of 0n15, which is similar to our results. They also reported that P. aeruginosa consistently colonized the substratum completely. Korber et al. (1994) described 24–72-h-old flow-channel-grown biofilms of P. fluorescens as an extensive network of cell aggregates separated by water channels. The amount of biomass was lowest near the substratum, and dense micro-colonies appeared further away from the surface. Kuehn et al. (1998) quantified flow-channel-grown biofilms of P. fluorescens, and found that most of the biomass was concentrated at the attachment surface. However, they also found cell clusters extending into the bulk phase. Although these observations are partly opposed to each other, they support the notion that P. fluorescens biofilms resemble the biofilms of both P. putida and P. aureofaciens. To our knowledge there are no reports on structure of P. aureofaciens biofilms. There is no doubt that the wide variety of experimental biofilm model systems being used in different laboratories promotes different kinds of biofilm structures. Compared to most 2403
A. H E Y D O R N a n d O T H E R S
other model systems, the system used in the present study is characterized by a very low flow rate (Reynolds number 0n02) and a low substrate concentration (0n1 mM citrate). An important reason for including the four Pseudomonas spp. in the present analysis was that they all belong to the γ subgroup of Proteobacteria and are phylogenetically closely related (Fig. 1). It has been suggested, based on genome mapping, that the four species originate from a common ancestor (Ramos-Dı! az & Ramos, 1998), although differences in the genomes of the organisms also show that rearrangements must have occurred (Ramos-Dı! az & Ramos, 1998). If genotypic similarities are correlated with similarities in biofilm development, it might be expected that links between phylogenetic distances and corresponding developmental traits would have shown up in the comparative investigations. The data presented here, however, do not support this expectation. Although P. aeruginosa and P. aureofaciens are phylogenetically fairly close and in fact display biofilm developments which share a number of characteristics, the same is certainly not the case for P. putida and P. fluorescens, despite the fact that these two species are also closely related. In general, there is probably no reason to assume that two related organisms will behave in similar ways during biofilm development, and likewise we will most probably see many examples of nearly identical biofilm characteristics from distantly related organisms. Effect of substrate concentration on biofilm structure
The mean thickness of the P. aureofaciens biofilms was found to increase with increasing citrate concentrations (Table 2). Peyton (1996) studied P. aeruginosa biofilms grown in an annular reactor under different glucose concentrations, and also found that steady-state biofilm thickness increased with increasing glucose concentrations. Similar results were obtained by Park et al. (1998) in a sludge biofilm. Picioreanu et al. (1998a, b) combined a continuous-field description of the substrate concentration with a cellular automaton description of the biomass, to model the three-dimensional distribution of micro-organisms. It was predicted from these studies that at high nutrient concentrations the biofilms would be thick, compact and uniform, whereas low nutrient concentrations would result in porous biofilms containing channels and voids. By quantifying computergenerated biofilms, the authors found that roughness and biofilm surface enlargement (similar to the surface to volume ratio used in the present study) increased with decreasing nutrient concentration. In accordance with these results, we found that biofilm roughness increased with lower citrate concentrations in P. aureofaciens biofilms. However, the surface to volume ratio increased with higher citrate concentrations (from day 4), which is in contrast to the results of Picioreanu et al. (1998b). Furthermore, the model presented by Picioreanu et al. (1998b) implies that biofilms supplied with low nutrient concentrations constantly grow slower than biofilms supplied with high nutrient concentrations. Our results 2404
show that the P. aureofaciens biofilms grow equally fast for the first 2 d (reflected in similar mean thicknesses). After 2 d the 0n5 mM citrate biofilms continue to grow due to an excess of carbon source compared to the 0n03 mM and 0n1 mM citrate biofilms. This indicates that substrate diffusion is most likely not a limiting factor during the first 2 d of biofilm development. The links between mathematical models of biofilm development (Wimpenny & Colasanti, 1997 ; Picioreanu et al., 1998a, b) and well-controlled, reproducible biofilm experiments still need to be established. Quantitative experimental data calculated by programs like represent one route to this, via which objective information from biofilms compared with modelgenerated data may improve our understanding of microbial biofilm development. COMSTAT
and future biofilm investigations
There has been an increasing interest in identifying bacterial genes that express key activities in relation to biofilm formation. Recently, an important example of this was presented by Davies et al. (1998) in connection with their documentation of the significance of quorumsensing functions in P. aeruginosa for development of normal biofilms. In a series of papers, Kolter and his colleagues have shown how a number of cellular functions such as twitching motility (O’Toole & Kolter, 1998), flagella (O’Toole & Kolter, 1998 ; Pratt & Kolter, 1998) and catabolite repression control (O’Toole et al., 2000) play important roles in the initial stages of biofilm formation. Also the significance of global regulatory factors such as RpoS for biofilm development has been documented (Adams & McLean, 1999), and more general searches have been made for genes specifically induced during biofilm development (Prigent-Combaret et al., 1999). In all these studies the major conclusions have been based on more or less qualitative investigations derived from visual interpretations of microscopic images. A systematic analysis of the impact of mutations in any of these functions on biofilm development may be initiated on safer ground if programs such as are applied. In some cases, quantification of biofilms will produce as many different descriptions of different biofilm modes or types as are studied. This was the case in the present study of four Pseudomonas species. However, when the impacts of mutations are studied in isogenic strains, the possibility of getting similar biofilm structures is significantly higher. Similarities and differences between biofilms are best analysed in an analysis of variance model which takes into account factors such as experiment round, bacterial strain, channel number and image stack number (Heydorn et al., 2000). With the aid of programs like it seems within reach to build up a base of information concerning organizational traits of bacteria living in surface communities. In fact, it will soon be possible to define species specific biofilm characteristics as matrices composed of variables like those presented and discussed here. It is
Quantification of biofilm structures by
therefore tempting to see this as a first step towards a taxonomy for communities, from which further extrapolations concerning relationships between community performance and genotypic characteristics of the corresponding bacteria may be made. If this is possible, predictions concerning biofilm development could eventually be made with some degree of certainty. Concluding comments
Investigations of biofilms have caught the interest of many different groups of microbiologists, most likely because the significance of sessile life of bacteria has penetrated to several areas of microbiology, but also because the relevant technologies (microscopy combined with molecular techniques and tools) now permit very detailed studies of even the most complex communities. On the one hand, specific organisms may be monitored under the most heterogeneous conditions at the level of single cells, and on the other hand, as we have documented in the present communication, community configuration and development may now be described in such quantitative ways that entire consortia of organisms may be analysed as if they are multicellular entities. We wish to emphasize that the individual cell perspective and the community perspective represent two sides of the same coin : bacteria possess the capacity to live as single cells and exploit the surroundings in an optimal way, and they do so whether suspended in water or located in surface communities ; however, located in surface communities they may also form consortia resembling multicellular organisms, at the same time as single individuals swim around as they would normally do in suspension. It is therefore essential to monitor the activities and performance of biofilm communities from both perspectives, aiming at the same level of precision and objectivity. ACKNOWLEDGEMENTS We thank Cayo Ramos for providing the GFP-tagged strains of P. putida KT2442 (CRR302), P. aureofaciens ATCC 13985 (CRR318) and P. fluorescens SBW25 (CRR326), and Jens Bo Andersen for providing the pUTkn : : PA / / -gfp-T0-T1 de" !% !$ for writing the livery plasmid. We thank Mikkel Christensen programming code for calculation of the cross-correlation function fractal dimension, and Søren Falch Jørgensen for valuable comments in connection with the design of . The work was supported by a grant from the Danish Biotechnology Program.
REFERENCES Adams, J. L. & McLean, R. J. (1999). Impact of rpoS deletion on Escherichia coli biofilms. Appl Environ Microbiol 65, 4285–4287. Andersen, J. B., Sternberg, C., Poulsen, L. K., Bjørn, S. P., Givskov, M. & Molin, S. (1998). New unstable variants of green fluorescent
protein for studies of transient gene expression in bacteria. Appl Environ Microbiol 64, 2240–2246. Anwar, H., Strap, J. L. & Costerton, J. W. (1992). Establishment of aging biofilms : possible mechanism of bacterial resistance to antimicrobial therapy. Antimicrob Agents Chemother 36, 1347– 1351.
Brooun, A., Liu, S. & Lewis, K. (2000). A dose–response study of
antibiotic resistance in Pseudomonas aeruginosa biofilms. Antimicrob Agents Chemother 44, 640–646. Caldwell, D., Korber, D. R. & Lawrence, J. R. (1992). Confocal laser microscopy and digital image analysis in microbial ecology. In Advances in Microbial Ecology, pp. 1–67. Edited by K. C. Marshall. New York : Plenum. Christensen, B. B., Sternberg, C., Andersen, J. B., Palmer, R. J., Nielsen, A. T., Givskov, M. & Molin, S. (1999). Molecular tools for
study of biofilm physiology. Methods Enzymol 310, 20–42. Costerton, J. W., Stewart, P. S. & Greenberg, E. P. (1999). Bacterial
biofilms : a common cause of persistent infections. Science 284, 1318–1322. Dalton, H. M., Poulsen, L. K., Halasz, P., Angles, M. L., Goodman, A. E. & Marshall, K. C. (1994). Substratum-induced morphological
changes in a marine bacterium and their relevance to biofilm structure. J Bacteriol 176, 6900–6906. Davies, D. G. & Geesey, G. G. (1995). Regulation of the alginate biosynthesis gene algC in Pseudomonas aeruginosa during biofilm development in continuous culture. Appl Environ Microbiol 61, 860–867. Davies, D. G., Chakrabarty, A. M. & Geesey, G. G. (1993). Exopolysaccharide production in biofilms : substratum activation of alginate gene expression by Pseudomonas aeruginosa. Appl Environ Microbiol 59, 1181–1186. Davies, D. G., Parsek, M. R., Pearson, J. P., Iglewski, B. H., Costerton, J. W. & Greenberg, E. P. (1998). The involvement of
cell-to-cell signals in the development of a bacterial biofilm. Science 280, 295–298. Fukunaga, K. (1972). Introduction to Statistical Pattern Recognition. London : Academic Press. Hermanowicz, S. W., Schindler, U. & Wilderer, P. A. (1995). Fractal structure of biofilms : new tools for investigation of morphology. Water Sci Technol 32, 99–105. Heydorn, A., Ersbøll, B. K., Hentzer, M., Parsek, M. R., Givskov, M. & Molin, S. (2000). Experimental reproducibility in flow-
chamber biofilms : Microbiology 146, 2409–2415. Holloway, B. W. (1955). Genetic recombination in Pseudomonas aeruginosa. J Gen Microbiol 13, 572–581. Hughs, G. F. (1968). On the mean accuracy of statistical pattern recognizers. IEEE Trans Inf Theory 14, 55–63. Kharazmi, A., Giwercman, B. & Høiby, N. (1999). Robbins device in biofilm research. Methods Enzymol 310, 207–215. Korber, D. R., Lawrence, J. R., Hendry, M. J. & Caldwell, D. (1992).
Programs for determining statistically representative areas of microbial biofilms. Binary 4, 204–210. Korber, D. R., Lawrence, J. R., Hendry, M. J. & Caldwell, D. E. (1993). Analysis of spatial variability within Mot+ and Mot−
Pseudomonas fluorescens biofilms using representative elements. Biofouling 7, 339–358. Korber, D. R., Lawrence, J. R. & Caldwell, D. E. (1994). Effect of motility on surface colonization and reproductive success of Pseudomonas fluorescens in dual-dilution continuous culture and batch culture systems. Appl Environ Microbiol 60, 1421–1429. Kuehn, M., Hausner, M., Bungartz, H. J., Wagner, M., Wilderer, P. A. & Wuertz, S. (1998). Automated confocal laser scanning
microscopy and semiautomated image processing for analysis of biofilms. Appl Environ Microbiol 64, 4115–4127. Lanzer, M. & Bujard, H. (1988). Promoters largely determine the efficiency of repressor action. Proc Natl Acad Sci U S A 85, 8973–8977. 2405
A. H E Y D O R N a n d O T H E R S
Lewandowski, Z., Webb, D., Hamilton, M. & Harkin, G. (1999).
Picioreanu, C., Van Loosdrecht, M. C. M. & Heijnen, J. J. (1998a).
Quantifying biofilm structure. Water Sci Technol 39, 71–76.
A new combined differential-discrete cellular automaton approach for biofilm modeling : application for growth in gel beads. Biotechnol Bioeng 57, 718–731.
de Lorenzo, V., Herrero, M., Jakubzik, U. & Timmis, K. N. (1990).
Mini-Tn5 transposon derivatives for insertion mutagenesis, promoter probing, and chromosomal insertion of cloned DNA in gram-negative eubacteria. J Bacteriol 172, 6568–6572. de Lorenzo, V., Eltis, L., Kessler, B. & Timmis, K. N. (1993).
Analysis of Pseudomonas gene-products using lacIQ Ptrp-Lac plasmids and transposons that confer conditional phenotypes. Gene 123, 17–24. Mavrodi, D. V., Ksenzenko, V. N., Bonsall, R. F., Cook, R. J., Boronin, A. M. & Thomashow, L. S. (1998). A seven-gene locus for
synthesis of phenazine-1-carboxylic acid by Pseudomonas fluorescens 2-79. J Bacteriol 180, 2541–2548. Mazzola, M., Fujimoto, D. K., Thomashow, L. S. & Cook, R. J. (1995). Variation in sensitivity of Gaeumannomyces graminis to
antibiotics produced by fluorescent Pseudomonas spp and effect on biological control of take-all of wheat. Appl Environ Microbiol 61, 2554–2559. Molina, L., Ramos, C., Ronchel, M. C., Molin, S. & Ramos, J. L. (1998). Construction of an efficient biologically contained Pseudo-
monas putida strain and its survival in outdoor assays. Appl Environ Microbiol 64, 2072–2078. Møller, S., Pedersen, A. R., Poulsen, L. K., Arvin, E. & Molin, S. (1996). Activity and three-dimensional distribution of toluene-
degrading Pseudomonas putida in a multispecies biofilm assessed by quantitative in situ hybridization and scanning confocal laser microscopy. Appl Environ Microbiol 62, 4632–4640. Møller, S., Korber, D. R., Wolfaardt, G. M., Molin, S. & Caldwell, D. E. (1997). Impact of nutrient composition on a degradative
biofilm community. Appl Environ Microbiol 63, 2432–2438. Møller, S., Sternberg, C., Andersen, J. B., Christensen, B. B., Ramos, J. L., Givskov, M. & Molin, S. (1998). In situ gene expression
in mixed-culture biofilms : evidence of metabolic interactions between community members. Appl Environ Microbiol 64, 721–732. Morrison, D. F. (1990). Multivariate Statistical Methods, 3rd edn. New York : McGraw-Hill. Murga, R., Stewart, P. S. & Daly, D. (1995). Quantitative analysis of biofilm thickness variability. Biotechnol Bioeng 45, 503–510. Nielsen, A. T., Tolker-Nielsen, T., Barken, K. B. & Molin, S. (2000).
Role of commensal relationships on the spatial structure of a surface-attached microbial consortium. Environ Microbiol 2, 59–68. O’Toole, G. A. & Kolter, R. (1998). Flagellar and twitching motility are necessary for Pseudomonas aeruginosa biofilm development. Mol Microbiol 30, 295–304. O’Toole, G. A., Gibbs, K. A., Hager, P. W., Phibbs, P. V. & Kolter, R. (2000). The global carbon metabolism regulator Crc is a
component of a signal transduction pathway required for biofilm development by Pseudomonas aeruginosa. J Bacteriol 182, 425–431. Palmer, R. J., Jr (1999). Microscopy flowcells : perfusion chambers for real-time study of biofilms. Methods Enzymol 310, 160–166. Park, Y. S., Yun, J. W. & Song, S. K. (1998). Biofilm properties under different substrate loading rates in a rotating biological contactor. Biotechnol Tech 12, 587–590. Peyton, B. M. (1996). Effects of shear stress and substrate loading rate on Pseudomonas aeruginosa biofilm thickness and density. Water Res 30, 29–36. 2406
Picioreanu, C., Van Loosdrecht, M. C. M. & Heijnen, J. J. (1998b).
Mathematical modeling of biofilm structure with a hybrid differential-discrete cellular automaton approach. Biotechnol Bioeng 58, 101–116. Pratt, L. A. & Kolter, R. (1998). Genetic analysis of Escherichia coli biofilm formation : roles of flagella, motility, chemotaxis and type I pili. Mol Microbiol 30, 285–293. Prigent-Combaret, C., Vidal, O., Dorel, C. & Lejeune, P. (1999).
Abiotic surface sensing and biofilm-dependent regulation of gene expression in Escherichia coli. J Bacteriol 181, 5993–6002. Rainey, P. B. (1999). Adaptation of Pseudomonas fluorescens to the plant rhizosphere. Environ Microbiol 1, 243–257. Ramos, J. L., Duque, E. & Ramos-Gonza! lez, M. I. (1991). Survival in soils of an herbicide-resistant Pseudomonas putida strain bearing a recombinant TOL plasmid. Appl Environ Microbiol 57, 260–266. Ramos, J. L., Diaz, E., Dowling, D., de Lorenzo, V., Molin, S., O’Gara, F., Ramos, C. & Timmis, K. N. (1994). The behavior
of bacteria designed for biodegradation. Biotechnology 12, 1349–1356. Ramos-Diaz, M. A. & Ramos, J. L. (1998). Combined physical and genetic map of the Pseudomonas putida KT2440 chromosome. J Bacteriol 180, 6352–6363. Russ, J. C. (1994). The Image Processing Handbook, 2nd edn. Boca Raton, CRC Press. Saitou, N. & Nei, M. (1987). The neighbor-joining method : a new method for reconstruction of phylogenetic trees. Mol Biol Evol 4, 406–425. Sieracki, M. E., Reichenbach, S. E. & Webb, K. L. (1989). Evaluation of automated threshold selection methods for accurately sizing microscopic fluorescent cells by image analysis. Appl Environ Microbiol 55, 2762–2772. Stewart, P. S., Peyton, B. M., Drury, W. J. & Murga, R. (1993).
Quantitative observations of heterogeneities in Pseudomonas aeruginosa biofilms. Appl Environ Microbiol 59, 327–329. Thompson, I. P., Lilley, A. K., Ellis, R. J., Bramwell, P. A. & Bailey, M. J. (1995). Survival, colonization and dispersal of genetically
modified Pseudomonas fluorescens SBW25 in the phytosphere of field-grown sugar-beet. Biotechnology 13, 1493–1497. Tu$ mmler, B. & Kiewitz, C. (1999). Cystic fibrosis : an inherited susceptibility to bacterial respiratory infections. Mol Med Today 5, 351–358. Van Loosdrecht, M. C. M., Eikelboom, D., Gjaltema, A., Mulder, A., Tijhuis, L. & Heijnen, J. J. (1995). Biofilm structures. Water Sci
Technol 32, 35–43. Vroom, J. M., De Grauw, K. J., Gerritsen, H. C., Bradshaw, D. J., Marsh, P. D., Watson, G. K., Birmingham, J. J. & Allison, C. (1999).
Depth penetration and detection of pH gradients in biofilms by two-photon excitation microscopy. Appl Environ Microbiol 65, 3502–3511. Wimpenny, J. W. T. & Colasanti, R. (1997). A unifying hypothesis for the structure of microbial biofilms based on cellular automaton models. FEMS Microbiology Ecology 22, 1–16. Wolfaardt, G. M., Lawrence, J. R., Robarts, R. D., Caldwell, S. J. & Caldwell, D. E. (1994). Multicellular organization in a degradative
biofilm community. Appl Environ Microbiol 60, 434–446.
Quantification of biofilm structures by Wood, D. W., Gong, F., Daykin, M. M., Williams, P. & Pierson, L. S., III (1997). N-Acyl-homoserine lactone-mediated regulation
of phenazine gene expression by Pseudomonas aureofaciens 30-84 in the wheat rhizosphere. J Bacteriol 179, 7663–7670. Xu, K. D., Stewart, P. S., Xia, F., Huang, C. T. & McFeters, G. A. (1998). Spatial physiological heterogeneity in Pseudomonas
aeruginosa biofilm is determined by oxygen availability. Appl Environ Microbiol 64, 4035–4039.
Yang, X. M., Beyenal, H., Harkin, G. & Lewandowski, Z. (2000).
Quantifying biofilm structure using image analysis. J Microbiol Methods 39, 109–119. Zhang, T. C. & Bishop, P. L. (1994). Density, porosity, and pore structure of biofilms. Water Res 28, 2267–2277. .................................................................................................................................................
Received 11 April 2000 ; revised 5 July 2000 ; accepted 26 July 2000.
2407