at The School of Energy, Environmental, Biological and Medical .... Figure 2. Schematic of phase transformation in star polymers with uniform fractal distribution ...... Ramachandran, R.; Beaucage, G.; Kulkarni, A. S.; McFaddin, D.; Merrick-Mack,.
Quantification of Fractal Systems using Small Angle Scattering A dissertation submitted to the Division of Research and Advanced Studies of the
University of Cincinnati In partial fulfillment of the requirements for the degree of
Doctor of Philosophy in Materials Science and Engineering at The School of Energy, Environmental, Biological and Medical Engineering of The College of Engineering and Applied Science
By
Durgesh Kumar Rai B.Sc. (Physics Hons.), Banaras Hindu University, India (2003) M.Sc. (Physics), Banaras Hindu University, India (2005) M.Tech. (Materials Sciences), Indian Institute of Technology Kanpur, India (2007)
Committee Chair: Dr. Gregory Beaucage 2013
ABSTRACT A recent method to quantify molecular topologies of various materials using small-angle scattering has been used to quantify fractal systems like polymer solutions and ramified aggregate structures. Small angle x-ray and neutron scattering has been used to characterize ceramic aggregates and polymer systems respectively. They structural differences in various systems arise from the competition between thermal and special constraints, which are required to be resolved for proper utilization of respective properties. Ramified aggregates are formed in many dynamic processes such as in flames. Such structures are disordered and present a challenge to quantification. The topological quantification of such nanostructured materials is important to understand their growth processes. Small-angle X-ray scattering (SAXS) is widely used to characterize such nanoparticle aggregates. The details in ceramic aggregates like branch fraction, number of segments in an aggregate and the short circuit path, coordination number and the number of end groups are extracted. The understanding the structural aspects of materials suited for present and future applications for energy and data storage devices is of great importance in wake of the increasing global appetite to harvest energy from renewable sources of energy. While energy creation requires band gap structure in energy states of materials, the data storage capacity relies on efficiency of magnetic domains to be addressed and manipulated at specific sites. The nanoparticles present an interesting case where defect and size manipulation to meet specific requirements of devices is possible. Many of these devices utilize disordered aggregate structures. It is well accepted that transport as well as
!
ii!
magnetic properties depend on the arrangement of the particles in disordered systems. The scope of utilizing nanomaterial aggregate structures requires qualitative as well as quantitative understanding of such structural arrangements. Such understanding requires quantification of topology of disordered aggregates to facilitate a robust relationship between topology and transport properties of material structures of nanoparticles forming nanostructured aggregates are presented. Amongst the polymer system, star polymers have been investigated for their topological details. Symmetric star polymers serve as model macromolecules for understanding branching in long chain molecules. The solution properties of stars have been modeled based on ideal Gaussian statistics or using empirical approaches that incorporate fractal scaling. Neither of these approaches accounts for steric effects on chain structure. In this thesis, a new scaling model for symmetric star polymers is proposed and an associated scattering function is introduced. The structural parameters for the scaling model may be extracted from Small-angle neutron scattering (SANS) data. For analysis of SANS data, the Random Phase Approximation (RPA) using the Debye polymer chain scattering function has been widely used to model polymer blends of linear chains in the melt where it is safe to assume a Gaussian conformation. This is the primary method to obtain the interaction parameter using neutron scattering. When chains display more complicated topologies or when chains are in dilute solutions, the Gaussian scaling no longer applies. In some cases the Zimm double extrapolation has been used to determine the second virial coefficient and the interaction parameter under the assumption that the deviation of chain scaling from a random walk is acceptable in the low qRg region such as when light scattering is used. In order to explicitly determine
!
iii!
the nature of chain scaling, related to topology or solvent quality, as well as to quantifying the thermodynamic interactions, the coupling of the unified scattering function with the RPA equation is proposed to analytically quantify these effects using the proposed scaling model. The scattering function places structural constraints from the model to limit the Unified Function for hierarchal scattering. In order to account for possible inter-arm interaction, the Unified Fit function was modified similar to Benoit’s approach to account for contribution from inter-arm interactions to the overall intensity profile. The utilization of solvent polymer interaction parameter as well as the inter-arm interaction function is proposed to analytically model the nature of chain scaling related to topology or solvent quality as well as to quantify the thermodynamic interaction. A detailed topological quantification of star polymer systems has been able to describe both, good and theta solvent conditions along with effect of functionalities, as well as resolve deviations in chain conformations due to steric interactions between star arms. The scaling model quantifies the distinction between invariant topological features for star polymers and chain tortuosity, which changes with functionality as well as goodness of solvent and steric interactions. An investigation on different solvent conditions for 6-arm polyurethane star polymers was done and the scaling parameters were extrapolation to zero entropy collapsed and extended chain states to understand the possible topological variations in the system. Polyisoprene star polymers under good solvent condition were used to study the effect of functionality on topology of star polymers using the RPA and inter-arm interaction equations, both coupled together with Unified Function to analyze the SANS data.
!
iv!
Copyright 2013 © Durgesh Kumar Rai
!
v!
ACKNOWLEDGEMENTS I am at loss of words in acknowledging the moral support and encouragement provided by my grandfather, my parents, my wife Shipra and my brother Brajesh, who all set us an example of moral strength, and worked hard for me to succeed, so that I could soar high. I am equally thankful to all my friends and well-wishers for the inspiration and help they have selflessly rendered to me, whose loving gesture and best wishes will certainly lead me to the ways of success. Words cannot adequately express my hearty gratitude to my thesis supervisor, Prof. Gregory Beaucage for his affectionate guidance, valuable discussions, constant encouragement, inspiration and warm sympathy throughout the progress of my work. I shall ever be grateful to him and his family for their generous help and benevolence. I hope to keep our interactions intact over future course of academic and personal interactions. I wish to thank my committee members, Prof. Jude Iroh, Prof. Vesselin Shanov and Prof. Vikram Kuppa for their insightful suggestions and never ending support for my thesis work as well as academic courses throughout. Thanks to them and all other Professors at the University of Cincinnati, it has been a great place to study and learn new academic areas and concepts. I owe a lot of thanks to all my professors who took their time to answer my questions and give their perspectives. I would also like to thank Prof. David Britton and Prof. Margit Harting from University of Cape Town along with Prof. Girma Goro from University of Haramaya for their critical comments on some of my thesis work. Special mention of Dr. Jan Illvasky at APS, Argonne National Laboratory and Dr. Lenin He, HFIR and Dr. William Heller at
!
vi!
SNS, Oak Ridge National Laboratory who helped me to achieve proficiency in its technical aspects and data reduction and analysis from Small Angle Scattering instruments. I cherish the solidarity of the life in our laboratory and feel greatly obliged in expressing my indebtedness to my labmates, Dr. Mussie Alemsheged, Dr. Ramchandra Ramachandran, Sachit Chopra, Peter Beaucage, Siddharth Pradhan, Lu Zhang, Maesa Idries and Anne Wissemeier for their overwhelming help, support and guidance all through. Many thanks are due to my lab seniors, Dr. Sathish Sukumaran, Dr. Ryan Breese and Dr. Doug Kohls for their support and care. I would fail in my duties if I fail to devote special thanks to Emmanuel Jonah, Dr. Evariste Minani and Dr. Schadrack Nsengiyumva for their never-ending assistance during our laboratory and project work with USAXS and EQSANS measurements at APS, Argonne National Laboratory and SNS, Oak Ridge National Laboratory, respectively I would like to specially thank Oak Ridge National Laboratory, National Institute of Standards and Technology and Argonne National Laboratory for allowing me to use the experimental facilities in their laboratories. I also wish to express my warm regards to Yuri, Venky and Volker at HFIR, ORNL and Hamounda, Butler and Steve Kline at NCNR, NIST for their help in every respect for and during our experiments. I thank all my friends who have encouraged and helped me during times of difficulty and dejection. I specially acknowledge the support of my friends Parveen Kumar and Sandeep Singh and their families for their loving support, loyal friendship and pleasant company and for all their help, patience and support, especially in difficult times.
!
vii!
CONTENTS Page No
ABSTRACT
ii
ACKNOWLEDGEMENT
vi
LIST OF FIGURES
xi
LIST OF TABLES
xv
SECTION I CHAPTER 1: INTRODUCTION TO AGGREGATE TOPOLOGY
2
1.1 Introduction
3
1.2 Literature Background
4
1.3 Scaling Model
9
1.4 Small Angle Scattering
20
1.5 Conclusions
23
1.6 References
24
CHAPTER 2: APPLICATION OF SCALING MODEL TO DETERMINE BRANCHING IN AGGREGATES
32
2.1 Introduction
33
2.2 Experimental
34
2.3 Results and Discussion
36
2.4 Predictions of physical properties
41
2.5 Conclusions
44
viii
2.6 References
45
SECTION II CHAPTER 3: INTRODUCTION TO SCALING MODEL FOR STAR POLYMERS 48 3.1
Introduction
49
3.2
Phase Diagram
53
3.3
Literature Background
55
3.4
Scaling Model for Symmetric Star Polymers
63
3.5
Small-Angle Neutron Scattering
67
3.6
Conclusions
74
3.7
References
75
CHAPTER 4: APPLICATION OF SCALING MODEL TO INVESTIGATE EFFECT OF SOLVENT CONDITIONS ON STAR TOPOLOGY
83
4.1
Introduction
84
4.2
Results and Discussion
87
4.3
Conclusions
95
4.4
References
96
CHAPTER 5: APPLICATION OF SCALING MODEL TO INVESTIGATE EFFECT OF FUNTIONALITY ON STAR TOPOLOGY
99
5.1
Introduction
100
5.2
Material and Method
103
5.3
Results and Discussion
105
ix
5.4
Conclusions
113
5.5
References
114
APPENDIX APPENDIX A: CALCULATION OF GUINIER AND POWER LAW PREFACTORS FOR MULTI-ARM INTERACTIONS IN STAR POLYMERS 117 A.1
Calculation of generalized prefactors from inter-arm interactions
118
A.2
References
122
x
LIST OF FIGURES CHAPTER 1 Figure 1. Schematic representation of an aggregate structure in 2D. (a) The aggregate is composed of z primary particles of mean diameter, dp. (b) The dark circles represent average minimum path p of fractal dimension dmin. (c) The grey lines represent connective path of mass s and connectivity dimension c. The smaller solid grey circles represent end/branch points.
CHAPTER 2 Figure 1. SAXS/USAXS data for the silicon nano-particle with binders in grey circles fitted with equation (1.19) (in black). Guinier exponential decay is shown in grey dash lines for the primary and fractal structure levels. Figure 2. SEM micrographs of silicon nano-particle aggregates with binder. The scales in the micrographs are 10µm and 500 nm in (a) and (b) respectively.
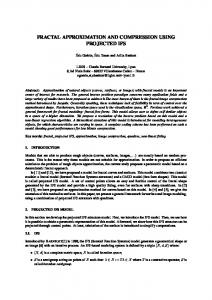
CHAPTER 3 Figure 1. Daoud-Cotton concept of star polymers (valid for f > 8). l and v are monomer length and excluded volume associated with each monomer. Figure 2. Schematic of phase transformation in star polymers with uniform fractal distribution (valid for f < 8) under different solvent conditions. The phase diagram on the right is a schematic phase diagram for a flexible polymer showing the coexistence curve (thick dark grey) and the poor solvent region (solid light grey) of dilute globules. xi
Figure 3. Schemcatic for Benoit’s notation for a branched structure where λlm was defined as the length between two arms or branches. Figure 4. (a) Plots of Benoit function, I(q), scattering from Gaussian chain conformation, I1(q) and contribution from chain interaction part, I2(q), for a 18 arm star polymer and (b) Plots of Benoit functions, I(q) for a 3 arm, 6 arm, 12 arm and 18 arm star polymers. The transition from a non-Gaussian to Gaussian behavior has been marked in (b). The Rg was kept constant at 76 Å. Figure 5. Schematics of urethane molecules forming a PU arm. Six arms are connected to a C60 molecule forming 6 arm C60-PU star polymer with mass, z, fractal dimension, df, and connective dimension, c. A minimum path, p, with a dimension, dmin, which describes molecular tortuosity, is shown in dark units. The connecting path, s, is shown by dotted straight lines. Scaling features are described in text.
CHAPTER 4 Figure 1. (a) SANS data for the C60-star polymer solutions in toluene (θ-solvent) are fitted (dashed curves) with “model” given by equation (3.51); (b) SANS data for the C60-star polymers solutions in DMF are fitted with the dash lines of a slope of −5/3. The 2% data is fitted with the fractal “model” (solid curve) given by Teixiera′s equation (3.13). Figure 2. SANS data for 6 arm symmetric PU star polymer under DMF and toluene solutions fitted with the Unified Function. Data shown digitized from Jeng et al.
xii
Figure 3. (a) The minimum dimension, dmin, connectivity dimension, c, and the radius of gyration, Rg,f, vs. fractal dimension, df. The grey box represents the globule to collapsed regime where the transition is shown in dashed extended line and hollow symbols for collapsed state (b) the connecting path, s, minimum path, p, mole fraction branch content, φbr and meandering mole fraction, φ m vs. fractal dimension, df. (c) φ si for PU and extrapolation to linear chain (left) and collapsed coil (right). Figure 4. Schematics of C60 connected six arm PU polymer under five different chain conformations: extended linear, under DMF and toluene solutions, globule and a collapsed state with densely packed spherical geometry. Sketches are scaled to their comparative sizes.
CHAPTER 5 Figure 1. Schematic of a four arm PI star polymer in 2-D. Four PI arms are connected to a SiCl4 molecule forming 4-arm PI star polymer with mass, z, fractal dimension, df, and connective dimension, c. A minimum path, p, with a dimension, dmin, which describes molecular tortuosity, is shown in dark units. The connecting path, s, is shown by dotted straight lines. Scaling features are described in text. Figure 2. SANS from solution of ~1% by weight polyisoprene in xylene solvent. The Curves have been shifted along y-axis to show overlap. Fit to SANS data for are shown in bold. The curves have been vertically shifted for resolution. Figure 3. The interaction parameter, χ, fractal dimension, df, and the persistent length, lp,
xiii
vs. functionality, f. Figure 4. The minimum dimension, dmin, connectivity dimension, c, and the radius of gyration, Rg, vs. functionality, f. Figure 5. (a) The minimum path, p, connecting path, s, and fractal mass, z, vs functionality, f. (b) The minimum path to total mass and connecting path to total mass in percentage and connecting path normalized by functionality (s/f) vs functionality, f. Figure 6. The mole fraction branch content, φbr and meandering mole fraction, φ m vs. functionality, f. Figure 7. φ si vs. functionality, f
xiv
LIST OF TABLES
CHAPTER 2 Table 1. Fitting Parameters using the Unified Function Table 2. Calculated Scaling Parameters using the Unified Function
CHAPTER 4 Table 1. Fitted and calculated parameters for 6-arm C60-PU
CHAPTER 5 Table 1. Synthesis and characterization details for PI star polymers
xv
SECTION I
AGGREGATE TOPOLOGY
1
CHAPTER 1 INTRODUCTION TO AGGREGATE TOPOLOGY
*Parts of this Section published in D. K. Rai, G. Beaucage, E. O. Jonah, D. T. Britton, S. Sukumaran, S. Chopra, G. Goro Gonfa, and M. Härting, “Quantitative Investigation of Aggregate Systems", Journal of Chemical Physics, 137, 044311 (2012); and D. K. Rai, G. Beaucage, J. Ilavsky, H. Kammler, S. Pratsinis, “Investigations into aggregate growth dynamics via in situ structural quantification of flame synthesized silica nanoparticle aggregates",to be communicated.
1.1 Introduction The determination of structural topology is important to understand the rules that govern the physical properties of aggregates. Quantification of topology is often an elusive prospect due to difficulties in assessing quantities that ably represent the disordered structures. Amongst various available options, one of the widely used methods is the application of scaling theory, which relies on the “averageness” of physical or mathematical quantities associated with random structures. This approach should be particularly useful when it comes to determining topological quantities for disordered systems. There are various scaling theories that have been proposed to understand disordered structures in the last few decades. A sizable work regarding understanding electrical properties of disordered structures has been carried out using percolation theory where the concept of site-percolation probability as a function of reduced fraction of occupied/present sites was introduced
1, 2
. The approach essentially relies on the
determination of the critical concentration of occupied sites where a connected path of the order of the size of the entire system is formed. This method was validated by theory as well as experiment
2, 3
. The scaling approach was subsequently explored for
percolation models, but was found to be phenomenological and the theory had issues due to its semi-empirical nature 3-6.
3
1.2 Literature Background A sizable work regarding understanding electrical properties of disordered structures has been carried out using percolation theory where the concept of site percolation probability as a function of reduced fraction of occupied/present sites was introduced, analogous to lattice percolation models for flow of liquid through porous media
1, 2
. The approach essentially relies on determination of critical concentration of
occupied sites where a connected path (from each site to each other) of the order of size of entire aggregate structure was formed. This methodology was validated by theory as well as experiments
2, 3
. The scaling approach was subsequently explored for percolation
models, but was found to be more phenomenological
3-5
. The idea of percolation was
inherent to the composite and mixed systems and initial investigations into the transport properties of carbon black composite systems were done using various statistical, geometric and thermodynamic models
5-9
. Subsequently, percolation theory was applied
to investigate metal-plastic composite and aggregate systems
4, 10
.
Thereafter, the
percolation theory was generalized to explain many physical, chemical and biological processes ranging from flow of liquid in porous media to spread of disease in a population, communication in resistor networks, quarks in nuclear matter, dilute magnets, glass transition and so on
2, 6
. The theory was well established and it was a great step
forward in the quest to put forward a basis to estimate properties of aggregate structures. Nevertheless, the theory in itself had issues due to its semi-empirical nature 6. The usage of scaling theories to understand transport in aggregate structures was based on the mass fractal dimension of the lattice, df, and that of a random walk upon the lattice, dw 7, 11, 12. Alexander and Orbach (AO) calculated exponents for the density of
4
energy states (by taking the Laplace transform of the autocorrelation function) using the spectral or fracton dimension, ds, as, g (ε ) ~ ε
ds −1 2
, where ε is the energy or frequency,
which yields a dimensional description of the density of states given by, ds = 2df /dw 13. From the spectroscopic point of view, it is interesting to note that the intensity of the Strokes spectrum in amorphous materials follows the band density of states (reduced by frequency and thermal population of initial states) 14. The spectral or fracton dimension, ds, yields a dimensional description of density of states given by, ds = 2df /dw,. Thouy et al. examined the dynamic characteristics of spectral dimension by studying Brownian motion on a fractal aggregate
15
. Therefore the spectral dimension was a remarkably
helpful result to account for spectral profiles directly from structure and vice versa 13. AO claimed that this spectral dimension is universal and showed that ds = 4/3 (⇒ dw = 3df/2) independent of Euclidean dimensionality, which is termed the “AO conjecture” 13. The AO conjecture was questioned for the superuniversality of ds and Aharony and Stauffer (AS) demonstrated that the AO conjecture may not hold above some critical df >2 16. AS and Sahimi argue that the AO conjecture might be exact only for the largest percolation cluster at critical percolation concentrations 12, 16, 17. AS argued that for df < 2, dw = df +1 against dw = 3df/2 from AO conjecture
16
. The AS conjecture was also
questioned and it was shown that it may not hold for lattice animals as it showed that the dimension of the backbone (which they called the “minimum path”) of the structure remains constant for 1< df 2, a 2-D projection, i.e. a micrograph, should appear to fill space, as shown on figure 2. The total number of branches per average minimum path was 28, each consisting of around 1,700 primary particles on average. The number of end groups is ~ 6,710 while number of inner segments is about 6,680.
38
Table 2. Calculated Scaling Parameters using the Unified Function
Calculated Scaling Parameters
Magnitudes
Degree of aggregation, z
47,600±300
Sauter mean diamter, dp (nm)
42.9±0.7
Geometric standard deviation, σ g
1.54
Minimum dimension, dmin
1.14±0.04
Connectivity dimension, c
2.32±0.02
Branch fraction, φbr
0.998±0.007
Number of branch points in aggregate, nbr
6,710±70
Number of branch points in minimum path, nbr , p
28±1
Total number of segments in aggregate, n s , z
13,420±90
Number of primary particles per branch, z br
1,700±30
Average number of particles per segment, z s
3.6±0.4
Number of inner inner segments, ni
6,680±70
Average coordination number, CN
2.14±0.05
Specific surface area, SSA (m 2 g )
(60 ± 1)
39
The average coordination number in the aggregate, CN ≈ 2.14, was lower than reported values obtained for DLA’s from simulation (≈ 3)
9, 10
. Comparison with the
micrographs in Figure 2 is also inconclusive concerning CN. The specific surface area of the primary particles was calculated to be 60 m 2 g using equation (1.24) and the bulk density of silicon.
40
2.4 Predictions of physical properties Possible relationships between the scaling parameters of the aggregate structure and some important physical properties can be postulated. For example it is apparent that the microstructure of the layer will be the dominant factor affecting its mechanical properties. Effectively, the printed silicon layers consist of a dense network of clusters of silicon nanoparticles bound by Van der Waals interactions similar to other nanoparticle aggregates such as titania and silica
9
which are constrained by the substrate 3. In some
sense the material could be envisioned as similar to a granular solid 11. For low applied stress, jamming of particle movement results in elastic and plastic behavior through contact equilibrium forces such as van der Waals interactions
12
. In such cases
simulations show the presence of “force chains” or preferred paths through the network for the transfer of mechanical force 11, which could bear some relation to the description of the particle chains developed in this work. When frictional forces are included in the models 11, allowing tangential surface forces, the elastic regime is not only enhanced but shear elastic properties are enabled. However, currently all models of granular solids are limited to either regular close-packed or random structures, and it is not yet clear how to incorporate the observed fractal packing. There are existing models for the mechanical properties of fractal aggregates. For instance, Witten, Rubinstein, and Colby calculated the modulus of aggregates, Ef
13
,
which may be obtained in terms of the scaling parameters as,
& dp E f = Ep $ $R % g, f
# ! ! "
(3+ d min )
(2.1)
41
where, Ep is the modulus of the aggregate material or the effective modulus of the bond between primary particles, whichever is softer. Therefore in general, the modulus of an aggregate is expected to increase with the diameter of the primary particle, dp, and decreases with increasing tortuosity of the minimum path, dmin, and aggregate size, Rg,f. Ep, which may be different for compression and tension, may be difficult to obtain except through application of equation (2.1).
In the case of highly dense aggregates,
entanglements amongst particles in the aggregate may prevent relative motion at high strains beyond the range of equation (2.1). Therefore, it is highly desirable that we have a quantitative model which not only includes branches and loops in the primary structure but all possible mechanical constraints. Similarly, simple physical arguments may be used to understand transport properties in fractal structures. For example, neglecting the intrinsic behavior of charge transfer at internal junctions, the electrical conductance should depend on not only the length of the minimum path, but also the number of parallel electric paths and the number of cross connections. For a single path, the resistance will increase as the minimum path, p, increases and will decrease as the cross sectional area of the minimum path, dp2, decreases. This should lead to a contribution to the dependence of electrical resistance, Ω, of the form
⎛ p⎞ Ω( p) ~ ⎜ 2 ⎟ ⎝ dp ⎠
or,
& z 1c # Ω( z ) ~ $ 2 ! $ dp ! % "
(2.2) Equation (2.2) is, however, not an accurate representation of the resistance through all possible percolation paths and further work will need to consider a bond
42
percolation model 1 of series and parallel connections between two ends of the aggregate considering each bond as an electrical element and using the parameters available from the scaling model. As for the consideration of the mechanical properties, this will only be possible with a detailed quantitative description of the microstructure as developed in this work. It is important to understand that the discussion made above considers properties of the aggregate structure (consisting of primary particles and secondary structures), which typically spans microscopic sizes in the silicon sample. A macroscopic structure is expected to encompass a tertiary structural arrangement that could follow similar scaling relationships.
43
2.5 Conclusions A new method to evaluate topological information about aggregate structure was demonstrated. It was shown to be viable for these inorganic layered structures. Details of the ramified structure were elaborate using SAXS/USAXS data such as the branch fraction, number of segments in an aggregate, the minimum path, the coordination number and the number of end groups. From these values an average cartoon of the aggregate can be constructed. A sense of these numbers may be made if we think of a highly agglomerated structure, agreeing with the micrographs. We have proposed relationships between the scaling analysis and physical properties of aggregates. Based on a simple topological model, we have demonstrated a method to quantify disordered structures that may give more insight into the physical properties of aggregates. The scaling model was used to demonstrate a simple approach in order to predict electrical properties using simple arguments based on structural details. We plan to explore these predictions in future experimental work.
44
2.6 References 1.
Zallen, R., The Physics of Amorphous Solids. John Wiley & Sons: 1983; p 320
2.
Kirkpatrick, S., Percolation and Conduction. Reviews of Modern Physics 1973,
45, 574-588. 3.
Britton, D. T.; Harting, M., Printed nanoparticulate composites for silicon thick-
film electronics. Pure and Applied Chemistry 2006, 78, 1723-1739. 4.
Ilavsky, J.; Jemian, P. R., Irena: tool suite for modeling and analysis of small-
angle scattering. Journal of Applied Crystallography 2009, 42, 347-353. 5.
Ramachandran, R.; Beaucage, G.; Kulkarni, A. S.; McFaddin, D.; Merrick-Mack,
J.; Galiatsatos, V., Branch Content of Metallocene Polyethylene. Macromolecules 2009, 42, 4746-4750. 6.
Beaucage, G., Determination of branch fraction and minimum dimension of mass-
fractal aggregates. Physical Review E 2004, 70, 031401. 7.
Beaucage, G., Small-angle scattering from polymeric mass fractals of arbitrary
mass-fractal dimension. Journal of Applied Crystallography 1996, 29, 134-146. 8.
Beaucage, G., Approximations leading to a unified exponential power-law
approach to small-angle scattering. Journal of Applied Crystallography 1995, 28, 717728. 9.
Friedlander, S. K., Smoke, Dust, and Haze: Fundamentals of Aerosol
Dynamics 2ed.; Oxford University Press, USA: 2000; p 432 10.
Weber, A. P.; Friedlander, S. K., Relation between coordination number and
fractal dimension of aerosol agglomerates. Journal of Aerosol Science 1997, 28, S765S766.
45
11.
Goldenberg, C.; Goldhirsch, I., Friction enhances elasticity in granular solids.
Nature 2005, 435, 188-191. 12.
Peyneau, P. E.; Roux, J. N., Solidlike behavior and anisotropy in rigid frictionless
bead assemblies. Physical Review E 2008, 78, 13. 13.
Witten, T. A.; Rubinstein, M.; Colby, R. H., Reinforecement of rubber by fractal
aggregates. Journal De Physique Ii 1993, 3, 367-383.
46
SECTION II
SCATTERING FUNCTION AND SCALING MODEL FOR STAR POLYMERS
47
CHAPTER 3* INTRODUCTION TO SCALING MODEL FOR STAR POLYMERS
*Parts of this Section to be communicated to D. K. Rai, R. Ramachandran, G. Beaucage; “Scaling model and scattering function for symmetric star polymers" and D. K. Rai, G. Beaucage, K. Ratkanthwar, N. Hadjichristidis, H. Kunlun, D. Uhrig; “Simultaneous determination of the interaction parameter and topological scaling features of polymers in dilute solutions”.
3.1 Introduction Star polymers are branched macromolecules with all branches or “arms” emanating from the center. Predictably, conformational properties of star polymers are different from those of linear chains and depend on the functionality (number of arms). The physical properties of branched polymers are different from linear chains of comparable molecular weight
1-3
. While linear polymers attain random conformations,
star polymers tend to be more compact and symmetric for similar molecular weights. Amongst various possible branched architectures, star polymers are one of the simplest topologies, have gained significant research interests, and have been widely studied from the perspective of synthesis, structure and properties
4-8
. The presence of
structural constraints, owing to the common branch point, leads to differences in chain conformation and thermodynamics in star polymers compared to their linear counterparts e.g. star polymers have rather different equations of state and the second virial coefficient of the star is lower than that of linear polymers 9-15. Daoud & Cotton (D&C) and later Birshtein & Zhulina addressed the issue of minimization of the free energy due to intermolecular interactions by generalizing the de Gennes’s scaling (blob) model for star polymers.
49
Figure 1. Daoud-Cotton concept of star polymers (valid for f > 8). l and v are monomer length and excluded volume associated with each monomer 50
D&C describe the conformation of a star polymer with f arms with l and v as the monomer length and excluded volume
10, 11, 16
. According to the D&C model, a star
polymer has a core of radius r2 ~ f 1/2l, where the monomer concentration φ(r) is constant since φ(r) ~ M/V and for a 3-dimensional solid, M ~ (r/l)3 and V ~ (r/l)3. Thereafter, φ(r) varies as (r/l)-1 between r2 and r1 which fits Gaussian scaling since for a Gaussian chain, M ~ (r/l)2 and V ~ (r/l)3 leading to φ(r) ~ (r/l)-1, where r1 ~ f
1/2 -1
v l. Finally, φ(r) ~ (r/l)-4/3
for r > r1.which suggests good solvent scaling for larger distances from core since for a chain under good solvent condition, M ~ (r/l)5/3 and V ~ (r/l)3 leading to φ(r) ~ (r/l)-4/3 Essentially, the inter-arm repulsive interaction is minimized by assuming that successive segments of each arm are confined to growing spherical blobs that can fit into a cone as the arms extend away from the branch point (core). The star polymer adopts a conformation in which each of the f arms is constrained within a cone of solid angle
4π f radiating from the branch point which leads to increases in the mean separation between the arms with the distance from the center
17
. As per the D&C model, the star
polymer gets confined to shells of decreasing chain density with a collapsed core in some cases and it works well for stars with large functionalities (typically f > 8) as shown in figure 1. There is no scattering function associated with the D&C model. For star polymers with smaller functionalities (f ≤ 8), the chain structure does not display core/shell morphology but it rather acquires a uniform chain density as per the Benoit model for star polymers
18, 19
. The functionality determines the conformational
constraint on the overall structure and based on the functionality, two regimes of star polymer structure can be projected viz, the D&C regime with large f (f > 8) as shown in figure 1 and large mass with colloid like conformations and the Benoit regime with
51
smaller f (f ≤ 8) and moderate mass attaining macromolecular conformations, as shown on figure 2. Zimm and Stockmayer evaluated the radius of gyration of a star polymer with f arms in dilute solution, R gstar , assuming that each arm is a Gaussian chain as 9, 15,
R
star g
=R
arm g
&3 f − 2 # $ f ! % "
1
2
(3.1),
where, Rgarm is the radius of gyration of a Gaussian linear chain in dilute solution of the length/mass of one arm. A notable result inferred from equation (1) is that the ratio, R gstar R garm has a maximum limiting magnitude of
3 as, f → ∞ . This result is rather
meaningless since steric constraints would render the arms highly non-Gaussian at high f. Moreover, the results from the Gaussian approximation for stars may not hold under virtually any conditions since the intra-molecular excluded volume becomes more significant due to increase in segment-segment interactions near the branch point and the Gaussian assumption fails to recognize the singular nature of the branch point
17
.
Therefore, for stars with higher functionality, the arms of the star should behave as stiff chains with a limiting conformation of rigid straight arms for very high f. Assuming a limiting rigid straight arm configuration for stars, R gstar R garm ~ z arm ,for f → ∞ , where
z arm is the mass associated with each arm and Rgarm is assumed to be Gaussian. This is significantly larger than the prediction of equation (3.1) at large f.
52
3.2 Phase diagram An organic polymer under good solvent conditions shrinks as it approaches the θsolvent condition (at the θ-temperature), which occurs at the critical point where the miscibility is in kinetic equilibrium with phase separation. Therefore, phase separation occurs before the coil collapse transition in polymer solutions of concentration higher than the overlap concentration, f*, as shown in the phase diagram in figure 2 due to the fact that phase separation is a cooperative process while collapse can occur in an isolated chain
20
. Well below the overlap concentration polymer chains are isolated, while the
internal concentration of a chain remains at f* regardless of dilution. The attempt of chains to phase separate under these conditions leads to a type of coil to globule transition, distinguishable from protein and nucleic acid folding in that this transition does not involve hydrophobic/hydrophilic interactions or targeted hydrogen bonding or other specific pairwise associations which lead to conformational collapse, but is strictly thermodynamic phase separation moderated by chain connectivity (It should be noted that protein folding generally occurs at high concentrations in aqueous solutions). This frustrated phase separation is shown in the grey region of figure 2 21. The frustrated phase separation phenomenon has been predicted by theories and simulations 22-25. The isolated coil-globule transition was experimentally reported under poor solvent conditions, e.g. for polystyrene in cyclohexane below the θ-temperature 26-28.
53
Figure 2. Schematic of phase transformation in star polymers with uniform fractal distribution (valid for f ≤8) under different solvent conditions. The phase diagram on the right is a schematic phase diagram for a flexible polymer showing the coexistence curve (thick dark grey) and the poor solvent region (solid light grey) of dilute globules. The number and structure of arms have been found to have direct consequences on rheological properties of branched polymers
29-31
. Small-angle neutron scattering
(SANS) has been widely used in the literature to characterize the arm architecture 13, 15, 3234
.
54
3.3 Literature Background Scattering techniques like light scattering and small-angle neutron scattering (SANS) are commonly used to characterize the structure of star polymers 34-36. SANS is an effective tool, which provides high contrast that is achieved using deuterated solvents. Scattering techniques are utilized to study the static structures of macromolecules. At low concentrations, the structure factor is 1. Definition of the form factor is given by Debye’s scattering function 37;
1 P( q ) = 2 n
n
n
∑∑
exp(−iqrij )
(3.2)
i =1 j =1
which is true for any discrete object with n number of scattering units where, q = 4π
( )
θ , is the scattering wave vector for a radiation of wavelingth λ and rij is λ sin 2
the vector joining two scattering points of a polymer. The sums extends to n scattering points
38
. The form factor for evaluating a Gaussian chain is obtained by the Debye
equation 38, 39;
I (q) =
2 −x e − (1 − x) x2
[
]
(3.3)
where, x = q2nl2/6 with n as the number of chain segment each of length l in the polymer. Equation (3.2) is further modified by Benoit to account for branching in polymer chains where a chain is considered to be formed of “f” branches having n1, n2….nf elements respectively 40:
n = n1 + n2 .....nl + ...nm + ...n f
(3.4)
55
Figure 3. Schemcatic for Benoit’s notation for a branched structure where λlm was defined as the length between two arms or branches 40 Benoit defines a branch as “a part of the chain lying between two branching points or one branch point and one end” as shown in figure 3. The structure factor is then given by:
1 P(q) = 2 n
s
nl
nl
nl
nl
∑∑∑ exp{−iqr i − j } +∑∑∑∑ exp{−iqr i + j + λ
lm
l =1 i =1 j =1
}
(3.5)
l , m l ≠ m i =1 j =1
where, λlm in the second summation is defined as the “number of links between the nearest elements of the branches l and m”. Assuming n to be large, the above summation over i and j gives:
56
# 2 2 & s P(q) = + 2 $− ∑ (1 − e − xl ) +∑∑ e −iqλlm (1 − e − xl )(1 − e − xm )! (3.6) x x % l =0 l ,m l j "
(4.1)
where, x = nb2Q2/6 with n for the number of chain segments in each arm and b is the persistence length of the polymer chain. A plot of I(q) vs. q based on equation (4.1) is shown in figure 1(a) that highlights the issues with the above mentioned approximations.
!
84
Figure 1. (a) SANS data for the C60-star polymer solutions in toluene (θ-solvent) are fitted (dashed curves) with “model” given by equation (4.1); (b) SANS data for the C60star polymers solutions in DMF are fitted with the dash lines of a slope of −5/3. The 2% data is fitted with the fractal “model” (solid curve) given by Teixiera′s equation (3.12) 4 Jeng et al. are able to successfully fit the SANS data curves with their equation which is supposedly able to take account of functionality as well as polydispersity in star polymers. They obtain a consistent value of 30 Å for λij from their fits for all concentrations. This magnitude of λij is too high to put forward a correct description of the topology since, by definition, the magnitude of λij may not be larger than ~10 Å (≈ πd/2, d=7.1 Å). A magnitude of 30 Å for λij relates to a condition where the chains actaully cease to see each other near the vicinity of core or branch point. Mathematically, the interaction term is pushed towards higher q-values so that the influence of the interaction term remains negligible in the the fractal regime of interest. A value of 30 Å for λij just serves the purpose of taking the away the possible influence of intra-arm interactions in the star polymer and essentially serves as a Gaussian distribution function. !
85
Therefore the fitting eludes the purpose of interaction originally envisioned by Benoit 5. Contrary to their claims, Jeng et al. are not able to predict the true conformation of their star polymer under θ-solvent conditions. This is because any analysis based on the Gaussian function would result in fractal dimension, df = 2, which is an underestimation of fractal dimension for star topologies in θ-solvent 6. Jeng et al. make use of fractal model described by Teixiera to analyze C60-PU solution under good solvent condition 7. Data fits using Teixiera’s function are shown in figure 1(b) 2. Teixiera’s function failed to fit two out of three concentrations of C60-PU in dimethyl formaldehyde and has failed to provide a convincing picture of the actual molecular structure. The issue with the function arrives from the application of a cut-off factor ξ in the expression for correlation function which was originally proposed by Debye and Bueche 1949. This function is discussed in the next section. We will use the equation (3.51) derived in previous chapter 3, where, K v =
v pol , vsol
the ratio of volumes of polymer and solvent monomer units respectively, which come out to be 0.87712 for polyurethane with DMF solvent to understand the thermodynamics and topology in these structure.
!
86
4.2 Results and Discussion Jeng’s SANS data from C60-PU stars under both good solvent (DMF) and θsolvent (toluene) conditions can be used to demonstrate the flexibility of the scaling model approach. Data from C60-PU is acquired by digitizing figures 1 and 2 from Jeng et al. 2. Toluene is close to a θ-solvent at room temperature while DMF is a good solvent at room temperature. For SANS from C60-PU in toluene [(figure 1);2], the low q values from a low concentration solution of 0.04 g/cc and the higher q values from a high concentration solution of 1 g/cc were taken and scaled to concentration since scattering at low q is affected by concentration screening
8, 9
, while scattering at high q is not. For
the DMF solution [(figure 2);2], the 2 g/cc data was used since a low concentration data set was not available. The Unified Fits for both the solvent conditions are shown in figure 2. For both curves a Guinier’s knee in log I(q) vs. log q is observed near q = 0.02 Å-1. For q > 0.04 Å1
, a power-law scaling regime is observed. Near the persistence length, at q ~ 0.1 Å-1, a
transition in slope is evident in the toluene data. A power-law decay of -1 is compared to the data at higher-q in figure 2. The Unified Fit is described by equation (3.51) for a star polymer with f arms, involves 7 free parameters as discussed above, lp, Gf, Kp, Rg,f, df, z and χ .
!
87
Figure 2. SANS data for 6 arm symmetric PU star polymer under DMF and toluene solutions fitted with the Unified Function 10-14. Data shown digitized from Jeng et al. 2 The results obtained by analysis of the SANS from C60-PU star polymers using Unified Fit is tabulated in Table 1.
!
88
Table 1. Fitted and calculated parameters for 6-arm C60-PU
df
dmin
z
c
φbr
φm
φ si
p
s
Rg(Å)
1.25
1
229
1.25
0.66
0
1
77
229
313
1.73
1.4
225
1.23
0.64
0.79
0.137
83
48
124
(7)
(1)
(7)
(3)
(3)
(3)
(9)
(9)
(4)
(12)
2.3
1.8
233
1.28
0.69
0.91
0.035
70
19
76
(1)
(1)
(11)
(4)
(3)
(3)
(4)
(7)
(3)
(9)
Globule
~2.99
2.4
229
1.25
0.66
0.96
0.016
43
229
44
Collapsed
3
1
229
3
1
1
0
43
229
17
Parameters Extended Chain
DMF
Toluene
Figure 2 shows that the fractal dimension for the 6-arm star varies with solvent quality since the scaling regime slope differs between the two curves. Appreciating the possible effects of solvent and thermodynamics on star polymer structure, we may think of two limiting cases of possible conformations, one with straight arms and another, with chain collapse, both of which represent limiting states with zero conformational entropy. Table 1 shows fitted and calculated parameters for C60-PU in DMF and toluene solutions along with extreme cases of straight arm and collapsed C60-PU structures that can be extrapolated from the measured values using equations (3.15) to (3.21). χ came out to be 0.47 for PU-DMF system. Apart from the parameters mentioned in table 1, persistence length,
l p = 5.7 ± 0.07 Å and polydispersity factor, C p ≈ 1.4 ± 0.1 were obtained from the
!
89
Unified Fit for DMF and toluene solutions. The connectivity dimension, c, is calculated from equation (3.20) to be c = 1.25 which is very close to the fit values of 1.23 ± 0.03 and 1.28 ± 0.04 for DMF and toluene solutions respectively, thereby supporting the view that connectivity remains constant independent of solvent conditions and that the molecules display the connectivity of a 6-arm star. The connectivity dimension is expected to rise to 3 when coils collapse takes place (figure 3 (a)).
Figure 3. (a) The minimum dimension, dmin, connectivity dimension, c, and the radius of gyration, Rg,f, vs. fractal dimension, df. The grey box represents the globule to collapsed regime where the transition is shown in dashed extended line and hollow symbols for collapsed state (b) the connecting path, s, minimum path, p, mole fraction branch content,
φbr and meandering mole fraction, φ m vs. fractal dimension, df. (c) φ si for PU and extrapolation to linear chain (left) and collapsed coil (right).
!
90
The magnitude of dmin is 1.4 and 1.8 for DMF and toluene respectively which deviates from the good and θ-solvent values of 1.67 and 2 due to steric effects. The value of dmin is projected to be 1 for straight arms, 2.4 for a globular 6-arm star structure before collapsing and finally attains a magnitude of 1 for a collapsed structure since a straight path can traverse a solid 3-D object. At collapse, c → d f → 3 . The scaling parameters, c, dmin, φ m , φbr , φ si , p, s and Rg,f, have been plotted as function of df, in figure 3. The magnitude of z for DMF and toluene solutions are approximately the same and we have used an average value z = 229 for the straight-arm and collapsed structures. The Unified Fit gives a fractal dimension, df = 2.3 in toluene which is a reasonable representation of a star polymer structure. Jeng et al.
2
calculate values of persistence
lengths using the point of deviation from a horizontal line in a plot of Iq2 vs q 15, 16. This method is valid only for df = 2. The value reported by Jeng et al. using this method is ~12 Å
2
while the value from the Unified Fit, appropriate for any fractal dimension and
described here, is ~ 5.7 ± 0.7 Å. A lower value of connective path, s, is observed at high df as increasing tortuosity in the system results in lowering of the core to end-point distances. The connective path values, s = 19 for toluene and s = 48 for DMF solution, have been determined using equation (3.15). The minimum path, p, given by equations (3.14) or (3.15), depends on z and the functionality f or connectivity c and remains almost the same for all conformations where the individual identity of arms is intact and falls at the extrapolated collapsed state where it forms a straight path across the solid structure. The meandering mole fraction, φ m , has been calculated using equation (3.12) and increases with df from a values of 0 for extended chain to 0.96 for a globule for the 6-arm star, as given in table 1.
!
91
This variation reflects an increase in chain coiling with higher df. Being a 6-arm star, the mole fraction branch content, φbr ~ 0.66, remains constant independent of df as given by equation (3.18). This is consistent with observed magnitudes of 0.64 ± 0.03 and 0.69 ± 0.03 obtained for the DMF and toluene solvent conditions respectively. This is an important parameter for quantification of star functionality since it can be directly obtained by analysis of scattering data using the scaling approach. Moreover, it is a significant improvement over previous methodologies to compute star functionalities using scattering techniques where Zimm and Stockmayer’s relations given by equation (3.18) were utilized, due to reasons discussed in the chapter 3 17-19. The magnitudes of Rg,f obtained from the Unified Fit for C-60 PU in DMF and toluene are 124 ± 12 Å and 76 ± 9 Å respectively while that for the straight-arm and globule, as calculated from equation (3.17), are 313 Å and 44 Å respectively. For collapsed structures, Rg can be estimated from p collapse
Rg
collapse
=
(35 )R
collapse
&6 # = $ z! %π "
1/ 3
l p = 2 R collapse and
(assuming a spherical structure), yielding 17 Å. The scaling
analysis for coil to globule transition predicts a reduction in size to nearly half. From the scaling perspective, the calculations for globule are based on maintaining individual identity of the arms reflected by constant c and φbr . Quantification of steric constraints with varying solvent goodness is shown in the plot of φ si as a function of df in figure 3(c). The plot shows that φ si steadily decreases with increasing df. The importance of φ si lies in its capacity to offer a direct scaling link between thermodynamics and structure of star polymers. The magnitude of φ si is 1 for the extended structure, which serves as the
!
92
normalization factor for the quantity. φ si decreases sharply to 0.111 for the DMF solvent condition which means that the effect of steric hindrances in expanding the coil in good solvent is 11.1% of the maximum possible extension (or maximum steric hindrance) for the C60-PU. Further, φ si is 0.024 for the toluene solvent indicating a smaller effect of steric hindrance compared to DMF.
Figure 4. Schematics of C60 connected six arm PU polymer under five different chain conformations: extended linear, under DMF and toluene solutions, globule and a collapsed state with densely packed spherical geometry. Sketches are scaled to their comparative sizes. A descriptive model for a symmetric 6-arm star polymer and any symmetric star polymer in general, may be presented in terms of constant parameters z, c, p, φbr and f, which depend on the chemical structure and variables dmin, s, Rg,f , φ m and φ si , which depend on solvent quality and steric interactions. Figure 4 presents a qualitative model
!
93
for a 6-arm C60-PU based on the comparative assessment of fractal parameters from the Unified Fit and extrapolation to collapsed and extended coil using scaling relations.
!
94
4.3 Conclusions A unique approach to quantify the effect of steric interactions on the overall conformation under given solvent condition using φ si was presented. The other important objective of this paper was the utilization of the scaling model to extrapolate the calculated magnitudes of fractal parameters for the limits of structural conformations, viz the rigid extended chain, globule and collapsed structures. The scaling parameters were calculated and extrapolated, as well as measured for features of five different possible conformations for a 6-arm C60 connected PU. The scaling approach presents a simple, unique and robust methodology to obtain details for the complete spectrum of structural and thermodynamic possibilities for symmetric star polymers of low functionalites.
!
95
4.4 References 1.
Wignall, G. D.; Affholter, K. A.; Bunick, G. J.; Hunt, M. O.; Menceloglu, Y. Z.;
Desimone, J. M.; Samulski, E. T., Synthesis and SANS structural characterization of polymer-substituted fullerenes (flagellenes). Macromolecules 1995, 28, 6000-6006. 2.
Jeng, U. S.; Lin, T. L.; Wang, L. Y.; Chiang, L. Y.; Ho, D. L.; Han, C. C., SANS
structural characterization of fullerenol-derived star polymers in solutions. Applied Physics a-Materials Science & Processing 2002, 74, S487-S489. 3.
Benoit, H., On the effect of branching and polydispersity on the angular
distribution of the light scattered by gaussian coils. Journal of Polymer Science 1953, 11, 507-510. 4.
Jeng, U. S.; Lin, T. L.; Wang, L. Y.; Chiang, L. Y.; Ho, D. L.; Han, C. C., SANS
structural characterization of fullerenol-derived star polymers in solutions. Applied Physics a-Materials Science & Processing 2002, 74, S487-S489. 5.
Benoit, H., On the Eflect of Branching and Polydispersity on the Angular
Distribution of the Light Scattered by Gaussian Coils. J. Polym. Sci. 1953, 11, 507-510. 6.
Rai, D. K., Ramchandran, R; Beaucage, G., Scaling Model for Symmetric Star
Polymers. 2010. 7.
Teixeira, J., Small Angle Scattering from fractal systems. Journal of Applied
Crystallography 1988, 21, 781-785. 8.
Murase, H.; Kume, T.; Hashimoto, T.; Ohta, Y.; Mizukami, T., Shear-induced
concentration fluctuations in ultrahigh modecular weight polyethylene solutions .1. Observations above melting point. Macromolecules 1995, 28, 7724-7729.
!
96
9.
Strobl, G., The Physics of Polymers: Concepts for Understanding Their
Structures and Behavior. 3rd ed.; Springer: New York, 2007. 10.
Beaucage, G., Approximations leading to a unified exponential power-law
approach to small-angle scattering. Journal of Applied Crystallography 1995, 28, 717728. 11.
Beaucage, G., Small-angle scattering from polymeric mass fractals of arbitrary
mass-fractal dimension. Journal of Applied Crystallography 1996, 29, 134-146. 12.
Beaucage, G.; Kammler, H. K.; Mueller, R.; Strobel, R.; Agashe, N.; Pratsinis, S.
E.; Narayanan, T., Probing the dynamics of nanoparticle growth in a flame using synchrotron radiation. Nature Materials 2004, 3, 370-374. 13.
Ramachandran, R.; Beaucage, G.; Kulkarni, A. S.; McFaddin, D.; Merrick-Mack,
J.; Galiatsatos, V., Persistence Length of Short-Chain Branched Polyethylene. Macromolecules 2008, 41, 9802-9806. 14.
Ramachandran, R.; Beaucage, G.; Kulkarni, A. S.; McFaddin, D.; Merrick-Mack,
J.; Galiatsatos, V., Branch Content of Metallocene Polyethylene. Macromolecules 2009, 42, 4746-4750. 15.
Roe, R. J., Methods of X-ray and Neutron Scattering in Polymer Science. Oxford
University Press, USA: New York, 2000. 16.
Kratky, O.; Porod, G., Diffuse small-angle scattering of x-rays in colloid systems.
Journal of Colloid Science 1949, 4, 35-70. 17.
Zimm, B. H.; Stockmayer, W. H., The dimensions of chain molecules containing
branches and rings. The Journal of Chemical Physics 1949, 17, 1301-1314.
!
97
18.
Douglas, J. F.; Roovers, J.; Freed, K. F., Characterization of branching
architecture through universal ratios of polymer-solution properties. Macromolecules 1990, 23, 4168-4180. 19.
Tsitsilianis, C.; Ktoridis, A., Determination of brancihng of star-shaped
macromolecules
by
gel-permeation
chromatography.
Communications 1994, 15, 845-850.
!
98
Macromolecular
Rapid
CHAPTER 5* APPLICATION OF SCALING MODEL TO INVESTIGATE EFFECT OF FUNCTIONALITY ON STAR TOPOLOGY
*Parts of this Section to be communicated to D. K. Rai, G. Beaucage, K. Ratkanthwar, N. Hadjichristidis, H. Kunlun, D. Uhrig; “Simultaneous determination of the interaction parameter and topological scaling features of polymers in dilute solutions".
5.1 Introduction ! Star polymers provide a model architecture to examine chain topology 1-7. The presence of a branch point leads to topological rearrangements of individual arms in dilute solutions and therefore the thermodynamic and structural characteristics differ from their linear counterparts
1, 3, 6, 8-13
. It is obvious that the branching characteristic in stars is
determined by the functionality of stars, which affects the conformational redistribution in space as well as the rheological properties 11, 14-19. A scaling model for symmetric star polymers and an associated scattering function are presented, which can simultaneously determine the conformational as well as thermodynamic
parameters.
In
the
scaling
model,
a
topologically
complex
macromolecule, such as a symmetric star is considered to be composed of z Kuhn units 1921
(which may consist of several PI monomers) of length lk 22. The macromolecule has a
radius of gyration Rg, as shown in figure 1, which depicts a 4-arm symmetric star polymer.
!
100
Figure 1. Schematic of a four arm PI star polymer in 2-D. Four PI arms are connected to a SiCl4 molecule forming 4-arm PI star polymer with mass, z, fractal dimension, df, and connective dimension, c. A minimum path, p, with a dimension, dmin, which describes molecular tortuosity, is shown in dark units. The connecting path, s, is shown by dotted straight lines. Scaling features are described in the text. A minimum path from one chain end to another which is through any two arms in the star, as shown in dark, is considered which is composed of p Kuhn units and has a tortuosity dimension of dmin. Connecting the branch point to end points, shown in bold grey dash lines, results in an average connective path, composed of s Kuhn units having a fractal dimension of connectivity, c. These two set of scaling parameters act as mutually !
101
conjugate sets such that p and dmin represent tortuosity due to thermodynamic interactions while c and s represent topological characteristics due to chemical synthesis.
!
102
5.2 Material and Method We investigate star poly-isoprene polymers with 2 (linear), 3, 4 and 6 arms. The star poly-isoprene polymers with 2 (linear), 3, 4 and 6 arms were synthesized by anionic polymerization using high vacuum techniques and chlorosilane chemistry
23
. All
intermediate and final products were analyzed by size exclusion chromatography (SEC) and nuclear magnetic resonance. The molecular weight of the arms (by SEC) and final star polymers (by SEC-MALLS) are given in table 1. Table 1. Synthesis and characterization details for PI star polymers Sr. No.
Mn arm (kg/mol), SEC 1,4-PI
Cal.a
SECb
Mw/Mn
Final star-branched PI (SEC-MALS) Mn, kg/mol
Mw/Mn
f= Mn,star/Mn,arm
1 Linear 74 68 1.01 68.13 1.02 -2 3-arm star 35 38 1.03 101.0 1.01 2.66 3 4-arm star 35 38 1.03 133.2 1.01 3.5 5 6-arm star 35 38 1.03 201.4 1.01 5.3 a Calculated values from chemical stoichiometry, b. SEC/MALS determined values. SANS was performed on dilute solutions of model star isoprenes in deuterated pxylene at 34.5° C. Additionally, 500 ppm of butylhydroxytoluene (BHT) was added to the solvent as a stabilizer. Deuterated p-xylene was purchased from Cambridge Isotopes. The PI samples were equilibrated at 34.5 °C for 2 hours prior to the measurements to ensure complete dissolution of the polymer in solvent. Magnetic stir bars were employed to help with homogenizing the solutions. Less than one weight percent solutions were used, which is well below the overlap concentration for all samples. SANS experiments were carried out at HFIR CG-2 General-Purpose SANS facility at Oak Ridge National Laboratory (ORNL). Experiments were run at sample to detector distances of 18.5m and 0.75m to get low-q and high-q data respectively. Each sample took about 2 hours for the
!
103
two scattering and one transmission runs. The low-q data was calibrated with standards to obtain absolute intensity.
!
104
5.3 Results and Discussion Figure 2 shows SANS from ~1% solutions by weight of polyisoprene in d-xylene solvent. Sample names reflect the number of arms (2 = 2 arm or linear), composition (PI = polyisoprene), molecular weight (38 = 38,000 g/mole) and solvent (X = d-xylene). The Curves have been shifted along y-axis to show overlap in mid and high-q ranges. The SANS curves for linear, 3-arm, 4-arm and 6-arm stars show a remarkable overlap for q > 0.03 Å upon vertical shift, each lying with a range for fractal dimensions of ~1.73±0.04 as shown in figure 3. SANS data was fit using the Unified function with two structural levels for the mass-fractal and persistence regimes as well as a structural level for arm-arm binary interactions. This function was used as the form factor, F(q), in an RPA-like function allowing the determination of the interaction parameter, χ. Figure (2) shows the fits to this function with curves shown for the chain structure, arm-arm interaction and second virial coefficient parts. Because the interaction parameter significantly affects the lowestq data it is not possible, in some cases, to directly determine z from the fit. In these cases it is necessary to fix z to an expected value for a series of samples.
!
105
Figure 2: SANS from solution of ~1% by weight polyisoprene in xylene solvent. The Curves have been shifted along y-axis to show overlap. Fit to SANS data for are shown in bold. The curves have been vertically shifted for resolution. Figure 3 shows some of the fit results for the 38,000 g/mole polyisoprene star polymers. The mass-fractal dimension, Kuhn-length and interaction parameter are all close to constant across this series of polymers. The interaction parameter has a value close to 0.43 for a good solvent. The persistence length is about 12 Å. The mass fractal dimension is close to 1.70.
!
106
Equation (3.51) was used to fit the SANS data from polyisoprene samples (from Table 1). The fitted χ values for all the samples were in the range of 0.39±0.03. We understand that the χ value may be correlated with the fractal dimension, df, using some empirical relations. It is to be pointed here that the fitted value of χ is per persistent length, that is half the Kuhn length, which is the smallest zero entropy unit of the polymer chain. The persistent lengths for the range of polymers remained constant at 11.7±0.9 Å, as shown in figure 3.
Figure 3. The interaction parameter, χ, fractal dimension, df, and the persistent length, lp, vs. functionality, f.
!
107
Figure 4 shows the behavior of the chain dimensions as a function of star functionality for the 38,000g/mole polyisoprene samples. The minimum dimension drops as the star arms straighten out with steric constraints at higher functionality.
The
connectivity dimension drops with increasing functionality as expected. The decrease in dmin leads to an increase in the chain radius of gyration. Increase in functionality at the core of the star is compensated by a reduction in the tortuosity of each arm, as reflected by a decreased dmin as functionality increases.
Figure 4: The minimum dimension, dmin, connectivity dimension, c, and the radius of gyration, Rg, vs. functionality, f. Figure 4 above shows the connectivity, minimum dimension and radius of gyration as a function of number of arm of star polymers. As the functionality increases, !
108
the connectivity, c, of the polymer system increases by the virtue of enhancement in geometrical links at center while the average tortuosity of individual arms reflected by dmin decreases which compensates for a higher connectivity such that the overall fractal dimension remains constant as is explained by figure 3. The increase in functionality and the decrease in dmin results in increase in the radius of gyration. The minimum path, p, as plotted in figure 5(a) shows that the overall path length remains same over the while functionality range as expected since irrespective of functionality, only two of the arms constitute of the minimum path while for linear, the whole chain constitutes of the minimum path, as indicated by plot of (p/z)% in figure 5(b) showing the actual fraction of mass constituting the minimum path. On the other hand, the connective path, s, seems to increase rather continuously with functionality as a result of the change in overall mass as well as crowding in the system. To resolve the effect of increase in mass, the connecting path was normalized by the functionality as shown in figure 5(b), which is an indication, that the crowding at the chain center affects the endto-end distances in star polymers. Another way of looking the ratio is the plot of (s/z)% percentage which is similar in normalization logic of the (s/f) plot, shows a very similar modest increase in the connectivity path with respect to the overall mass as shown in figure 5(b).
!
109
(a)
(b)
Figure 5. (a) The minimum path, p, connecting path, s, and fractal mass, z, vs functionality, f. (b) The minimum path to total mass and connecting path to total mass in percentage and connecting path normalized by functionality (s/f) vs functionality, f. The branch fraction increases with functionality, f, since φbr is given by (1-2/f) using equation (3.19), figure 6. The meandering fraction, φ m , slowly decreases from 0.87 for linear to 0.81 for 6-arm star polymer suggesting that the chain tortuosity is slowly decreasing.
!
110
Figure 6: The mole fraction branch content, φbr and meandering mole fraction, φ m vs. functionality, f. The steric interaction fraction, φ si , plotted in figure 7, is an important quantification of the steric interactions of arms compared to the maximum possible steric interaction. It is 0 for a linear polymer chain and successively increases with increase in functionality to ~0.1 for a 6-arm star polymer. φ si gives the fraction of effective steric interaction under particular topological or solvent conditions relative to what is required to completely stretch the star arms. A general trend of φ si with functionality seems to be
!
111
that of a exponential saturation but higher functionality stars need to be investigated using this approach.
Figure 7. φ si vs. functionality, f.
!
112
5.4 Conclusions A generalized scattering function based on the random phase approximation equation has been proposed which provides a topological description as well as providing the interaction parameter. The χ parameter remains constant along with the fractal dimension, which indicates a possible relationship between these two parameters. A scaling model for symmetric star polymers was presented and the methodology to utilize SANS in order to get the scaling parameters was demonstrated. The average size of star polymers tend to increase with functionality as the tortuosity of arms decrease. The steep change in connective path indicated that the arm ends shift outwards at a higher rate with change in functionality, than the change in coil density. This versatile method to quantify the structural as well as thermodynamic parameters should greatly enhance the capabilities to establish robust structure-property relationships for such systems.
!
113
5.5 References: 1.
Zimm, B. H.; Stockmayer, W. H., The dimensions of chain molecules containing
branches and rings. The Journal of Chemical Physics 1949, 17, 1301-1314. 2.
Widawski, G.; Rawiso, M.; Francois, B., Self-organized honeycomb morphology
of star-polymer polystyrene films. Nature 1994, 369, 387-389. 3.
Grest, G. S.; Fetters, L. J.; Huang, J. S.; Richter, D., Star polymers: Experiment,
theory, and simulation. Advances in Chemical Physics, Vol Xciv 1996, 94, 67-163. 4.
Milner, S. T.; McLeish, T. C. B., Arm-length dependence of stress relaxation in
star polymer melts. Macromolecules 1998, 31, 7479-7482. 5.
Watzlawek, M.; Likos, C. N.; Lowen, H., Phase diagram of star polymer
solutions. Physical Review Letters 1999, 82, 5289-5292. 6.
Hadjichristidis, N.; Pitsikalis, M.; Pispas, S.; Iatrou, H., Polymers with complex
architecture by living anionic polymerization. Chemical Reviews 2001, 101. 7.
De Gennes, P. G., Scaling Concepts in Polymer Physics. Cornell University Press:
New York, 1979. 8.
Daoud, M.; Cotton, J. P., Star shaped polymers - A model for the conformation
and its concentration-dependence. Journal De Physique 1982, 43, 531-538. 9.
Birshtein, T. M.; Zhulina, E. B., Conformations of star-branched macromolecules.
Polymer 1984, 25, 1453-1461. 10.
Batoulis, J.; Kremer, K., Thermodynamic properties of star polymers - Good
solvents. Macromolecules 1989, 22, 4277-4285. 11.
Dozier, W. D.; Huang, J. S.; Fetters, L. J., Colloidal nature of star polymer dilute
and semidilute solutions. Macromolecules 1991, 24, 2810-2814.
!
114
12.
Roovers, J.; Toporowski, P. M.; Douglas, J., Thermodynamic properties of dilute
and semidilute solutions of regular star polymers. Macromolecules 1995, 28, 7064-7070. 13.
Picot, C.; Audouin, F.; Mathis, C., Solutions of stars based on C-60. Structural
behavior as revealed by small angle neutron scattering. Macromolecules 2007, 40, 16431656. 14.
Horton, J. C.; Squires, G. L.; Boothroyd, A. T.; Fetters, L. J.; Rennie, A. R.;
Glinka, C. J.; Robinson, R. A., Small-angle neutron scattering from star-branched polymers in dilute solution. Macromolecules 1989, 22, 681-686. 15.
Fetters, L. J.; Kiss, A. D.; Pearson, D. S.; Quack, G. F.; Vitus, F. J., Rheological
behavior of star-shaped polymers. Macromolecules 1993, 26. 16.
Willner, L.; Jucknischke, O.; Richter, D.; Roovers, J.; Zhou, L. L.; Toporowski,
P. M.; Fetters, L. J.; Huang, J. S.; Lin, M. Y.; Hadjichristidis, N., Structural Investigation of Star Polymers in Solution by Small Angle Neutron Scattering. Macromolecules 1994, 27, 3821-3829. 17.
Wood-Adams, P. M.; Dealy, J. M.; deGroot, A. W.; Redwine, O. D., Effect of
molecular structure on the linear viscoelastic behavior of polyethylene. Macromolecules 2000, 33. 18.
Norman, A. I.; Ho, D. L.; Greer, S. C., Partitioning, fractionation, and
conformations of star poly(ethylene glycol) in isobutyric acid and water. Macromolecules 2007, 40, 9628-9639. 19.
Ramachandran, R.; Beaucage, G.; Rai, D. K.; Lohse, D. J.; Sun, T.; Tsou, A. H.;
Norman, A.; Hadjichristidis, N., Quantification of Branching in Model Three-Arm Star Polyethylene. Macromolecules 2012, 45, 1056-1061.
!
115
20.
Beaucage, G., Determination of branch fraction and minimum dimension of mass-
fractal aggregates. Physical Review E 2004, 70, 031401. 21.
Ramachandran, R.; Beaucage, G.; Kulkarni, A. S.; McFaddin, D.; Merrick-Mack,
J.; Galiatsatos, V., Persistence Length of Short-Chain Branched Polyethylene. Macromolecules 2008, 41, 9802-9806. 22.
Kuhn, W., Über die Gestalt fadenförmiger Moleküle in Lösungen. Kolloid-
Zeitschrift 1934, 68, 2-15. 23.
Hadjichristidis, N.; Iatrou, H.; Pispas, S.; Pitsikalis, M., Anionic polymerization:
High vacuum techniques. Journal of Polymer Science Part a-Polymer Chemistry 2000, 38, 3211-3234.
!
116
APPENDIX A* CALCULATION OF GUINIER AND POWER LAW PREFACTORS FOR MULTI-ARM INTERACTIONS IN STAR POLYMERS
A.1 Calculation of generalized prefactors from inter-arm interactions For fractal polymers, Beaucage’s approach to define fractal exponent is widely utilized . The integral is modified form of Debye and Peterlin’s form for scattering from linear chain aggregates introduced by Benoit 1, 2. It is given by, I(q) ! 2 $ 1−c p c−1 −q 2 R 2 = # 2 & p ∫ n ( p − n ) e g,n dn G "p % 0
(A.1)
The integration is over minimum path, p, and c is the connectivity dimention explained in chapter 3 3-5. Substituting 1, 2, 5, 6, ! 6R 2 $ n = ## 2g,n && " R1 %
dmin 2
! 6R 2 $ dn = ## 2g,n && " R1 % d
=
dmin 2
! 6R 2 $ min p = ## 2g && " R1 %
1 ! 6y $ dmin # 2 & q " R1 %
dmin 2
6 1 d ! 6y $ = 2 dmin min # 2 & R1 q 2 " R1 %
(A.2) dmin −1 2
dy
(A.3)
2
(A.4)
We get 1, 2, 5, 6,
I(q) d = min d f G (qRg )
2 (qRg ) "
∫ 0
(df + dmin 2 % * −1$1− y ' e− y y) 2 ,dy $ ( qR )dmin ' g # &
(A.5)
For generalization in order to account for inter-arm interactions, we use the approach of multiple interactions used by Benoit and later Alessandrini for calculation of interactions amongst arms
7, 8
. For Interaction amongst arms of f-arm star polymers, the equation
(A.1) is expanded to include the double and triple arm interactions expanded and extrapolated from Benoit’s and Alessandrini, to give 7, 8,
!
118
&- f *- 2 * 1− c p c −1 # − q 2 R g2 , i di $++ ((++ 2 (( p ∫ i ( p − i )e ! 0 $, 1 ), p ) ! p p $ f ! 2 2 2 2 I (q) $ - *- 4 * 2 (1− c ) c −1 − q Rg , j − q Rg , k c −1 ! = + ++ ((++ 4 (( p ∫0 j ( p − j )e dj ∫0 k ( p − k )e dk $ , 2 ), p ) ! G $ ! p p p $ - f *- 8 * 3(1− c ) c −1 ! − q 2 R g2 , l − q 2 R g2 , m − q 2 R g2 , n c −1 c −1 l ( p − l )e dl ∫ m ( p − m )e dm ∫ n ( p − n )e dn ! ∫ $+ ++ 3 ((++ p 4 (( p 0 0 0 % , ), ) "
(A.6)
! f where, the interaction integrals are over ## " n
$ f! && = pair of arms. Thereafter, % n!( f − n)!
substituting for variable similar to Beaucage and Benoit 5, 6, d
2
d
2
dmin 2 2 $ min 2 $ min ! 6Rg,i ! 6Rg,i 1 ! 6u $ 6 1 d ! 6u $ i = ## 2 && = dmin # 2 & ⇒ di = ## 2 && = 2 dmin min # 2 & R q R R R 2 " R1 % " 1% " 1 % " 1 % 1 q d
2
d
2
dmin 2 ! 6R 2 $ min ! 6R 2 $ min 1 ! 6v $ 6 1 d ! 6v $ j = ## 2g, j && = dmin # 2 & = dm = ## 2g, j && = 2 dmin min # 2 & q " R1 % R1 q 2 " R1 % " R1 % " R1 % d
2
d
2
dmin 2 ! 6R 2 $ min ! 6R 2 $ min 1 ! 6w $ 6 1 d ! 6w $ k = ## 2g,k && = dmin # 2 & = dn = ## 2g,k && = 2 dmin min # 2 & q " R1 % R1 q 2 " R1 % " R1 % " R1 % d
2
d
dmin −1 2
dmin −1 2
dmin −1 2
2
dmin 2 ! 6R 2 $ min ! 6R 2 $ min 1 ! 6x $ 6 1 d ! 6x $ l = ## 2g,l && = dmin # 2 & ⇒ dl = ## 2g,l && = 2 dmin min # 2 & q " R1 % R1 q 2 " R1 % " R1 % 4 " R1 % d
2
d
2
dmin 2 2 $ min ! 6R 2 $ min ! 6Rg,m 1 ! 6y $ 6 1 d ! 6y $ m = ## g,m = ⇒ dm = = 2 dmin min # 2 & & # & # & # 2 & dmin 2 2 & q " R1 % R1 q 2 " R1 % " R1 % " R1 % d
2
d
2
dmin 2 ! 6R 2 $ min ! 6R 2 $ min 1 ! 6z $ 6 1 d ! 6z $ n = ## 2g,n && = dmin # 2 & = dn = ## 2g,n && = 2 dmin min # 2 & q " R1 % R1 q 2 " R1 % " R1 % " R1 %
d
! 6Rg2 $ min p = ## 2 && " R1 %
dv
dw
dmin −1 2
dmin −1 2
dmin −1 2
dx
dy
dz
(A.7)
(A.7’)
(A.7”)
(A.7”’)
(A.7””)
(A.7””’)
2
(A.8)
in equation (A.6), we get,
!
du
119
5df 2 (qR g )2 ' 3 0 u d min 2 * − u 34 2 −1 01 ! f d min 1 − e u du + ( ! (qR g )d f ∫0 + (qR g )d min ( , ) ! (qR g )2 (qR g )2 ! 5df 2 I (q) ! 1 - f ( f − 1)* d 2 min v d min 2 * w d min 2 * − (v + w ) (vw)343 2 −1010 dvdw = &+ + +1 − ( +1 − (e 2d f d min d min ∫ ∫ ( G 2 ) (qR g ) +, (qR g ) () +, (qR g ) () 0 0 ! 2, ! 2 ( ) (qR g )2 (qR g )2 qR g ! - f ( f − 1)( f − 2)* d 3 min x d min 2 * y d min 2 * z d min 2 + +1 − ( +1 − ( +1 − ! + 3d f d min d min d min ∫ ∫ ∫ ( 6 ) (qR g ) 0 0 0 !% , ,+ (qR g ) )( ,+ (qR g ) )( ,+ (qR g )
5df * − (x + y + z ) (xyz )334 2 (e )(
$ ! ! ! ! ! # ! ! 2 ! −1 0 0 dxdydz 1 ! !"
(A.9) To calculate the exponents of respective asymptotes, we integrate over the same arms to obtain, 5df 2 (qRg )2 ' $ d min 2 * 3 0 3 2 −1 0 d u − u min 4 1 !f ! 1 − e u du + ( ! (qR g )d f ∫0 + (qR g )d min ( ! , ) ! ! 2 (qRg )2 (qRg )2 ! ! d min 2 * 2 I (q) ! 1 - f ( f − 1)* d min v ! − 2 v (( f −1)−1) 2 = &+ + 1 − e v d v + ( # ∫ ∫ ( 2d f d min G +, (qR g ) () 0 0 ! 2 , 2 ) (qR g ) ! ! ! 3 2 2 2 5 5 3d f 2 2 33 d min 2 * − 2 00 −1 0 ! - f ( f − 1)( f − 2)* d 3 min (qRg ) (qRg ) (qRg ) ! 3 3 0 x −3 x 4 4 2 1 1 3 1 − e x d x + ( !+ + ! ∫ ∫0 ∫0 + (qR )d min ( ( 3d 6 ) (qR g ) f 0 !% , !" g , )
(A.10) The exponents with combination terms outside the single, double and triple integrals constitute the Guinier prefactors for fractal arms, 2-arm interactions and 3-arm interactions respectively. Therefore, in order to establish the interaction Guinier prefactors, with respect to the fractal Guinier prefactor, we take,
G f = fG
(A.11)
" f ( f −1) % " f −1% G2 f = $ G 'G = $ # 2 '& f # 2 &
(A.12)
" f ( f −1) ( f − 2 ) % " ( f −1) ( f − 2 ) % G2 f = $ 'G = $ 'G f 6 6 # & # &
(A.13)
!
120
where, Gf, G2f and G3f are the effective Guinier prefactors for the fractal, two-arm interactions and 3-arm interactions respectively. For the power law pre-factor, we get the slopes by calculating the magnitude of asymptotes, following Beaucage’s and Benoit’s procedure, giving the power law pre-factors as 5, 6, "d % G f dmin Γ $ f ' #2& Bf = d Rg f
B2 f =
G2 f d 2min Γ ( d f −1) 2df
Rg
(A.14)
=
( f −1) G f d 2min Γ ( d f −1) 2df
(A.15)
2Rg
# 3d & # 3d & G3 f d 3min Γ % f − 2 ( ( f −1) ( f − 2 ) G f d 3min Γ % f − 2 ( $ 2 ' $ 2 ' B3 f = = 3d f 3d f Rg 6Rg
(A.16)
The above procedure in generic in nature and for accounting any α-body interactions into scattering function, the following form for Guinier prefactor and power law prefactors may be used:
! f $ 1! f $ && G = ## && G f G2α = ## f α α " % " % Gα f d Bα f =
!
α min
(A.17)
#αd & #αd f & #% f &( G f d αmin Γ % f − (α −1) ( Γ% − (α −1) ( % ( $ 2 ' $ 2 ' $ α ' = αd f αd f Rg fRg
121
(A.18)
A.2 References 1.
Debye, P., Molecular-weight determination by light scattering. Journal of
Physical and Colloid Chemistry 1947, 51, 18-32. 2.
Peterlin, A., Makromol. Chem. 1953, 9, 244.
3.
Beaucage, G., Small-angle scattering from polymeric mass fractals of arbitrary
mass-fractal dimension. Journal of Applied Crystallography 1996, 29, 134-146. 4.
Beaucage, G., Approximations leading to a unified exponential power-law
approach to small-angle scattering. Journal of Applied Crystallography 1995, 28, 717728. 5.
Beaucage, G., Determination of branch fraction and minimum dimension of mass-
fractal aggregates. Physical Review E 2004, 70, 031401. 6.
Benoit, H., Hebd. Seances Acad. Sci. 1957, 245, 2244.
7.
Benoit, H., On the Eflect of Branching and Polydispersity on the
Angular Distribution of the Light Scattered by Gaussian Coils. J. Polym. Sci. 1953, 11, 507-510. 8.
Alessandrini, J. L.; Carignano, M. A., Static scattering fucntion for a regular star-
branched polymer. Macromolecules 1992, 25, 1157-1163.
!
122